
Lignocellulosic Waste as a Sole Substrate for Production of Crude Cellulase from Bacillus subtilis PJK6 Under Solid State Fermentation Using Statistical Approach
- Open Access
- Peer Reviewed
- Similarity Checked
- CC BY 4.0
Abstract
The agricultural organic wastes pose major environmental issues and their inappropriate disposal is a major cause of pollution while these as cheap lignocellulosic resources can be utilized for many value added products such as enzymes. The purpose of the present study was to utilize wheat bran as a sole substrate for enhanced cellulase production under submerged fermentation (SMF) or solid state fermentation (SSF) and optimize the various process variables involved in the selected fermentation type. In order to achieve high titer of cellulase, a central composite design (CCD) was constructed and performed for optimization of SSF with five process variables at five coded levels. A 25 full factorial design was constructed leading to a set of 50 experiments that were performed in triplicates. The key variables namely incubation time, temperature, wheat bran and tap water ratio, pH and inoculum size were evaluated. The optimization of the process variables resulted in 1.14 IU/ml of cellulase activity from Bacillus subtilis PJK6 under SSF using wheat bran as a sole organic substrate with tap water. The optimum conditions included incubation time- 72 h, temperature- 45oC, pH- 6, inoculum size- 14% with 1:4 as wheat bran and tap water ratio. The production of cellulase using only moistened wheat bran was demonstrated and found to be significantly controlled by incubation time and temperature while pH showed the least effect. The economic production of valuable and useful enzyme using agricultural residue was achieved at moderate conditions from a GRAS microbe that can benefit the industry as well as the environment.
Article Information
- Received
- Accepted
- Published
Academic Editor: Jianzhong Sun, Biofuels Institute, Jiangsu University, China.
Checked for plagiarism: Yes
Review by: Single-blind
Copyright © 2018 Prabhjot Kaur, et al.
 This is an open-access article distributed under the terms of the Creative Commons Attribution License, which permits unrestricted use, distribution, and reproduction in any medium, provided the original author and source are credited.
Corresponding author: Correspondence: Nishi K. Bhardwaj, Joint Director, Avantha Centre for Industrial Research & Development, Paper Mill Campus, Yamuna Nagar 135001, Haryana, India —
Competing Interests
The authors have declared that no competing interests exist.
Funding
No specific funding statement was provided by the authors.
Data Availability
No data-availability statement was provided by the authors.
Acknowledgements
The authors are thankful to Director, Avantha Centre for Industrial Research & Development, Yamuna Nagar, Haryana, India for providing the facilities to complete this work. The authors also thank the Council of Scientific and Industrial Research (CSIR) of India for support by Grant-in-aid (grant no. 09/1089(001)/2012) for Senior Research Fellows to Prabhjot Kaur.
Citation:
Introduction
Agro residues are abundantly produced as byproducts during crop production and cause major environmental issues for their disposal and management. Stubble burning has become prominent due to factors such as increased mechanization, reduced livestock number, long duration for composting and unavailability of alternate economically viable solutions 1, 2. Inappropriate disposal practices of agro residues detrimentally affect the air quality causing severe health concerns 2. Being rich in lignocellulosic content, these can be used in production of many value added products such as enzymes, paper, paperboard, etc. with simultaneous reduction in the environmental load. Among the different industrial enzymes, cellulases hold a significant market owing to their wide area of applications that include food, brewery, textile, pulp and paper industries. Cellulases are the hydrolytic enzymes comprising of three major types to yield sugars by cleaving the 1, 4-β-D-glycosidic linkages of the cellulose chain 3. Besides, cellulases have been an area of active research since early 1950s due to their enormous potential to convert lignocellulose to glucose and soluble sugars 4 that in turn can be utilized for biofuel generation. This presents the requirement of economic production of cellulase to make it more feasible and cost effective for industrial use.
Microorganisms have widely been exploited as a major source for production of a diverse range of industrial enzymes. Microbial enzymes are also preferred on industrial scale due to their easy production process, plentiful supply and better controllability on all phases of the enzyme production 5. Nowadays, bacteria are becoming preferred choice for the isolation and production of different enzymes due to their higher growth rate, multiple enzyme complexes and ability to tolerate wide variety of environmental stress 6, 7. Among the different microbes commercially exploited, cellulase production from major bacterial group involves the genus Acidothermus, Bacillus, Clostridium, Pseudomonas and Rhodothermus8. Members of genus Bacillus produce a great variety of enzymes 6, 9, 10, 11, 12, 13, 14, 15, 16. Moreover, they are known to utilize a wide range of substrates that include solid organic waste residues from agriculture, forest, mills etc. to provide concurrent benefit of waste management with economic production of enzymes.
Cellulase production also requires the development of a suitable bioprocess and the medium for fermentation constituting a cheap substrate 8 such as wheat bran which is a low-cost agro-industrial residue. Since the enzyme production from microbial source is a multivariable controlled process, it becomes essential to optimize the key factors i.e. media composition and environmental conditions for obtaining high titer and productivity of enzyme 17. For this, statistical tool can provide the benefit of optimization of different variables on the basis of their mutual interactive and influential role for a specific response. Hence, response surface methodology (RSM) was applied as it is a useful statistical technique for analyzing the effect of several independent variables. A central composite design (CCD) was constructed to evaluate the interactive and mutual impact of the key variables on cellulase production with an objective to obtain high yields of cellulase in a cost effective and eco-friendly bioprocess.
Material and Methods
Chemicals
Media and buffer were prepared using chemicals of high purity and analytical grade. CMC(Carboxy Methyl Cellulose), peptone, agar, yeast extract, nutrient agar were purchased from HiMedia Laboratories Ltd., India; Sodium hydrogen diphosphate and Sodium dihydrogen phosphate were purchased from Qualigens Fine Chemicals Ltd., India; and DNS was purchased from Merck and Co. Inc., USA. Wheat bran was locally collected. It was washed, dried and then filtered through 16 mesh screen to keep the particle size uniform throughout the studies.
Sample Collection and Processing
The samples for isolation of cellulase producing microorganisms were collected from various places which serve as their natural habitat. Typical examples of such sites from where the samples were collected include sludge from biogas plant, cow dung, degraded litter, degrading lignocellulosic biomass, soil from agricultural fields, sludge from paper mill, deteriorating sugarcane in soil, kitchen garden soil, decaying wood etc. All the samples collected were divided in two parts and one part of each was heat treated by keeping at 60oC for two days.
Isolation of Microorganisms
The microorganisms producing cellulase were isolated by Enrichment technique using 1% CMC (Carboxy Methyl Cellulose) based on the hypothesis that if the microorganisms are provided with cellulose as a sole carbon source in the medium for their growth, then only those who can produce cellulase enzyme to utilize cellulose for their growth and the metabolic needs could survive. Since cellulose is insoluble in water therefore its analogue CMC was used as a cellulosic substrate in the medium. To isolate the bacteria, 5 g of the samples both heat treated and without any treatment were inoculated into 100 ml of 1% CMC (by mass per volume) and the enrichment was carried out by incubating under shaking (200 rpm) for 24–48 h at 37oC. The enriched broth was again inoculated into 100 ml of 1% CMC and incubated under same conditions. This process was repeated 3-4 times and finally the microorganisms from the enriched broth were isolated by spread plate technique. Firstly, appropriate dilutions of enriched broth were prepared and then plated on wheat bran agar medium containing (for 100 ml): wheat bran 1 g, peptone 0.5 g, yeast extract 0.5 g, agar 2 g. Plates were incubated at 37°C for 48 h and pure cultures were obtained by repeated streaking (streak plate technique) on wheat bran agar medium and stored at 4oC.
Qualitative Screening of Microorganisms
Pure colonies of microbial isolates were assayed qualitatively for their capability to produce cellulase by growing them on CMC agar medium and wheat bran agar medium at 37oC for 48 h. CMC agar medium contained (for 100 ml): CMC 0.5 g, peptone 0.5 g, yeast extract 0.5 g, agar 2 g. The plates of developed bacterial colonies were flooded with congo red solution (0.5% Congo red dye and 5% ethanol in distilled water) for 30 minutes. Then destaining was done with 1M sodium chloride solution by changing the solution every 20 minutes for 6 h. The cellulase producing microorganisms were identified by the formation of yellow zone of hydrolysis around their line of streak against red background. The diameter of the respective zone of hydrolysis was recorded. The microbial cultures showing clear zone of hydrolysis around the colonies were selected and used for quantitative assay.
Identification of Cellulolytic Bacterial Isolate
The cellulolytic microorganism was isolated from soil sample and routinely cultivated on nutrient agar at 37°C for 24 h. Stock culture was maintained and stored at 4°C on nutrient agar. It was identified by analyzing the 16S rRNA homology through gene sequencing from Bhat Biotech Ltd., Bengaluru. Amplification of the 16S rRNA gene was performed using the following primers:
Forward primer: 5’-AGAGTTTGATCCTGGCTCAG-3’
Reverse Primer: 5’-ACGGCTACCTTGTTACGACTT-3’
PCR was performed in a total volume of 50 µl in a 0.2 ml thin walled PCR tube with the components as follows: Nuclease free water - 32 µl, Genomic DNA - 2.0 µl, Forward Primer (1µM) - 2.0 µl, Reverse Primer (1µM) - 2.0 µl, 10X Reaction Buffer - 10 µl, dNTP Mix (2.5mM) - 2 µl, Taq DNA polymerase (2.5 U/µl) - 0.5 µl.
The amplification was carried out in a Master cycler® Thermocycler (DNA-AMP Bhat Biotech). Initial denaturation was carried out at 94oC for 2 minutes followed by 40 cycles of denaturation at 94oC for a minute, annealing at 55oC for a minute and extension at 72oC for minute. Final extension was carried out at 72oC for 10 minutes. The ~1500 bp PCR product was purified to remove unincorporated dNTPS and Primers before sequencing using PCR purification kit (GENEASY PCR PRODUCT PURIFICATION KIT). Both strands of the rDNA region amplified by PCR were sequenced by automated DNA sequence -3037xl DNA analyzer from Applied Biosystems using BigDye® Terminator v3.1 cycle sequencing Kit (Applied Biosystems). Sequence data were aligned and dendrograms were generated using Sequence analysis software version 5.2 from applied biosystems. The sequences obtained for plus and minus strands were aligned using appropriate software before performing bioinformatics. Sequences were compared to the non-redundant NCBI database using BLASTN, with the default settings used to find sequences closest to each other. The Expected value and e values were noted for the most similar sequences. Ten similar neighbors were aligned using CLUSTAL W2. The multiple-alignment file thus obtained was then used to create a Phylogram using the MEGA5 software.
Cellulase Production in Fermentation Media
Cellulase production was carried out using wheat bran as substrate under submerged fermentation (SMF) as well as solid state fermentation (SSF) to select the suitable fermentation type (Solid or submerged) for further optimization. Under SMF, modified Horikoshi medium was used to inoculate the seed culture of cellulolytic Bacillus subtilis PJK6. The 100 ml of medium contained: 2 g wheat bran, 0.5 g peptone, 0.5 g potassium nitrate, 0.5 g yeast extract, 0.1 g potassium di hydrogen phosphate, 0.01 g magnesium sulphate, in 250 ml capacity Erlenmeyer flasks. Each of the flasks containing 50 ml of modified Horikoshi medium at pH 7. The contents were sterilized by autoclaving at 15 psi for 20 min. After cooling, medium was inoculated with 18 h old inoculum and 0.1 ml (0.2%) volume. The incubation was carried out at 37oC under shaking at 150 rpm for 48 h. Cellulase as crude enzyme was extracted from the culture filtrate by centrifugation at 10,000 rpm for 30 min at 4oC and the clear supernatant (crude enzyme) was used for cellulase assay.
The fermentation media for SSF contained 5 g wheat bran, moistened with 10 ml of tap water in 250 ml Erlenmeyer flask. It was inoculated with 18 h old inoculum and 10% volume. The incubation was carried out for 72 h at 37°C. The crude cellulase was extracted from the medium using 100 ml distilled water with muslin cloth and assayed for cellulase activity using DNS (dinitrosalicylic acid) reagent.
Cellulase Assay
Cellulase activity was assayed by measuring the amount of reducing sugars liberated from CMC (Carboxy Methyl Cellulose) as a consequence of enzyme-substrate reaction using 3, 5-dinitrosalicylic acid (DNS) reagent 18. The reaction mixture (0.5 ml) containing 250 μl of 1% CMC as substrate prepared in appropriate buffer (0.05M Sodium citrate buffer, pH 4.8) was mixed with 20 μl of appropriately diluted crude enzyme extract and 230 μl of buffer. For blank, only 250 μl buffer was taken without any enzyme and total volume of buffer and enzyme was fixed at 250 μl for any reaction mixture. The reaction mixture was incubated at 55°C for 30 min and then the reaction was terminated by adding 1.5 ml of DNS reagent. A control was run simultaneously which contained all the reagents but the reaction was terminated prior to the addition of enzyme extract. The contents were placed in a boiling water bath for 15 min and then cooled to room temperature. The absorbance of the resulted color was measured against the control at 540 nm in a spectrophotometer. One international unit of cellulase activity is defined as the amount of enzyme catalyzing the release of 1μmol/min of reducing sugar equivalent to glucose under the specified assay conditions. Enzyme production was expressed as IU/ml. All the experiments were carried out independently in triplicate and the results presented are mean of the three values.
RSM for Optimization of SSF
In order to investigate the individual and interactive role of crucial process variables of SSF to optimize cellulase production, multivariate analysis was done via Response Surface Methodology (RSM) using Design Expert® Version 9.0, Stat-Ease, Inc. The optimization included five independent and different process variables that could have significant effect on the production of cellulase. A full factorial design with 25trails was investigated with a total number of 50 experiments. The important variables that were investigated include incubation time, temperature, wheat bran and tap water ratio, pH and inoculum size at five coded levels (-α, -1, 0, +1, +α) as shown in Table 1. The experiment set constructed in CCD had 32 different combinations for factorial design, out of which 10 different combinations of key variables were for axial point and 8 trails for replication of central point (Table 2).
Table 1. Experimental range of coding of each process variable studied using CCD in terms of actual factors for the production of cellulase by Bacillus subtilis PJK6 under SSF| Process variable | Symbol | Five different levels of coding with a centre zero | ||||
| -α | -1 | 0 | 1 | +α | ||
| Incubation time (IT), h | A | -9.08 | 24 | 48 | 72 | 105.08 |
| Temperature (T), °C | B | 19.66 | 30 | 37.5 | 45 | 55.34 |
| Wheat bran: Tap water (WR) | C | 1: 0.62 | 1: 2 | 1: 3 | 1: 4 | 1: 5.38 |
| pH | D | 3.93 | 6 | 7.5 | 9 | 11.07 |
| Inoculum size (IS), % | E | 0.49 | 6 | 10 | 14 | 19.51 |
| Std | Variables | Cellulase activity (IU/ml) | |||||
| A:IT(h) | B:T(⁰C) | C:WR(g/ml) | D:pH | E:IS (%) | Experimental value | Predicted value | |
| 1 | 24.00 | 30.00 | 2.00 | 6.00 | 6.00 | 0.07 | 0.09 |
| 2 | 72.00 | 30.00 | 2.00 | 6.00 | 6.00 | 0.10 | 0.10 |
| 3 | 24.00 | 45.00 | 2.00 | 6.00 | 6.00 | 0.15 | 0.10 |
| 4 | 72.00 | 45.00 | 2.00 | 6.00 | 6.00 | 0.53 | 0.49 |
| 5 | 24.00 | 30.00 | 4.00 | 6.00 | 6.00 | 0.20 | 0.23 |
| 6 | 72.00 | 30.00 | 4.00 | 6.00 | 6.00 | 0.13 | 0.15 |
| 7 | 24.00 | 45.00 | 4.00 | 6.00 | 6.00 | 0.28 | 0.25 |
| 8 | 72.00 | 45.00 | 4.00 | 6.00 | 6.00 | 0.55 | 0.56 |
| 9 | 24.00 | 30.00 | 2.00 | 9.00 | 6.00 | 0.47 | 0.53 |
| 10 | 72.00 | 30.00 | 2.00 | 9.00 | 6.00 | 0.56 | 0.58 |
| 11 | 24.00 | 45.00 | 2.00 | 9.00 | 6.00 | 0.22 | 0.19 |
| 12 | 72.00 | 45.00 | 2.00 | 9.00 | 6.00 | 0.66 | 0.62 |
| 13 | 24.00 | 30.00 | 4.00 | 9.00 | 6.00 | 0.38 | 0.41 |
| 14 | 72.00 | 30.00 | 4.00 | 9.00 | 6.00 | 0.36 | 0.37 |
| 15 | 24.00 | 45.00 | 4.00 | 9.00 | 6.00 | 0.13 | 0.08 |
| 16 | 72.00 | 45.00 | 4.00 | 9.00 | 6.00 | 0.46 | 0.43 |
| 17 | 24.00 | 30.00 | 2.00 | 6.00 | 14.00 | 0.03 | 0.03 |
| 18 | 72.00 | 30.00 | 2.00 | 6.00 | 14.00 | 0.19 | 0.21 |
| 19 | 24.00 | 45.00 | 2.00 | 6.00 | 14.00 | 0.38 | 0.34 |
| 20 | 72.00 | 45.00 | 2.00 | 6.00 | 14.00 | 0.89 | 0.91 |
| 21 | 24.00 | 30.00 | 4.00 | 6.00 | 14.00 | 0.16 | 0.18 |
| 22 | 72.00 | 30.00 | 4.00 | 6.00 | 14.00 | 0.22 | 0.27 |
| 23 | 24.00 | 45.00 | 4.00 | 6.00 | 14.00 | 0.51 | 0.51 |
| 24 | 72.00 | 45.00 | 4.00 | 6.00 | 14.00 | 1.14 | 0.98 |
| 25 | 24.00 | 30.00 | 2.00 | 9.00 | 14.00 | 0.32 | 0.34 |
| 26 | 72.00 | 30.00 | 2.00 | 9.00 | 14.00 | 0.54 | 0.56 |
| 27 | 24.00 | 45.00 | 2.00 | 9.00 | 14.00 | 0.33 | 0.30 |
| 28 | 72.00 | 45.00 | 2.00 | 9.00 | 14.00 | 0.97 | 0.90 |
| 29 | 24.00 | 30.00 | 4.00 | 9.00 | 14.00 | 0.23 | 0.23 |
| 30 | 72.00 | 30.00 | 4.00 | 9.00 | 14.00 | 0.34 | 0.36 |
| 31 | 24.00 | 45.00 | 4.00 | 9.00 | 14.00 | 0.24 | 0.21 |
| 32 | 72.00 | 45.00 | 4.00 | 9.00 | 14.00 | 0.71 | 0.72 |
| 33 | -9.08 | 37.50 | 3.00 | 7.50 | 10.00 | 0.16 | 0.16 |
| 34 | 105.08 | 37.50 | 3.00 | 7.50 | 10.00 | 0.75 | 0.78 |
| 35 | 48.00 | 19.66 | 3.00 | 7.50 | 10.00 | 0.04 | -0.14 |
| 36 | 48.00 | 55.34 | 3.00 | 7.50 | 10.00 | 0.09 | 0.30 |
| 37 | 48.00 | 37.50 | 0.62 | 7.50 | 10.00 | 0.41 | 0.42 |
| 38 | 48.00 | 37.50 | 5.38 | 7.50 | 10.00 | 0.33 | 0.36 |
| 39 | 48.00 | 37.50 | 3.00 | 3.93 | 10.00 | 0.37 | 0.40 |
| 40 | 48.00 | 37.50 | 3.00 | 11.07 | 10.00 | 0.60 | 0.61 |
| 41 | 48.00 | 37.50 | 3.00 | 7.50 | 0.49 | 0.35 | 0.35 |
| 42 | 48.00 | 37.50 | 3.00 | 7.50 | 19.51 | 0.60 | 0.63 |
| 43 | 48.00 | 37.50 | 3.00 | 7.50 | 10.00 | 0.33 | 0.34 |
| 44 | 48.00 | 37.50 | 3.00 | 7.50 | 10.00 | 0.33 | 0.34 |
| 45 | 48.00 | 37.50 | 3.00 | 7.50 | 10.00 | 0.33 | 0.34 |
| 46 | 48.00 | 37.50 | 3.00 | 7.50 | 10.00 | 0.33 | 0.34 |
| 47 | 48.00 | 37.50 | 3.00 | 7.50 | 10.00 | 0.33 | 0.34 |
| 48 | 48.00 | 37.50 | 3.00 | 7.50 | 10.00 | 0.33 | 0.34 |
| 49 | 48.00 | 37.50 | 3.00 | 7.50 | 10.00 | 0.33 | 0.34 |
| 50 | 48.00 | 37.50 | 3.00 | 7.50 | 10.00 | 0.33 | 0.34 |
Data Analysis and Validation
All the experimental sets of CCD for SSF optimization were performed in triplicate and the resulted data were utilized for analysis of variance (ANOVA) using Design Expert® Version 9.0, Stat-Ease, Inc. The response as cellulase activity was also analyzed for Fischer test to evaluate whether a given term is significant or not. The optimum value of the process variables was attained from the graphical and numerical analysis using Design expert software. Results and regression equation of the constructed model were also confirmed and the model was validated by conducting the experiment for optimum production of cellulase.
Scale up of the Enzyme Production
The cellulase production at optimum conditions was scaled up to three levels and the cellulase activity was evaluated. The SSF was initially carried out and validated in 250 ml Erlenmeyr flask with 5 g wheat bran, 20 ml tap water at 45°C for 72 h during optimization and it was considered as control for scale up. The cellulase production was then carried out in 500 ml, 1 L and 2 L Erlenmeyr flask with 10 g, 20 g and 40 g of wheat bran, respectively whereas the ratio of wheat bran and tap water was kept same along with other process conditions.
Results
Isolation of Microorganisms
To isolate cellulase producing miocroorganisms, 12 samples from various places were collected locally from Yamuna Nagar. These samples were heat treated to isolate heat resistant or spore forming bacteria such as Bacillus. After enrichment of these samples, a total of 47 microbial isolates was obtained on wheat bran agar medium.
Qualitative Screening for Cellulase Production
The microbial isolates were screened by plate assay on CMC agar and wheat bran agar, out of which only 2 isolates (PJK 6 and PJK 7) produced the zone of hydrolysis on CMC agar and wheat bran medium both. The diameter of the respective zone of hydrolysis of the isolates PJK 6 and PJK 7 on CMC agar was 0.50 cm and 0.30 cm, respectively. The zone of hydrolysis produced by PJK 6 on CMC agar medium was larger than that of PJK 7 as shown in Figure 1. Both the isolates were also screened on xylan agar medium but no zone of hydrolysis was observed. Besides, zone of hydrolysis on CMC agar medium and wheat bran agar medium PJK 6 is also shown in Figure 2.
Figure 1. Zone of hydrolysis on CMC agar by PJK 6 and PJK 7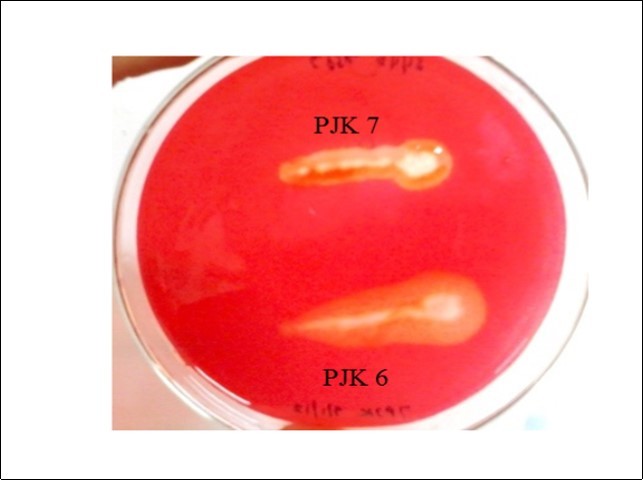
Download figure
Figure 2. PJK 6 showing zone of hydrolysis on (a) CMC agar (b) Wheat bran agar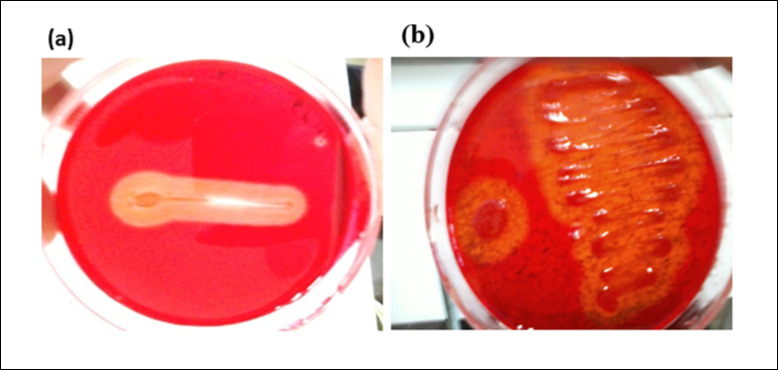
Download figure
Identification of Cellulolytic PJK6 Strain
The bacterial isolate was examined under microscope after gram staining that showed the bacterium to be a gram positive rod. It was identified as B. subtilis on the basis of 16S rRNA gene sequencing for homology done at Bhat Biotech Ltd., Bengaluru. The Clustal programme was used to align the sequence of the 16S rRNA gene from PJK6 and that of matching sequences from 10 nucleotide sequences to generate the phylogentic tree. For phylogenetic analyses, Maximum Likelihood method was used based on the Tamura-Nei model. The tree with the highest log likelihood (-2220.9733) has been shown in Figure 3. NCBI database was used to match and compare the existing sequences using the Blast N programme with that obtained after gene sequencing of 16S rRNA of PJK6. The sequence was found to match the best with that of B. subtilis strain with a high score and low expect value indicating the greatest homology. The analysis involved 11 nucleotide sequences. Codon positions included were 1st+2nd+3rd+Noncoding. All positions containing gaps and missing data were eliminated. There were a total of 1427 positions in the final dataset. Evolutionary analyses were conducted in MEGA5 software.
Figure 3. A phylogenetic tree constructed using the Maximum Likelihood method showing the highest log likelihood (-2220.9733) for the sequence of the 16S rRNA gene from PJK6 and that of matching sequences from 10 nucleotide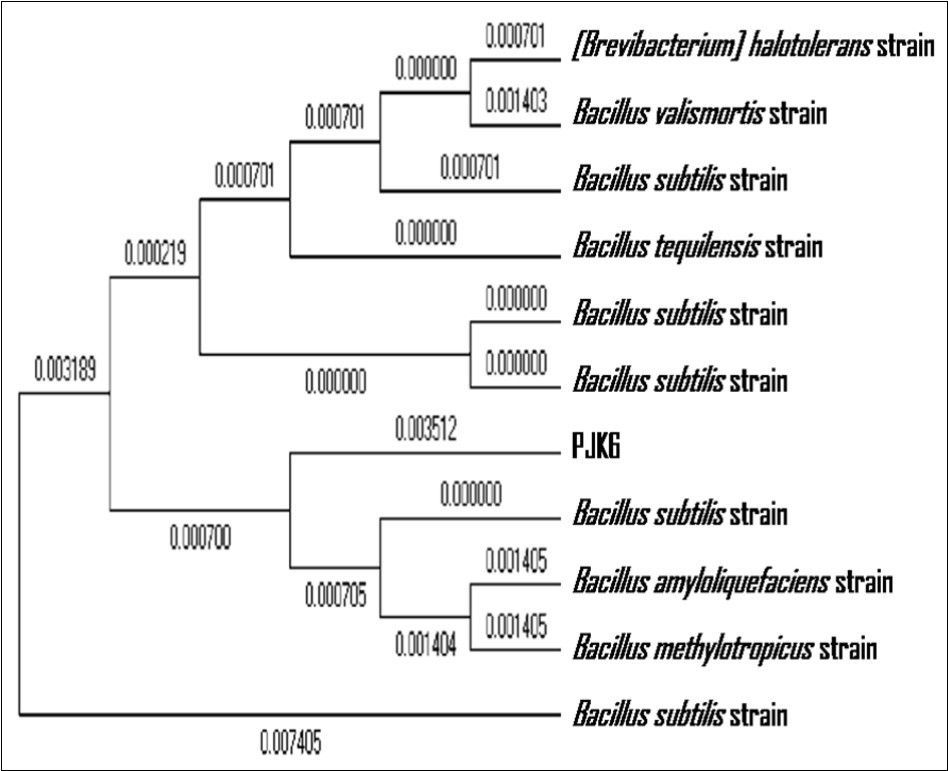
Download figure
Selection of Fermentation Type
Cellulase activity of crude enzyme from both fermentation media i.e. SSF and SMF was assayed and the selection of fermentation type was based on primary response of cellulolytic B. subtilis PJK6. The SMF using modified Horikoshi medium resulted in 1.37 IU/ml cellulase activity while 0.72 IU/ml of cellulase activity was obtained for 100 ml of extract under SSF using wheat bran and tap water translating to 1.44 IU per gram of dry substrate (IU/gds). Although there was no significant difference in the cellulase activity under SMF and SSF, the optimization of cellulase production was carried out under SSF as it is scarcely explored in the case of cellulase production even when it simulates the natural environmental conditions for the microbe utilizing cellulose.
Central Composite Design
The response of 32 trails constructed in the Design expert in CCD as cellulase activity (IU/ml) is shown in the Table 2. The second order polynomial equation showed the best fit for the response of the CCD as given below:
Where, Y is the cellulase activity (IU/ml) whereas A, B, C, D and E denote incubation time, temperature, ratio of wheat bran and tap water, pH and inoculum size, respectively. The Fischer’s test (F-test) was done for analysis of variance (ANOVA) to evaluate statistical significance of the model equation and regression analysis was also done that was found to be statistically significant at 99% confidence level. The model F-value was found to be 27.59 as shown by F-test indicating the model to be significant (Table 3). The desired value of P>F lies below 0.05 for a model to be significant which was observed to be 0.01% for the present model. It indicated the statistical significance of the model for cellulase production and there was only 0.01% chance that a “Model F Value” was not significant which could occur due to noise. The model terms, which were found to have P>F less than 0.05 were also considered to be significant. For the present model, R2 was 0.9501 that also showed the aptness of the model (Table 4). Furthermore, Adj R2 value and Pred R2 value should not have a difference greater than 2 to be in a good agreement which was fulfilled in the present model with Adj R2 value being 0.9156 and Pred R2 value being 0.7801. In the model, the Adj R2corrects and adjusts the R2 value for the number of terms and sample size. With the help of statistical analysis, it is possible to examine the experimental factors which can produce signals that are large in comparison to noise 14 and for the present model the signal to noise ratio of 25.19 indicated an adequate signal.
Table 3. Results of regression analysis for response surface quadratic model of CCD| Source | Sum of squares | df | Mean square | F value | p-valueProb> F |
| Model | 2.59 | 20 | 0.13 | 27.59 | < 0.0001 |
| A-IT | 0.74 | 1 | 0.74 | 158.01 | < 0.0001 |
| B-T | 0.37 | 1 | 0.37 | 78.22 | < 0.0001 |
| C-WR | 6.347E-003 | 1 | 6.347E-003 | 1.35 | 0.2546 |
| D-pH | 0.087 | 1 | 0.087 | 18.52 | 0.0002 |
| E-IS | 0.15 | 1 | 0.15 | 31.70 | < 0.0001 |
| AB | 0.30 | 1 | 0.30 | 63.35 | < 0.0001 |
| AC | 0.017 | 1 | 0.017 | 3.58 | 0.0686 |
| AD | 3.066E-003 | 1 | 3.066E-003 | 0.65 | 0.4258 |
| AE | 0.057 | 1 | 0.057 | 12.05 | 0.0016 |
| BC | 7.008E-004 | 1 | 7.008E-004 | 0.15 | 0.7021 |
| BD | 0.25 | 1 | 0.25 | 52.51 | < 0.0001 |
| BE | 0.18 | 1 | 0.18 | 39.24 | < 0.0001 |
| CD | 0.13 | 1 | 0.13 | 28.47 | < 0.0001 |
| CE | 5.261E-004 | 1 | 5.261E-004 | 0.11 | 0.7403 |
| DE | 0.036 | 1 | 0.036 | 7.61 | 0.0099 |
| A^2 | 0.032 | 1 | 0.032 | 6.86 | 0.0139 |
| B^2 | 0.11 | 1 | 0.11 | 23.79 | < 0.0001 |
| C^2 | 4.563E-003 | 1 | 4.563E-003 | 0.97 | 0.3325 |
| D^2 | 0.048 | 1 | 0.048 | 10.22 | 0.0033 |
| E^2 | 0.042 | 1 | 0.042 | 9.03 | 0.0054 |
| Residual | 0.14 | 29 | 4.698E-003 | ||
| Lack of Fit | 0.14 | 22 | 6.193E-003 | ||
| Pure Error | 0.000 | 7 | 0.000 | ||
| Cor Total | 2.73 | 49 |
| Term | Value | Term | Value |
| Std. Dev. | 0.069 | R-Squared | 0.9501 |
| Mean | 0.38 | Adj R-Squared | 0.9156 |
| C.V., % | 18.21 | Pred R-Squared | 0.7801 |
| PRESS | 0.60 | Adeq Precision | 25.195 |
The predicted enzyme activity held reasonable agreement with the experimental data as shown in Figure 4 (a). The normal probability plot (Figure 4b) of the residual asseses whether the data assumed to have errors that are normally distributed and independent of each other deviates from the assumption or whether the error variance is homogenous or not. The purpose of using studentized residuals was to provide standardization, so that the studentized residuals produced a set of statistics that behaved in a standard way under ideal conditions 14.
Figure 4. CCD graphs (a) Plot for predicted value versus actual value of cellulase activity (b) Normal probability plot of studentized residuals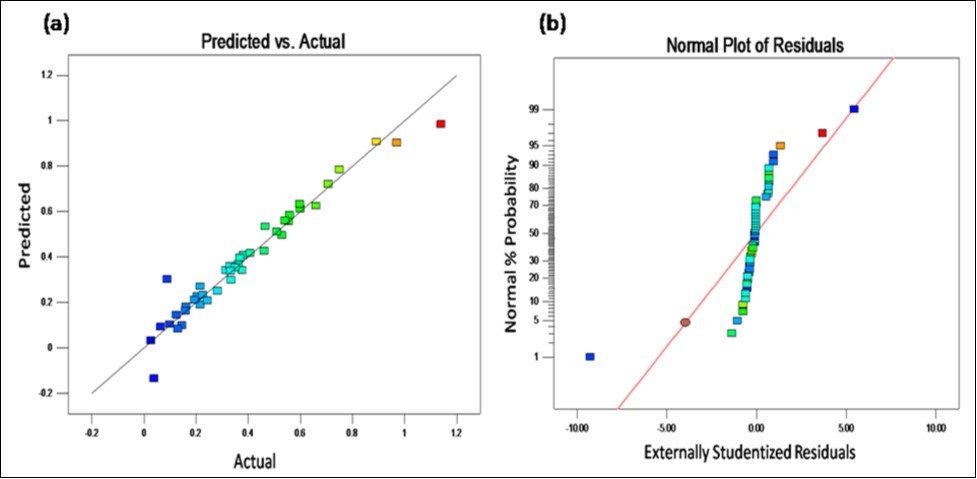
Download figure
Effects of Variables on Cellulase Activity
The study of response surfaces suggests the optimal conditions of the design variables to predict the maximum cellulase activity as response. The contour plots as shown in Figure 5 (a) and (b) suggested the increase in cellulase activity with increasing incubation time which was a significant factor. Three dimensional response surface graphs were also constructed by plotting the response as cellulase activity on the Z-axis against two independent variables. Response surface plots of CCD showed the high titer of cellulase activity at high point of incubation time and temperature both whereas the pH should be at low point (Figure 6a and 6b). The optimum conditions for enhanced production of cellulase by B. subtilis PJK6 were found to be 5 g of wheat bran wetted with 20 ml tap water to support 14% inoculum size at pH 6 and 45°C temperature for 72 h of incubation time. Besides, the bacterium was able to produce significant titer of cellulase at alkaline pH indicating its wide range of pH tolerance. The cellulase activity at pH 9 was the second highest with wheat bran: tap water being 1:2, inoculum size 14% and temperature 45°C for 72 h of incubation time.
Figure 5. Response surface plots showing cumulative effect on cellulase (CMCase) production (a) Contour plots for combined effect of incubation time and temperature (b) Contour plots for combined effect of incubation time and pH
Download figure
Figure 6. Response surface plots showing cumulative effect on cellulase (CMCase) production (a) Maximum cellulase activity at 1 level of temperature and incubation time both (b) Highest cellulase activity at -1 level for pH and 1 level of incubation temperature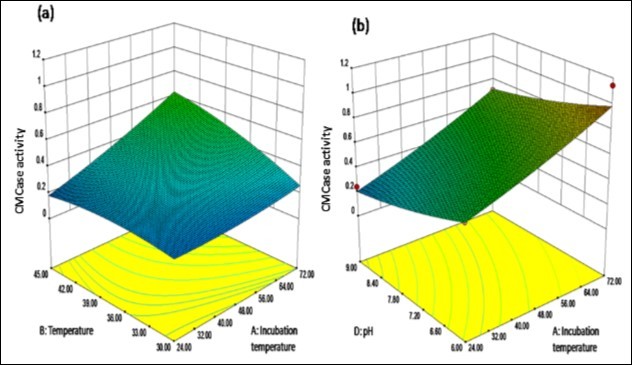
Download figure
Validation of Experimental Model
The cellulase production was carried out at optimized conditions which confirmed the results and regression equation of the constructed model indicating the validation of model. The constructed model showed the predicted value of 0.98 IU/ml for the maximum cellulase production at given set of conditions which was found to be comparable to actual value of 1.14 IU/ml. Statistical optimization of fermentation process conditions resulted in 58% increase in cellulase activity from unoptimised 0.72 IU/ml.
Scale up of the Enzyme Production
The cellulase production using CCD optimized conditions was scaled up from 250 ml to 2 L flask levels. The cellulase activity was observed to be 1.14 IU/ml, 1.18 IU/ml, 1.22 IU/ml, and 1.28 IU/ml for the flask levels of 250 ml, 500 ml, 1 L and 2 L, respectively which indicated an efficient scaling up with consistent enzyme activity. It was therefore, likely that optimization using CCD would be relevant during scale up studies.
Discussion
The cellulosic biomass is a renewable and abundant resource with great potential for bioconversion to value-added bioproducts. Agricultural residues or other lignocellulosic wastes are improperly disposed of and cause different environmental and health hazards. Their immense potential to nurture the microbial growth is explored here. Cellulolytic bacteria were isolated and screened using cost effective agricultural residue wheat bran. As evident from the results, wheat bran can be utilized for isolation, screening as well as production of cellulase producing microorganisms. PJK 6 and PJK 7, two isolates were found to be cellulolytic but PJK 6 was producing high titer of cellulase under submerged and solid state fermentation conditions. Both types of fermentation had wheat bran as sole carbon source. Earlier Nagar et al., 2012 19 demonstrated the successful implementation of this cost effective agricultural residue for screening of xylanolytic microorganisms. Furthermore, it can also be used for the isolation since it provides the selectivity for the growth of cellulolytic and xylanolytic microorganisms. But the formation of zone of hydrolysis on wheat bran agar by any microorganism can be attributed to xylanase activity and/or cellulase activity due to lignocellulosic nature of the substrate. Thus optimization of fermentation conditions using wheat bran can provide cost effective production of cellulase. In general, the optimization of different parameters is carried out using one variable at a time approach while it has a disadvantage of not exhibiting the interactive outcome of different variables at a time. The statistical approach can provide the cumulative effect in lesser period of time. Earlier also, statistical approach for optimization of production media and parameters has shown encouraging results. There have been many researchers reporting the enhanced production of cellulase by using one-variable-at-a-time approach but only a few reports are available for statistical optimization.
The cellulolytic strain Bacillus subtilis PJK6 after optimization has shown 58% increase in the production of cellulase which shows the effectiveness of using statistical method. The solid state fermentation medium which had only moistened wheat bran and the moderate conditions of incubation made the process of cellulase production economical and convenient. The B. subtilis PJK6 is a GRAS (Generally Regarded As Safe) microbe and does not pose any risk to the environment or the manpower involved, adding another advantage to the process. In the past studies, Singh et al., 2014 15 reported the optimization of medium for Bacillus amyloliquefaciensSS35 using CCD which resulted in 3 fold increase in cellulase activity. When the fermentation parameters were optimized using one-variable-at-a-time approach, it resulted in only one fold increase leading to altogether 4 fold increase with 0.693 U/ml after complete optimization from unoptimised 0.161 U/ml. Another study 10 reported 8 fold increment in cellulase activity from B. subtilis AS3 by using statistical approach resulting in 0.56 U/ml in shake flask and 0.75 U/ml in bioreactor. Production from B. amyloliquefaciensUNPDV-22 16 using statistical approach resulted in 13 U/ml of cellulase activity.
Furthermore, the distinct feature of B. subtilis PJK6 lies in cellulase production at wide range of pH and moderately high temperature. As evident from the results and Table 2, the high cellulase production by the B. subtilis PJK6 has been shown at pH 6 and 9 both at 45oC. This makes it useful for industrial application where the conditions of fluctuating pH and slightly high temperature are likely to occur.
Conclusions
Cellulases are important industrial enzymes with wide range of applications and their cost effective production is a big challenge for which the use of organic waste agro-residue as a sole substrate was investigated. The microbial strain B. subtilis PJK6 was able to produce high cellulase titer with wheat bran and tap water as media components at moderately high temperature under SSF with almost equivalent activity at pH 6 and 9. The scale up study of enzyme production was also found to be consistent for cellulase activity indicating the potential of SSF for cellulase production. Optimization using statistical methodology showed the most significant factor to be incubation time while the ratio of wheat bran and tap water had minimal effect on cellulase production. There was 58% increase in cellulase activity after optimization using CCD in a bioprocess that was economic too.
References
- 1.P K Gupta, Sahai A, Singh N, C K Dixit, D P Singh. (2004) Residue burning in rice-wheat cropping system: causes and implications. , Curr. Sci 87(12), 1713-1717.
- 2.Kaur D, N K Bhardwaj, R K Lohchab. (2017) Prospects of rice straw as a raw material for paper making. , Waste Manag 60, 127-139.
- 3.Kaur P, N K Bhardwaj, Sharma J. (2016) Application of microbial enzymes in production of dissolving grade pulp. In: Frontier discoveries and innovations in interdisciplinary microbiology.Springer. 133-156.
- 5.Vitolo M. (2009) Industrial uses of enzymes. In:. Doelle HW and Rokem S (eds) Biotechnology VI, Eolss; 6, 135-138.
- 6.Nizamudeen S, B K. (2009) A novel thermo-alkali tolerant endoglucanase production using cost effective agricultural residues substrates by a newly isolatedBacillussp. , NZ. Food Technol. Biotechnol 47(4), 435-440.
- 7.Sadhu S, T K Maiti. (2013) Cellulase production by bacteria: A review. , British Microbiol. Res. J 3(3), 235-258.
- 8.Sukumaran R K, Singhania R R, Pandey A. (2005) Microbial cellulases- Production, applications and challenges. , J. Sci. Ind. Res 64, 832-844.
- 9.Bajaj B K, Pangotra H, Vani M A, Sharma P, Sharma A. (2009) Partial purification and characterization of highly thermostable and pH stable endoglucanase from a newly isolatedBacillusstrain M-9. , Indian J. Chem. Technol 16, 382-387.
- 10.Deka D, S P Das, Sahoo N, Das D, Jawed M et al. (2013) Enhanced cellulase production fromBacillus subtilisby optimizing physical parameters for bioethanol production.Doi: 10.5402/2013/965310. , ISRN Biotechnol
- 11.Garg G, Mahajan R, Kaur A, Sharma J. (2011) Xylanase production using agro-residue in solid state fermentation fromBacilluspumilusASH for biodelignification of wheat straw pulp. , Biodegradation 22, 1143-1154.
- 12.Kaur P, N K Bhardwaj, Sharma J. (2016) Process optimization for hyper production of xylanase via statistical methodology from isolatedBacilluspumilus3GAH using lignocellulosic waste. , Biocatal. Agri. Biotechnol 6, 159-167.
- 13.Nagar S, V K Gupta, Kumar D, Kumar L, R C Kuhad. (2009) Production and optimization of cellulase-free, alkali-stable xylanase byBacilluspumilusSV-85S in submerged fermentation. , J. Ind. Microbiol.Biotechnol 37(1), 71-83.
- 14.Nagar S, Garg N, Sanghi A, R C Kuhad, Gupta K. (2010) Enhancement of xylanase production byBacillus subtilisASH in submerged fermentation using response surface methodology. , International Journal of Microbes and Environmental Management 1(1), 1-9.
- 15.Singh S, V S Moholkar, Goyal A. (2014) Optimization of carboxy methyl cellulase production fromBacillusamyloliquefaciensSS35. 3. , Biotech 4, 411-424.
- 16.Vasudeo Z, Lew C. (2011) Optimization of culture conditions for production of cellulase by athermophilic Bacillusstrain. , J. Chem. Chem. Eng 5, 521-527.
- 17.Biswas R. (2014) Production of cellullolytic enzymes. In: Bioprocessing of renewable resources to commodity bioproducts. , JohnWiley&Sons,Inc 105-130.