Validated Analytical Spectrofluorimetric Method for Quantitation of Diphenhydramine HCl in Commercial Dosage Forms
Abstract
Diphenhydramine HClis a weakly fluorescent drug having tertiary amine group forming ion pair complex with eosin Y in dichloromethane at pH 5 in disodium hydrogen phosphate-citric acid buffer solution. The complex formation was the basis for the development of new analytical method for determination of active diphenhydramine in pharmaceutical formulations. The stoichiometric ratio between diphenhydramine and eosin Y was studied by mole ratio method and found to be 2:1. The ion-pair complex showed maximum fluorescence emission intensity at 554 nm with excitation at 259 nm. The linear dynamic range was obtained in the concentration range of 2-22 µg mL-1 with a linear equation of FI = 0.361 + 13.675 C. The apparent Gibb’s free energy (ΔGº) was calculated and found to be -80.783 KJ mol-1, confirmed the feasibility of the reaction. The proposed method was successfully applied to the determination of diphenhydramine HCl in pharmaceutical formulations and in good agreement with the reference method.
Article Information
- Received
- Accepted
- Published
Academic Editor: Zhe-Sheng Chenz, Professor, Department of Pharmaceutical Sciences, College of Pharmacy and Allied Health Professions, St. John’s University, United States.
Checked for plagiarism: Yes
Review by: Single-blind
Copyright © 2018 Syed Najmul Hejaz Azmi , et al.
 This is an open-access article distributed under the terms of the Creative Commons Attribution License, which permits unrestricted use, distribution, and reproduction in any medium, provided the original author and source are credited.
Corresponding author: Syed Najmul Hejaz Azmi, Department of Applied Sciences, Chemistry Section, Higher College of Technology, P. O. Box 74, Al-Khuwair-133, Muscat, Sultanate of Oman —
Competing Interests
The authors have declared that no competing interests exist.
Funding
No specific funding statement was provided by the authors.
Data Availability
No data-availability statement was provided by the authors.
Acknowledgements
The authors are grateful to Heads of Applied Sciences and Chemistry Section, Higher College of Technology, Muscat, Oman for providing research facilities. The authors are thankful to the higher-up of the Ministry of ManPower (Higher College of Technology) Muscat, Sultanate of Oman for facilities. The authors wish to express their gratitude to M/s National Pharmaceutical Industries Company, Oman for providing the gift sample of pure diphenhydramine HCl.
Citation:
Introduction
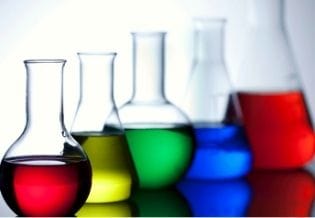
Diphenhydramine hydrochloride is chemically known as 2-(Diphenylmethoxy)-N,N-dimethylethylamine hydrochloride (CAS: 147-24-0; M.W.: 291.82). Figure 1 represents 3d structure of diphenhydramine. It belongs to the class of antihistamine, competitively blocks the effects of histamine at H1-receptor sites, and has atropine-like, antipruritic and sedative effects 1. It is approved to treat the symptoms of motion sickness, sneezing, running nose, watery eyes, hives, skin rash, itching and other cold or allergy symptoms. The usual recommended dose of the active drug for patients is 25-50 mg for every 4-6 hr, not to exceed 300 mg per 24 hr. The assay of diphenhydramine hydrochloride is described in British Pharmacopoeia 2, United States Pharmacopeia 3 and Indian Pharmacopoeia 4 based on potentiometric titration, high performance liquid chromatographic method and volumetric titration, respectively. Here, the developed method is simple and more convenient based on spectrofluorimetric method. The drug is important and hence the safety, quality, quantity and purity of drug are on high demand 5. In view of the great importance of the drug in terms of its optimum oral dose and wide use, it is important to analyze the drug in pharmaceutical preparations. With increasing regulatory strictness and owing to the reason of quality control, various analytical methods have been developed in pure and dosage forms including titrimetry 6, high performance thin layer chromatography 7, capillary electrophoresis 8, gas chromatography 9, high performance liquid chromatography 10, electrochemical analysis 11, 12 and spectrophotometry 13. Analytical methods based on fluorescence spectroscopy are methods of good choice because of high degree of selectivity, sensitivity and wide linear dynamic range. Eosin Y is a most widely used reagent in drug analysis because of fluorescent in nature 13, 14, 15, 16, 17. Eosin Y is a xanthene polyprotic acid dye which can be dianionic in nature having pKa of 2 and 3.8 in water 18. In this research, eosin Y acted as a fluorescent probe and formed fluorescent ion-pair complex with diphenhydramine in the presence of disodium hydrogen phosphate-citric acid buffer solution of pH 5.0. The complex was extracted in dichloromethane provided fluorescence emission intensity at 554 nm after excitation at 259 nm. As per literature survey and gathered information, there is no spectrofluorimetric method based on the extraction of complex in dichloromethane for quantitation of diphenhydramine. Extraction in dichloromethane improved sensitivity and selectivity of the method. The reactions conditions helping the formation of ion-pair complex between eosin Y and diphenhydramine are optimized and validated as per International Conference on Harmonisation guidelines (USA) 19.
Figure 1. 3D structure of diphenhydramine.
Download figure
Experimental
Reagents and Materials
Fluorescence spectra and all measurements were done on Agilent’s Cary Eclipse FluorescenceSpectrophotometer (Thermo Scientific, Australia) equipped with a xenon 150 W arc lamp and 1-cm quartz cells. Excitation and emission wavelengths were set with slit widths of 10 nm.
Hanna pH meter (USA) was used for pH measurements. IR spectra were recorded on IR Affinity-1 spectrophotometer (Shimadzu, Kyoto, Japan) in the range of 4000-400 cm-1 using KBr pellet technique.
All reagents and solvents were AR grade. 0.02% eosin Y disodium salt (CAS: 17372-87-1, M.W.: 691.85, Fluka Chemie AG, Switzerland) solution was freshly prepared in distilled water. McIlvaine Na2HPO4-citric acid buffer solutions of different pH ranging from 2.2-6.6 were prepared 20 and investigated for ion-pair complex formation. The pH of the solution was monitored using Hanna pH meter. All experiments were performed at a temperature of 25±1 ̊C and pressure of 760mm Hg.
Pure diphenhydramine hydrochloride reference drug was gifted by National Pharmaceutical Industries Company, Oman. 0.02% of pure diphenhydramine hydrochloride solution was tested for linear dynamic range and other validation parameters.
Marketed products of diphenhydramine hydrochloride such as Stopkof syrup 100 mL (National Pharmaceutical Industries Company, Oman), Histalix syrup 150 mL (Wallace manufacturing chemists Ltd, UK) and Amydramine syrup 120 mL (Julphar, UAE) were investigated for active diphenhydramine HCl in the presence of pharmaceutical excipients.
Procedure for the Determination of Diphenhydramine Hydrochloride by Proposed Method
Into a series of 10 mL volumetric flasks, varying aliquots (0.1-1.1 mL) of 0.02% diphenhydramine hydrochloride equivalent to 2-22 µg mL-1 were pipetted with 1.4 mL of 0.02% eosin Y and 2.0 mL of Na2HPO4-citric acid buffer of pH 5. The contents of the flask were diluted with distilled water at 25±1 ̊C and transferred into the separating funnel with 10 mL dichloromethane. The solution was shaken and mixed for 2 min for the separation of organic layer. The layer was separated and treated with anhydrous sodium sulphate to remove any traces of water. The fluorescence emission intensity of the associated ion pair complex in organic layer was recorded at 554 nm after excitation at 259 nm and the linear regression equation was developed for the estimation of active diphenhydramine in pharmaceutical formulations.
Procedure for the Determination of Diphenhydramine Hydrochloride by Reference Method 21
Into a series of 10 mL standard volumetric flask, different volumes (0.05, 0.1, 0.15, 0.2, and 0.25 mL) of 0.02% pure diphenhydramine HCl were taken and diluted up to the mark with distilled water at 25±1 ̊C. The fluorescence emission intensity at 286 nm was recorded after keeping excitation wavelength fixed at 207 nm against distilled water as a blank solution. The calibration graph was constructed by plotting fluorescence emission intensity versus the concentration of diphenhydramine HCl in μg mL-1. Alternatively, the linear regression equation was generated for finding out the concentration of active diphenhydramine HCl in pharmaceutical preparations.
Procedure for the Determination of Diphenhydramine Hydrochloride in Pharmaceutical Formulations by Proposed and Reference Methods
3 commercially available bottled syrups i.e. Stopkof, Histalix and Amydramine were shaked and poured each into a 50 mL beaker. 7.4, 7.2 and 7.4 mL of the respective syrups equivalent to 20 mg active diphenhydramine HCl were transferred into a 100 mL volumetric flask and diluted up to the mark with distilled water. The recommended procedures were then followed for determination of active diphenhydramine HCl in commercial dosage forms.
Results and Discussion
In the literature, it was reported that chlorpheniramine 14, doxepin HCl 15, citalopram HBr 16 and imipramine 17 possessed tertiary amine group. 2 protons of carboxylic and phenolic groups of eosin Y were ionized forming dianionic eosin Y which exhibited λemission of 544.02 nm when excited at 257.96 nm 18. The most important point is that there was no extraction of dianionic eosin Y in chloroform/dichloromethane in the presence of acidic buffer solution alone. 2 mole of protonated drugs (cation) binded with dianionic eosin Y, thus formed drug-eosin Y ion-pair complex, extractable in chloroform/dichloromethane. Here in Na2HPO4-citric acid buffer of pH 5, eosin Y ionized 2 protons which was protonated to 2 diphenhydramine molecules through nitrogen as basic centre. Finally, dianionic eosin Y binded with protonated diphenhydramine and formed fluorescent ion pair complex with λemission of 554 nm when excited at 259 nm. At the same time, dianionic eosin Y with acidic buffer solution (in the absence of diphenhydramine) was not extracted in dichloromethane. The aqueous solution of diphenhydramine showed an emission wavelength of 286 nm when excited at 207 nm. The spectrofluorimetric spectra of aqueous diphenhydramine and ion-pair complex were given in Figure 2.
Figure 2. (a) Excitation and emission spectra of diphenhydramine HCl (0.4 mL of 0.01% diphenhydramine HCl in 10 mL distilled) and (b) Excitation and emission spectra of fluorescent ion pair complex (1.5 mL of 0.02% diphenhydramine + 1.3 mL of 0.02% eosin Y + 2.0 mL of buffer solution of pH 5, extracted in 10 mL dichloromethane).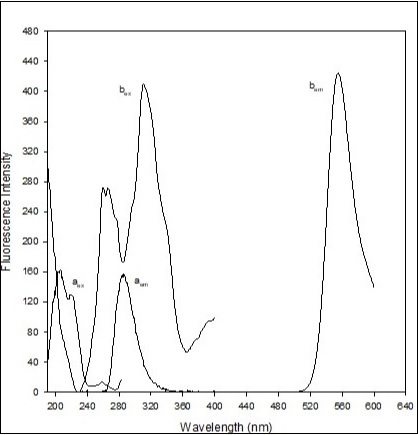
Download figure
The molar combining ratio between diphenhydramine HCl and eosin Y was investigated by mole ratio method 22. In the acidic condition, 1 mole of eosin Y (5.0 ×10⁻⁴ M) was combined with 2 moles of diphenhydramine (5.0 ×10⁻⁴ M) provided ion-pair complex. The fluorescence emission intensity of the complex was recorded at 554 nm after excitation at 259 nm and plotted against the mole ratio of drug to Eosin Y. constant (Kf) of the complex was calculated using the following expression:
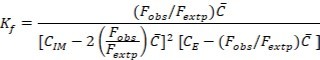
Eq.1
Where Fobs. and Fextp. are observed and extrapolated fluorescence emission intensities of the complex. CIM, CE and are initial concentration of imipramine, eosin Y and limiting concentration (=CE) in mol L-1, respectively. The Kf of the complex was found to be 1.437×10¹⁴. The apparent Gibbs free energy (ΔGº) was calculated using ΔGº = -2.303 RT log Kf and found to be -80.783 KJ mol-1, confirming the feasibility of the reaction.
Figure 3 showed the IR spectra of (a) free diphenhydramine (b) Eosin Y and (c) diphenhydramine-eosin Y complex. The FTIR spectra of free diphenhydramine exhibited peaks at 3032.10 and 2893.22 cm-1 for C-H stretching vibrations 23, 24. Other FTIR peaks of free diphenhydramine exhibited at 713.66, 756.10, 991.41, 1018.41, 1103.28 and 1180.44 cm-1. Eosin exhibited most important band at 3398 cm-1 for O-H stretching vibration and 1604 and 1554 cm-1 for C=O stretching vibrations. On comparing IR spectra, it was noticed that in diphenhydramine-eosin complex the peak at 3398 cm-1 (which was in Eosin Y) was disappeared and showed decrease in the intensity over 2449.60-2565.33 cm-1 24, 25 due to overlap of γ-NH+ of the diphenhydramine and γ -C=O of eosin Y. The reaction sequence is shown in Figure 4.
Figure 3. Infrared spectra of (a) pure diphenhydramine (b) free eosin Y and (c) diphenhydramine-eosin Y complex in KBr (2 mg sample/200 mg KBr).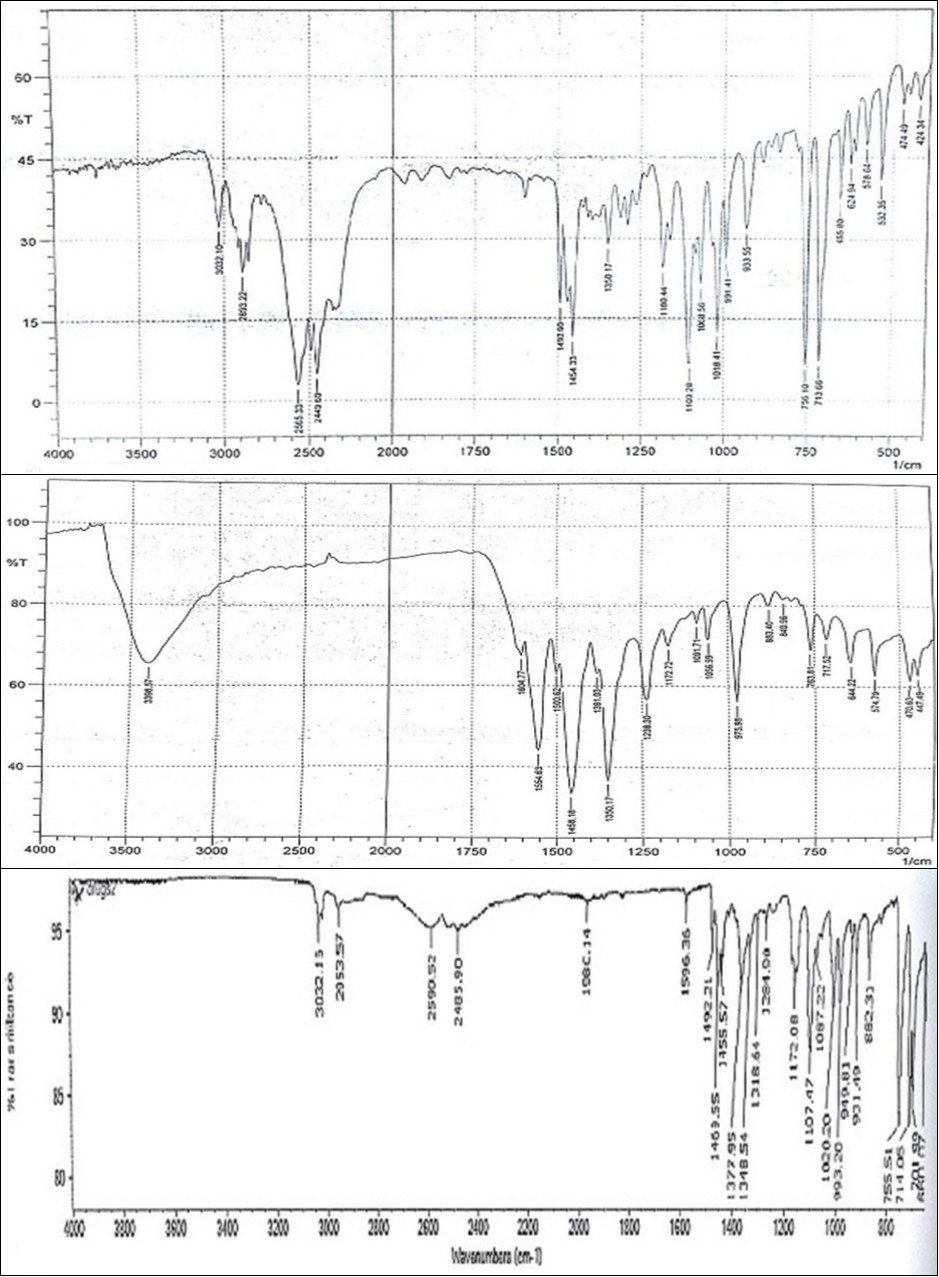
Download figure
Figure 4. Reaction sequence of diphenhydramine-eosin Y ion pair complex.
Download figure
Method Optimization
The experimental variables such as reaction time, concentration of eosin Y, buffer solutions of different pH, solvents and shaking time for extraction of complex were optimized for proposed spectrofluorimetric method.
The effect of the reaction time on the fluorescence emission intensity of ion-pair complex was studied from 1 to 70 min and found to be stable for 1 h at 25 ± 1˚C.
The influence of the volumes of 2.89×10⁻⁴ M eosin Y was studied at 20.0 μg mL-1 diphenhydramine hydrochloride on the fluorescence emission intensity of ion pair complex. The maximum fluorescence emission intensity was achieved at 1.0 mL of 2.89×10⁻⁴ M eosin Y and above this volume up to 1.6 mL, the fluorescence emission intensity remained constant. 1.3 mL of 2.89×10⁻⁴ M eosin Y was used as optimum volume for the determination of diphenhydramine hydrochloride.
The influence of pH on the fluorescence emission intensity of diphenhydramine-eosin Y complex was investigated using 2.0 mL of Na2HPO4-citric acid buffer solution of different pH in the range of 3.0-6.6 with 20.0 μg mL-1 diphenhydramine and 1.3 mL of 2.89×10⁻⁴ M eosin Y. The fluorescence emission intensity was recorded for each determination and the maximum fluorescence intensity of ion-pair complex was achieved at pH 4.2 and constant up to pH 5.8. Above pH 5.8, the fluorescence emission intensity decreased. Therefore, 2.0 mL of Na2HPO4-citric acid buffer solution of pH 5.0 was selected as the optimum pH for determination of diphenhydramine hydrochloride.
The effect of the shaking time for the extraction of the ion pair complex was tested in the range of 0.5-3.0 min. The maximum fluorescence emission intensity of the complex was obtained at 1.5 min. After this time, the intensity remained constant up to 2.5 min. Therefore, the shaking time of 2.0 min was adequate for the extraction of ion-pair complex into dichloromethane.
The fluorescence emission intensity of the ion-pair complex was recorded in different solvents of benzene, hexane, chloroform, carbon tetrachloride, dichloromethane, dichloroethane, and ethyl acetate and found to be maximum in dichloromethane. There was no fluorescence emission intensity recoded in benzene and hexane. The fluorescence emission intensity in the blank solution was also recorded and found to be negligible in the solvent. Therefore, dichloromethane was selected as the best solvent for extraction of the complex.
Validation
For the proposed method, a series of nine different concentrations of diphenhydramine were prepared and the fluorescence emission intensity of the complex was recorded at emission wavelength of 554 nm. The calibration graph was constructed by plotting fluorescence emission intensity against initial concentration of diphenhydramine in µg mL-1. The linear relationship between the measured fluorescence emission intensity and initial concentration of diphenhydramine HCl was found to be in the concentration range 2-22 µg mL-1. The calibration data were utilized to get slope, intercept, coefficient of correlation, detection limit and quantitation limit, standard deviation of intercept and slope, variance, standard deviation of the calibration line of proposed and reference methods using OriginPro 6.1 software. The results are summarized in Table 1. The linearity of the regression line was excellent. This fact was explored due to the high value of correlation coefficient (0.9999). The significance of intercept was studied by calculating t-value using the following equation 26:
t=a/Sa Eq. 2
Table 1. Optical and analytical characteristics of the proposed and reference methods| Parameters | Proposed method | Reference method 21 |
| Absorption wavelength (nm) | 259 | 285 |
| Maximum emission wavelength (nm) | 554 | 207 |
| Linear dynamic range (µg mL-1) | 2-22 | 1-5 |
| Linear regression equation | FI = 0.361 + 13.675 C | FI = 0.410 + 39.155 C |
| Standard deviation of intercept, Sa | 0.329 | 0.384 |
| Confidence limit of the intercept | 0.778 | 1.222 |
| Standard deviation of slope, Sb | 0.022 | 0.116 |
| Confidence limit of the slope | 0.052 | 0.369 |
| Correlation coefficient (r) | 0.999 | 0.999 |
| Standard deviation of calibration line (So) | 0.426 | 0.367 |
| Variance (So2) | 0.181 | 0.135 |
| Limit of detection, LOD (µg mL-1) | 0.103 | 0.031 |
| Limit of quantification, LOQ (µg mL-1) | 0.310 | 0.094 |
The value of t was found to be 1.095 which is less than the tabulated t-value (2.365, =7) at 95% confidence level 27. Therefore, it is concluded that a significant relationship between the experimental fluorescence emission intensity and concentration existed and the proposed method was error free. Limits of detection (LOD) and quantitation (LOQ) were calculated according to the International conference on Harmonization guidelines. The low value of LOD (0.103 µg mL-1) indicated good sensitivity of the proposed method.
The precision of the proposed method was evaluated in terms of intra-day and inter-day precisions. The intra-day precision was tested using test samples for five times per day at 3 concentration levels i.e. 4, 12 and 20 µg mL-1. Inter-day precision was evaluated by investigating the test samples for five times once daily for five consecutive days. The results are summarized in Table 2. The RSD values were in the ranges of 0.07-0.82 % for intraday and inter day precisions. The low % RSD values at different concentrations showed that the proposed method is precise and can be used to analyze diphenhydramine HCl in pharmaceutical preparations.
Table 2. Intra and Inter day precisions of the proposed method| Actual concentration(mg mL-1) | Intra day assay:Found concentration ± SD(μg mL-1); RSD (%)a | Inter day assay:Found concentration ± SD(μg mL-1); RSD (%)a |
| 4.0 | 3.979± 0.010; 0.28 | 4.026 ±0.033; 0.82 |
| 12.0 | 11.974±0.022; 0.19 | 12.004 ± 0.068; 0.57 |
| 20.0 | 20.014±0.013; 0.07 | 20.002 ± 0.048; 0.24 |
The statistics was applied to establish the confidence limit 28 at 95% confidence level and n-2 degrees of freedom for the quantitation of unknown concentration of diphenhydramine using the following formula:
Where and are average concentration (diphenhydramine) and fluorescence emission intensity values, respectively, for n standard solutions. Figure 5 provided % uncertainty plot in concentration (ΔC/Ci×100) at 95% confidence level versus initial concentration of diphenhydramine. Thus, the relative uncertainty can be estimated directly on the concentration level tested.
Figure 5. % uncertainty plot in concentration at 95% confidence level.
Download figure
In order to assure the applicability of the proposed method, a systematic quantitative study was performed in order to find out the tolerated amount of common excipients (ammonium chloride, sodium citrate, glucose, fructose, lactose, sodium benzoate, starch, povidone, methyl cellulose and micro crystalline cellulose) in drug formulations. The tolerated amount of excipients at 20 mg mL-1 diphenhydramine HCl was calculated using the following expression:
Mass/Volume(mg/L)=C×MW×1000 Eq.4
where C and MW are concentration and molecular weight of excipients, respectively.
The results are summarized in Table 3. It is evident from the table that the proposed method tolerated larger amount of excipients hence indicated that the proposed method was more specific and selective. Therefore, the proposed method is suitable to determine active diphenhydramine in pharmaceutical preparations.
Table 3. Specificity and selectivity of the proposed method: Tolerated amount of excipients at 20 µg mL-1 diphenhydramine| Excipients | Tolerance amount (mg mL -1) |
| Glucose | 5.504 |
| Fructose | 5.504 |
| Sodium benzoate | 1.502 |
| NH4Cl | 1.002 |
| Sodium citrate | 1.502 |
| Lactose | 9.557 |
| Starch | 0. 152 |
| Povidone | 0. 152 |
The accuracy of the proposed method was investigated by standard addition technique. In this method, the known amount of pure diphenhydramine was spiked with constant amount of Stopkof syrup solution and the fluorescence emission intensity of the complex was recorded. Standard addition plot was constructed using fluorescence emission intensity at y-axis and initial concentration of drug at x-axis (Figure 6). The regression line was generated with intercept of 137.33 and slope of 13.61, respectively. The amount of diphenhydramine in syrup solution was estimated and found to be 10.09 µg mL-1. The amount of drug in syrup solution is subjected to standard deviation, SxE, and can be calculated by the following expression 28:
 Eq.5
Eq.5
Figure 6. Standard addition plot: 0.5 mL of 0.02% diphenhydramine Stopkof syrup solution was spiked with 0, 0.05, 0.1, 0.15 and 0.2 mL standard solution of 0.02% pure diphenhydramine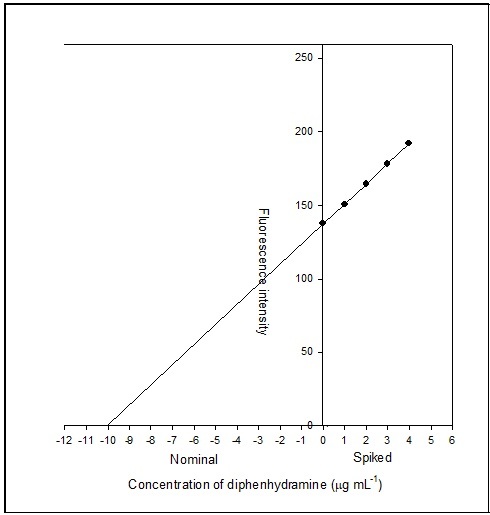
Download figure
The value of SxE was found to be 0.04 µg mL-1. The confidence limit for the concentration of diphenhydramine in syrup was calculated using xE ± tSxE at n - 2 degrees of freedom and found to be 10.09 ± 0.14 µg mL-1.
The applicability of the proposed method for the determination of active diphenhydramine in Stopkof, Histalix and Amydramine has been tested. The results of the proposed method were statistically compared with those of the reference method using point and interval hypothesis tests. t- and F-values at 95% confidence level were calculated using point hypothesis test. The results are summarized in Table 4. It is clear from the table that the calculated t- and F values are less than the theoretical ones at 95% confidence level, indicated no significant difference between the methods compared.
Table 4. Point and interval hypothesis tests for the determination of diphenhydramine in pharmaceutical preparations at 95% confidence level.Interval hypothesis test was also utilized to calculate bias within the acceptable range of ±2% 29 using the following quadratic equation.
 Eq. 6
Eq. 6
Lower limit (θL) and upper limit (θU) were calculated and found to be in the range of 0.98-1.02 indicating the compliance of regulatory guidelines 30.
Conclusions
The proposed method based on spectrofluorimery is very useful because many of the excipients are non-fluorescent in nature. The method was successfully applied for the determination of active diphenhydramine in stopkof, histalix and amydramine in the presence of excipients. The proposed method is easy to operate, utilizing less analysis time and economical with commonly available solvent. The proposed method can be utilized as an alternate method for routine quality control analysis of active diphenhydramine in research laboratories, hospitals and pharmaceutical industries.
References
- 3. (2007) Indian Pharmacopoeia Drug substances, dosage forms and pharmaceutical aids. , Government of India, Ministry of Health & Family Welfare, Published by Indian Pharmacopoeia Commission, Ghaziabad 427-428.
- 4.United States Pharmacopoeia (2012) . United States Pharmacopoeial Convention Inc. (USP35), Rockville MD 2931-2932.
- 5.Rahman N, Azmi S N H, H F Wu. (2006) The importance of impurity analysis in pharmaceutical products: an integrated approach. , Accred. Qual. Assur 11, 69-74.
- 6.Basavaiah K, Charan I L V S. (2002) Titrimetric and spectrophotometric assay of some antihistamines through the determination of the chloride of their hydrochlorides. , Farmaco 57, 9.
- 7.Ahrens B, Blankenhorn D, Spangenberg B. (2002) Advanced fibre optical scanning in thin-layer chromatography for drug identification. , J. Chromatogr 772, 11.
- 8.Dong Y, Chen X, Chen Y, Hu Z. (2005) Separation and determination of Pseudoephedrine, dextromethorphan, diphenhydramine and chlorpheniramine in cold medicines by nonaqueous capillary electrophoresis. , J. Pharm. Biomed. Anal 39, 285.
- 9.S V Raj, S U Kapadia.Argekat A P (1998)Simultaneous determination of pseudoephedrine hydrochloride and diphenhydramine hydrochloride in cough syrup by gas chromatography. , Talanta 46, 221.
- 10.Barbas C, Garcıa A, Saavedra L, Castro M. (2000) Optimization and validation of a method for the determination of caffeine, 8-chlorotheophylline and diphenhydramine by isocratic high-performance liquid chromatography stress test for stability evaluation. , J Chromatogr A 870, 97-103.
- 11.Daneshgar P, Norouzi P, Ganja M, Dousty F. (2009) A dysprosium nanowire modified carbon paste electrode for determination of nanomolar level of diphenhydramine by continuous square wave voltammetry in flow injection system. , J. Int. Electrochem. Sci 4, 444.
- 12.Norouzi P, M R Ganjali, Nouryousefi E, Shahtaheri S J, Dinarvand R. (2010) Trace detection of diphenhydramine by adsorption on a microelectrode at flow injection system by fast fourier transform continuous cyclic voltammetry. , Croat. Chim. Acta 83, 135-142.
- 13.Didamony A M El, Moustafa M A. (2010) Spectrophotometric determination of diphenhydramine hydrochloride in pharmaceutical preparations and biological fluids via ion-pair formation. , Arab. J. Chem 3, 265-270.
- 14.Azmi S N H, Al-Hadhrami S S K, Al-Marhoubi B M R, Al-Sulaimi S S S, Al-Shamoosi Z D S. (2017) Development and validation of fluorescence spectrophotometric method: Quantitation of chlorpheniramine maleate in pharmaceutical formulations. , J. Mol. Liq 243, 750-760.
- 15.Rahman N, Siddiqui S, Azmi S N H. (2009) Spectrofluorimetric method for the determination of doxepin hydrochloride in commercial dosage forms, AAPS PharmSci Tech. 10, 1381-1387.
- 16.Azmi S N H, Al-Fazari A, Al Badaei M, Mahrezi R. (2015) Utility of eosin Y as a complexing reagent for the determination of citalopram hydrobromide in commercial dosage forms by fluorescence spectrophotometry. , Luminescence 8, 1352-1359.
- 17.Azmi S N H, M K Al-Hattali, R K Al-Hinai, I M Al-Ajmi. (2017) A new spectrofluorimetric approach for the quantitation of imipramine HCl in commercial dosage forms. , Journal of Advanced Pharmaceutical Science and Technology 1, 29-47.
- 18.Majek M, Filace F, A Jacobi von Wangelin. (2014) On the mechanism of photocatalytic reactions with eosin Y. , Beilstein J. Org. Chem 10, 981-989.
- 19. (1995) . International Conference on Harmonisation ICH Harmonised Tripartite Guideline- Text on Validation of Analytical Procedures. Fed. Regist 60, 11260.
- 20.Britton H T S. (1942) Solutions of known hydrogen ion concentration. In: Hydrogen ions,Ed.Tripp EH,Volume I.Chapman and Hall Ltd. , London; 304.
- 21.I P Reguera, M G Rubio, A M Diaz. (2004) Native fluorescence flow-through optosensor for the fast determination of diphenhydramine in pharmaceuticals. , Anal.Sci 20, 799.
- 22.Likussar W, D F Boltz. (1971) Spectrophotometric determination of extraction constants for certain metal 1-pyrrolidinecarbodithioates. , Anal. Chem 43, 1265.
- 24.Badei M M A. (1993) Spectrophotometric determination of diphenhydramine hydrochloride using carmoisine by solvent extraction. , J. Chem. Soc. Pak 15, 39.
- 25.R J Warren, W E Thompson, J E Zarembo. (1965) Effect of water of hydration on the infrared spectra of teriary amine salts. , J. Pharm. Sci 54, 1554.
- 26.Nalimov. (1963) The Application of Mathematical Statistics to Chemical Analysis,PergamonPress,Oxford. 167.
- 27.Mendham J, R C Denney, J D Barnes, Thomas M. (2002) Statistics: Introduction to Chemometrics. In: Vogel’s Textbook of Quantitative Chemical Analysis, 6th edition. Pearson Education. , Singapore 137.
- 28.J C Miller, J N Miller. (1993) Errors in instrumental analysis; regression and correlation In: Statistics for analytical chemistry, Third edition, Ellis Horwood and Prentice Hall. , England 119.
Cited by (3)
This article has been cited by 3 scholarly works according to:
Citing Articles:
Luminescence (2021) Crossref OpenAlex
Sherin F Hammad, Basma Z El-Khateeb, Samah F. El-Malla - Luminescence (Chichester, England Print) (2020) Semantic Scholar
Journal of new developments in Chemistry (2018) OpenAlex