
Irrigation Farming Adoption and Livelihood Outcomes among Smallholder Farmers in Uganda. A Cross-sectional Analysis
Abstract
Introduction
Agriculture is the backbone of Uganda’s rural economy, with smallholder farmers forming the majority of the farming population. Despite irrigation farming being recognized as a pathway to improved productivity and livelihood resilience, empirical studies on its adoption and outcomes in Uganda remain scanty. This limited evidence informed this cross-sectional analysis to evaluate how irrigation farming adoption influences smallholder farmers’ livelihoods in Uganda.
Methods
This study used a cross-sectional design to assess the link between irrigation adoption and livelihood outcomes among smallholder farmers in Uganda. From a target of 422 respondents, 387 participated (91.7% response rate). Districts, sub-counties, and farmers were purposively selected, with proportional representation to ensure balance. Data were analyzed using SPSS and STATA 18, applying descriptive statistics, Chi-square tests, regression, and logistic models. Assumptions of linearity and multicollinearity were checked, while Poisson regression and mixed models enhanced robustness.
Results
Adoption of modern irrigation technologies was generally low, with overall mean scores below 2.0 for drip, sprinkler, pump, hose pipe, and solar-powered systems, while small-scale manual methods showed moderate uptake (mean = 2.695, SD = 1.498). In contrast, livelihood outcomes were consistently high: agricultural productivity (mean = 3.802, SD = 0.688) reflected strong yields and profitability but moderate climate adaptation (mean = 2.907, SD = 1.241); income growth was notable (mean = 3.672, SD = 0.894); food security and social services were very high (means above 4.2), with clean water access scoring highest (mean = 4.455, SD = 0.529); and asset growth was positive (mean = 3.760, SD = 0.795). Overall livelihood outcomes averaged 3.963 (SD = 0.577). Correlation analysis showed a weak but significant positive relationship between irrigation adoption and livelihoods (r = 0.208, p = 0.000), while regression confirmed irrigation adoption significantly improved outcomes (β = 0.134, p = 0.000), explaining 4.1% of the variation.
Article Information
- Received
- Accepted
- Published
Academic Editor: Anubha Bajaj, Consultant Histopathologist, A.B. Diagnostics, Delhi, India.
Checked for plagiarism: Yes
Review by: Single-blind
Copyright © 2026 Vivien Akullo, et al.
 This is an open-access article distributed under the terms of the Creative Commons Attribution License, which permits unrestricted use, distribution, and reproduction in any medium, provided the original author and source are credited.
Corresponding author: Vivien Akullo, Nkumba University, Entebbe Road, P.O Box 237, Entebbe, Uganda —
Competing Interests
The authors do not have any competing interests.
Funding
This study obtained funding from RUFORUM-Makerere under reference number RU/2024/GTA/CCNY/46.
Data Availability
No data-availability statement was provided by the authors.
Acknowledgements
We acknowledge the support of our institutions and colleagues who guided the study. We also appreciate the contributions of the communities and participants who made this research possible.
Citation:
Introduction
Agriculture remains the backbone of rural livelihoods across sub-Saharan Africa, where smallholder farmers constitute the majority of the farming population. A substantial body of research has examined the complex and multifaceted relationship between irrigation technologies and smallholder farmers’ livelihoods, highlighting how different irrigation methods influence agricultural productivity, resource efficiency, and income generation. Globally, irrigation farming has been recognized as a critical driver of agricultural intensification, enabling farmers to overcome rainfall variability, increase crop yields, and enhance household welfare 1.
Studies across diverse contexts demonstrate that irrigation adoption significantly improves productivity and resilience. For instance, Tesfaye et al. (2021) and Mohammed & Shallo (2020) show that motorized pumps enhance efficiency and household income in Ethiopia, while Serote et al. (2021) emphasize the role of climate-smart irrigation technologies such as drip and sprinkler systems in optimizing water use and mitigating climate variability. Similarly, Agula et al. (2018) highlight ecosystem-friendly irrigation practices in Ghana as pathways to both productivity gains and environmental sustainability. Evidence from Zeweld et al. (2015) and Assefa et al. (2022) further underscores the positive effects of small-scale irrigation on income, food security, and asset accumulation, while recent studies by Rana et al. (2021) and Birhanu et al. (2023) demonstrate the livelihood benefits of solar-powered irrigation systems in sub-Saharan Africa.
While these findings collectively affirm the transformative potential of irrigation farming, most evidence is concentrated in Ethiopia, Ghana, and other parts of sub-Saharan Africa, with limited empirical focus on Uganda. Yet Uganda’s smallholder farmers, particularly in the Teso Sub-Region, face persistent challenges of rainfall variability, low productivity, and livelihood vulnerability. Irrigation adoption in this context remains relatively underexplored, despite its potential to improve agricultural outcomes and strengthen household resilience. Addressing this gap is critical for informing policy and practice aimed at enhancing sustainable livelihoods. This study therefore investigated irrigation farming adoption and its effects on livelihood outcomes among smallholder farmers in Uganda, employing a cross-sectional design.
Conceptual Framework
Figure 1 Conceptual framework illustrating the relationship between irrigation farming adoption and livelihood outcomes among smallholder farmers in Uganda. Irrigation farming adoption is hypothesized to be associated with improved livelihood outcomes, while socioeconomic and institutional factors may influence both adoption decisions and livelihood status.
Figure 1. Conceptual Framework of the Study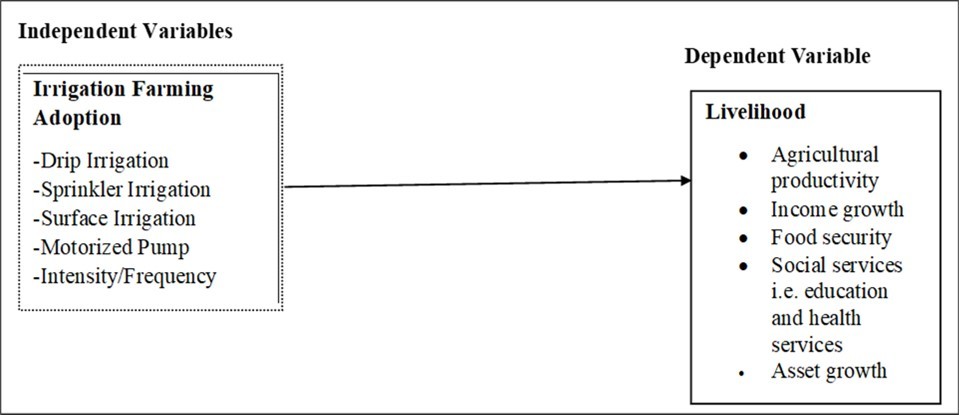
Download figure
Methodology
Study Design and Sampling
This study employed a cross-sectional design to investigate the relationship between irrigation farming adoption and livelihood outcomes among smallholder farmers in Uganda. The sample size of 422 respondents was determined using the Krejcie and Morgan (1970) formula, ensuring statistical adequacy for generalization. A 100 percent response rate was obtained, strengthening the reliability of the findings.
A non-probability sampling technique was applied, with purposive selection of districts, sub-counties, and farmers based on the extent of irrigation farming adoption. District Agricultural Officers (DAOs), extension workers, and farmer association representatives assisted in identifying households actively engaged in irrigation farming. To ensure proportional representation, the proportion-to-size method was used, giving districts with larger farming populations higher inclusion probability.
Data Analysis
Quantitative data were processed using SPSS and STATA 18. Descriptive statistics (means, frequencies, percentages) summarized demographic characteristics and irrigation adoption patterns. Pearson’s Chi-square test assessed associations between irrigation adoption and livelihood outcomes such as income, food security, and asset ownership. At the bivariate level, regression analysis were conducted to identify significant strength of association between irrigation adoption and livelihood outcomes. Multiple logistic regression was employed to evaluate the effect of irrigation farming adoption on household welfare indicators.
Statistical Assumptions
Linearity was tested using Pearson correlation coefficients, while multicollinearity diagnostics ensured reliability of regression models. Poisson regression and linear mixed models were additionally applied to strengthen the robustness of findings.
Ethical Consideration
This study adhered to the highest ethical standards in conducting research with smallholder farmers in Uganda. Ethical approval was obtained from the Clarke International University Research Ethics Committee (Approval No. CLARKE-2025-1685) and the Uganda National Council for Science and Technology (Reference No. SS4673ES), with permissions secured from relevant district and community authorities. Informed consent was obtained from all participants, emphasizing voluntary participation, the right to withdraw, and confidentiality of responses. Data were anonymized and securely stored, while risks were minimized by focusing on non-sensitive topics and benefits maximized through dissemination of findings to communities and stakeholders. Researcher integrity was maintained through transparency, respect for cultural norms, and fair representation of participants’ perspectives.
Results
Demographic characteristics of the study respondents
The study had an initial sample size of 422, however, only 387 participants participated, giving a response rate of 91.7%. Table 1. Shows that, the highest rate for the respondents were 219 (56.6%), majority were male 286 (56.6%), with 367 (94.8%) being married, and majority 189 (48.8%) had obtained primary education.
Table 1. Demographic Characteristics of study respondents| Variable | Sub-category | Frequency (n=387) | Percentage (%) |
|---|---|---|---|
| Age Group | |||
| Below 20 | 1 | 0.3% | |
| 20-24 years | 18 | 4.7% | |
| 25-29 years | 17 | 4.4% | |
| 30-34 years | 40 | 10.3% | |
| 35-39 years | 43 | 11.1% | |
| 40-44 years | 49 | 12.7% | |
| 45 years and more | 219 | 56.6% | |
| Sex (Gender) | |||
| Male | 286 | 73.9% | |
| Female | 101 | 26.1% | |
| Marital Status | |||
| Married | 367 | 94.8% | |
| Single | 16 | 4.1% | |
| Widowed | 3 | 0.8% | |
| Divorced/Separated | 1 | 0.3% | |
| Education Status | |||
| No formal education | 14 | 3.6% | |
| Primary education | 189 | 48.8% | |
| Secondary education | 138 | 35.7% | |
| Tertiary/Vocational | 34 | 8.8% | |
| University | 12 | 3.1% |
Table 2 presents descriptive statistics on respondents' adoption of irrigation technologies. The table shows the extent to which various irrigation methods, including sprinkler, drip, surface, pump, hose pipe, rainwater harvesting, small-scale, and solar-powered systems, are utilized by farmers. It includes the distribution of responses across a five-point Likert scale (Strongly Disagree to Strongly Agree), along with mean scores, standard deviations, and an interpretation of adoption levels.
Table 2. Descriptive Statistics on the Use of Irrigation| Use of Irrigation | n | Strongly Disagree | Disagree | Not sure | Agree | Strongly Agree | Mean | Std. dev. | Interpretation |
| I use sprinkler irrigation systems for crop watering. | 387 | 52.20% | 28.94% | 11.11% | 3.36% | 4.39% | 1.788 | 1.059 | Very Low |
| I use drip irrigation systems to water our crops. | 387 | 55.04% | 26.87% | 10.08% | 5.68% | 2.33% | 1.734 | 1.010 | Very Low |
| I rely on surface irrigation methods for our crops. | 387 | 51.94% | 29.72% | 13.70% | 1.29% | 3.36% | 1.744 | 0.973 | Very Low |
| I use rainwater harvesting techniques for irrigation. | 387 | 51.16% | 30.75% | 1.03% | 5.17% | 11.89% | 1.959 | 1.342 | Low |
| I use pump irrigation systems to access water for farming. | 387 | 45.99% | 30.75% | 10.59% | 4.13% | 8.53% | 1.984 | 1.226 | Low |
| I utilize hose pipe irrigation systems to distribute water efficiently. | 387 | 41.86% | 35.66% | 11.37% | 3.36% | 7.75% | 1.995 | 1.170 | Low |
| I have adopted small-scale irrigation systems like bucket or manual pumps for crop watering | 387 | 30.49% | 23.00% | 10.34% | 18.86% | 17.31% | 2.695 | 1.498 | Moderate |
| I use solar powered systems for irrigation | 387 | 48.84% | 30.23% | 11.89% | 1.55% | 7.49% | 1.886 | 1.155 | Low |
| Overall | 387 | 1.973 | 0.897 | Low |
For sprinkler irrigation systems, adoption is very low. More than half of respondents (52.20%) strongly disagreed, and 28.94% disagreed with using sprinklers for crop watering. Only a small proportion, 7.75%, reported using this method. The Likert mean of 1.788 (SD = 1.059) confirms very low adoption, indicating that sprinklers are largely inaccessible or impractical for most farmers.
Drip irrigation systems show the lowest adoption among all technologies. A majority of farmers, 55.04%, strongly disagreed, and 26.87% disagreed with using drip systems. Only 8.01% reported using drip irrigation. The Likert mean of 1.734 (SD = 1.010) emphasizes very low adoption, likely due to high costs or technical complexity.
The use of surface irrigation methods is similarly low, with 51.94% strongly disagreeing and 29.72% disagreeing. The Likert Mean of 1.744 (SD = 0.973) indicates minimal usage, suggesting that even traditional irrigation methods are not widely applied, possibly due to limited water availability. Rainwater harvesting techniques have slightly higher adoption, with 11.89% of respondents strongly agreeing and 5.17% agreeing. Over 80% of respondents either disagreed or were not sure about using rainwater harvesting. The Likert Mean is 1.959 (SD = 1.342), indicating low adoption, suggesting potential constraints in infrastructure or knowledge.
Pump irrigation systems are underutilized, with 45.99% strongly disagreeing and 30.75% disagreeing. Only 12.66% reported using pumps. The Likert mean of 1.984 (SD = 1.226) shows low adoption, likely due to limited access to pumps or operational costs. Hose pipe irrigation systems also show low adoption. A majority, 41.86% strongly disagreed and 35.66% disagreed with using hoses. The Likert mean of 1.995 (SD = 1.170) confirms low usage, reflecting preference for simpler water distribution methods. The highest adoption is observed for small-scale irrigation systems such as buckets or manual pumps. Here, 18.86% agreed, and 17.31% strongly agreed to using these methods. The Likert mean of 2.695 (SD = 1.498) indicates moderate adoption, showing that farmers prefer low-cost, easy-to-use irrigation solutions.
Solar-powered irrigation systems have low adoption, with 48.84% strongly disagreeing and 30.23% disagreeing. Only 9.04% reported using solar systems. The Likert mean of 1.886 (SD = 1.155) confirms limited uptake, likely due to high cost and technical requirements. Overall, the adoption of irrigation technologies among respondents is low, with a mean of 1.973 (SD = 0.897). Farmers primarily rely on basic, affordable irrigation methods rather than modern systems. To improve adoption, interventions should focus on raising awareness, providing technical training, and expanding access to affordable irrigation technologies.
The findings reveal actual adoption of irrigation technologies among smallholder farmers in the Teso Sub-Region. While farmers demonstrate a solid understanding of various irrigation methods, including drip and sprinkler systems, and express strong interest in adopting these technologies, adoption rates remain exceedingly low, as evidenced by the quantitative data (e.g., low Likert mean scores for drip and sprinkler systems). Despite these challenges, the significant motivation and willingness of farmers to adopt modern irrigation technologies, if given the opportunity, reinforces the need for targeted policy interventions. Expanding subsidized irrigation programs, strengthening extension services, and improving access to affordable financing are crucial to overcome these barriers. In conclusion, while there is widespread awareness and interest in adopting irrigation technologies among smallholder farmers in the Teso Sub-Region, adoption rates remain low due to structural and systemic barriers. The consistent findings from both qualitative and quantitative analyses highlight issues such as high initial costs, limited access to credit, and uneven distribution of government support as key challenges. Nevertheless, farmers’ enthusiasm for adopting irrigation technologies emphasizes the potential for significant improvements in agricultural productivity and livelihood outcomes if these barriers are addressed. Therefore, targeted interventions are essential to promote greater uptake of irrigation technologies, ultimately improving the resilience and livelihoods of smallholder farmers in the region.
Livelihood outcomes of smallholder farmers
Table 3 presents the descriptive statistics on the livelihood outcomes of smallholder farmers in selected districts of the Teso Sub-Region. The table summarizes farmers’ perceptions across multiple dimensions of livelihoods, including agricultural productivity, income growth, food security, access to social services, and asset accumulation. Responses were measured using a five-point Likert scale ranging from “Strongly Disagree” to “Strongly Agree,” with higher mean scores indicating better outcomes. The statistics provide insights into the extent to which smallholder farmers have experienced improvements in crop yields, household income, food availability, social welfare, and asset acquisition as a result of agricultural interventions, technologies, and support systems in the region
Table 3. Descriptive statistics on Livelihood outcomes of smallholder farmers| Livelihood Outcomes | n | Strongly Disagree | Disagree | Not sure | Agree | Strongly Agree | Mean | Std. dev. | Interpretation |
| Agricultural output productivity | |||||||||
| I achieve high crop yields | 387 | 0.52% | 3.88% | 1.55% | 53.49% | 40.57% | 4.297 | 0.732 | Very High |
| My crop production has consistently increased | 387 | 0% | 7.49% | 2.58% | 50.90% | 39.02% | 4.214 | 0.819 | Very High |
| The input-to-output ratio on my farm is efficient allowing for better profitability. | 387 | 0.26% | 18.86% | 3.36% | 47.55% | 29.97% | 3.881 | 1.049 | High |
| I experience minimal post-harvest losses due to proper storage and handling | 387 | 2.07% | 21.96% | 1.29% | 52.45% | 22.22% | 3.708 | 1.103 | High |
| My farm is well-adapted to varying climate conditions, ensuring consistent productivity. | 387 | 7.49% | 47.80% | 2.84% | 30.23% | 11.63% | 2.907 | 1.241 | Moderate |
| Overall-Agricultural output productivity | 387 | 3.802 | 0.688 | High | |||||
| Income growth | |||||||||
| My household income has increased as a result of improved agricultural productivity. | 387 | 0.78% | 15.50% | 2.33% | 53.75% | 27.65% | 3.920 | 0.993 | High |
| I have been able to invest in other income-generating activities as a result of increased agricultural earnings. | 387 | 5.43% | 17.83% | 0.26% | 47.29% | 29.20% | 3.770 | 1.203 | High |
| My farm's profitability has improved due to better market access and government support programs. | 387 | 7.49% | 41.34% | 2.07% | 28.42% | 20.67% | 3.134 | 1.346 | Moderate |
| I am able to save more money because of the increased income from my agricultural activities. | 387 | 1.03% | 17.31% | 3.10% | 51.16% | 27.39% | 3.866 | 1.037 | High |
| Overall-Income growth | 387 | 3.672 | 0.894 | High | |||||
| Food security | |||||||||
| My family has enough food | 387 | 0.26% | 1.03% | 3.62% | 58.40% | 36.69% | 4.302 | 0.614 | Very High |
| I can now produce a variety of crops that contribute to the nutritional needs of my family | 387 | 0% | 5.43% | 0.26% | 43.15% | 51.16% | 4.401 | 0.757 | Very High |
| I am able to store enough food | 387 | 0% | 4.39% | 0.26% | 55.04% | 40.31% | 4.313 | 0.696 | Very High |
| My farm’s food production has contributed to the overall food security of my community. | 387 | 0.52% | 20.16% | 3.36% | 42.38% | 33.59% | 3.884 | 1.101 | High |
| My household has a variety of food types consumed | 387 | 0.26% | 5.43% | 2.07% | 54.52% | 37.73% | 4.240 | 0.763 | Very High |
| Overall -Food Security | 387 | 4.228 | 0.609 | Very High | |||||
| Social services | |||||||||
| I’m able to pay for my children's education. | 387 | 0% | 3.10% | 0.52% | 53.23% | 43.15% | 4.364 | 0.655 | Very High |
| I can afford better healthcare for my family | 387 | 0.26% | 3.88% | 0.26% | 52.97% | 42.64% | 4.339 | 0.703 | Very High |
| I’m able to access clean water for my household. | 387 | 0% | 0.52% | 0% | 52.97% | 46.51% | 4.455 | 0.529 | Very High |
| I can now afford better housing for my family | 387 | 1.29% | 6.46% | 1.03% | 51.94% | 39.28% | 4.214 | 0.857 | Very High |
| I’m able to invest in household energy solutions, such as solar panels | 387 | 5.94% | 16.28% | 4.91% | 40.05% | 32.82% | 3.775 | 1.232 | High |
| I’m able to participate in village saving and credit associations | 387 | 2.07% | 4.65% | 0.52% | 47.55% | 45.22% | 4.292 | 0.864 | Very High |
| Overall-Social Services | 387 | 4.240 | 0.551 | Very High | |||||
| Asset growth | |||||||||
| I have been able to acquire more land due to the increased income | 387 | 9.82% | 23.51% | 1.29% | 37.21% | 28.17% | 3.504 | 1.370 | High |
| I have invested in better farming equipment and tools. | 387 | 2.58% | 29.46% | 1.29% | 42.64% | 24.03% | 3.561 | 1.214 | High |
| I have acquired additional assets such as livestock, which contribute to my household's wealth. | 387 | 2.07% | 13.95% | 0.26% | 49.10% | 34.63% | 4.003 | 1.047 | Very High |
| I have been able to improve my house or living conditions have improved | 387 | 0.52% | 11.89% | 1.29% | 58.40% | 27.91% | 4.013 | 0.903 | Very High |
| I have been able to buy assets such as bicycle, motorcycle, etc. | 387 | 12.40% | 10.34% | 0.26% | 47.03% | 29.97% | 3.718 | 1.326 | High |
| Overall -Asset growth | 387 | 3.760 | 0.795 | High | |||||
| Overall -Livelihood Outcomes | 387 | 3.963 | 0.577 | High |
Agricultural Output Productivity
Respondents reported high crop yields, with 53.49% agreeing and 40.57% strongly agreeing that they achieve high productivity. The Likert mean of 4.297 (SD = 0.732) indicates very high productivity as indicated in Table 4. Similarly, 50.90% agreed and 39.02% strongly agreed that crop production has consistently increased (mean = 4.214, SD = 0.819), confirming very high positive trends. The input-to-output ratio is efficient for most, with a mean of 3.881 (SD = 1.049), reflecting high profitability. Minimal post-harvest losses were also reported (mean = 3.708, SD = 1.103). However, adaptation to varying climate conditions is moderate, with only 30.23% agreeing and 11.63% strongly agreeing, resulting in a mean of 2.907 (SD = 1.241). Overall, agricultural output productivity is high (mean = 3.802, SD = 0.688), highlighting generally strong farm performance but with some vulnerability to climate variability (refer to Table 4).
Household income growth is mostly high, with 53.75% agreeing and 27.65% strongly agreeing that income has increased due to improved agricultural productivity (mean = 3.920, SD = 0.993). Investments in other income-generating activities and savings from agricultural earnings were also high (means = 3.770 and 3.866). Improvement in farm profitability due to market access and government support is moderate (mean = 3.134, SD = 1.346), showing some constraints in external support. Overall, income growth is high (mean = 3.672, SD = 0.894), suggesting that agricultural productivity translates into tangible financial benefits for farmers.
Food security outcomes are very high, with most households reporting sufficient food. For instance, 58.40% agreed and 36.69% strongly agreed that their families have enough food (mean = 4.302, SD = 0.614). The ability to produce diverse crops for nutrition is also high (mean = 4.401, SD = 0.757), as is food storage (mean = 4.313, SD = 0.696). Contributions to community food security are slightly lower (mean = 3.884, SD = 1.101), but overall food security remains very high (mean = 4.228, SD = 0.609).
Respondents reported high access to social services. Education and healthcare expenses are manageable, with means = 4.364 and 4.339. Access to clean water (mean = 4.455, SD = 0.529) is among the highest, while investing in household energy solutions is slightly lower (mean = 3.775, SD = 1.232). Participation in savings and credit associations is also very high (mean = 4.292, SD = 0.864). Overall, social services outcomes are very high (mean = 4.240, SD = 0.551).
Farmers reported high acquisition of assets, including land (mean = 3.504, SD = 1.370), farming equipment (mean = 3.561, SD = 1.214), livestock (mean = 4.003, SD = 1.047), and home improvements (mean = 4.013, SD = 0.903). Purchase of smaller assets, such as bicycles and motorcycles, is moderately high (mean = 3.718, SD = 1.326). Overall, asset growth is high (mean = 3.760, SD = 0.795), reflecting increased wealth and productive capacity (refer to Table 4).
The overall livelihood outcomes of smallholder farmers are high (mean = 3.963, SD = 0.577). Farmers demonstrate strong agricultural productivity, income growth, food security, access to social services, and asset accumulation. The highest outcomes are observed in food security and social services, while climate adaptation within agricultural productivity shows relatively lower performance, indicating areas for targeted interventions.
Table 4. Correlational analysis showing the relationship between the use of irrigation and the livelihood of smallholder farmers in selected districts of the Teso Sub-Region| Variable | Livelihood Outcomes | Use of Irrigation |
| Livelihood Outcomes | 1.000 | |
| Use of Irrigation | 0.208 (p-value=0.0000) | 1.000 |
The correlational analysis shows a weak but positive and statistically significant relationship (r = 0.208, p = 0.000) between the use of irrigation and the livelihood outcomes of smallholder farmers in the Teso Sub-Region. This means that farmers who adopt irrigation tend to experience slightly improved livelihoods, such as better food security, higher incomes, and increased asset acquisition compared to those who do not. Although the correlation is modest, its significance indicates that irrigation contributes meaningfully to livelihood improvement (refer to Table 5).
Table 5. Regression analysis showing the relationship between the use of irrigation and the livelihood of smallholder farmers in selected districts of Teso Sub-Region| Source | SS | df | MS | ||
| Model | 5.55913157 | 1 | 5.55913157 | Number of obs = | 387 |
| Residual | 122.896594 | 385 | .319211934 | F(1, 385) = | 17.42 |
| Total | 128.455726 | 386 | .332786855 | Prob > F = | 0.0000 |
| R-squared = | 0.0433 | ||||
| Adj R-squared = | 0.0408 | ||||
| Root MSE = | .56499 | ||||
| Livelihood_Out~s | Coefficient | Std. err. | t | P>|t| | 95% conf. interval |
| Use_of_Irrigat~n _cons | .1337741 | .0320559 | 4.17 | 0.000 | .0707476 .1968007 |
| 3.699035 | .0694673 | 53.25 | 0.000 | 3.562453 3.835618 | |
The regression analysis shows a positive and statistically significant relationship between the use of irrigation and the livelihood outcomes of smallholder farmers in the Teso Sub-Region. The coefficient for irrigation technologies is 0.134 (p = 0.000), indicating that for each unit increase in irrigation adoption, livelihood outcomes improve by approximately 0.13 units, holding other factors constant. The model is statistically significant overall (F(1, 385) = 17.42, p = 0.000), and the adjusted R-squared of 0.0408 indicates that about 4.1% of the variation in livelihood outcomes is explained by irrigation adoption.
Discussion
The results of this study highlight a paradox in Uganda’s smallholder farming systems. On one hand, farmers report strong livelihood outcomes, high crop yields, improved household income, food security, and access to social services. On the other hand, the actual adoption of modern irrigation technologies remains strikingly low. This disconnect suggests that while farmers are achieving productivity gains, these are largely driven by traditional practices and small-scale methods rather than transformative irrigation technologies.
The low uptake of drip, sprinkler, and solar-powered irrigation systems reflects structural barriers. High costs, limited access to credit, and uneven government support emerged as consistent constraints. These findings mirror evidence from Ethiopia and Ghana, where similar financial and institutional challenges have slowed irrigation adoption 2, 3. The Ugandan case reinforces the argument that awareness alone does not translate into adoption; enabling policies and affordable financing are critical.
It is important to note that irrigation adoption, though limited, still contributes positively to livelihoods. The regression analysis showed that irrigation explains about 4.1% of the variation in livelihood outcomes. While modest, this effect is statistically significant, confirming that irrigation plays a role in improving welfare indicators such as food security and income. However, the relatively small explanatory power points to the influence of other factors, market access, government support, and climate variability, which remain central to farmers’ resilience 4, 5.
A particularly critical finding is the moderate performance in climate adaptation. Farmers expressed less confidence in their ability to adjust to changing weather conditions, despite irrigation being recognized globally as a climate adaptation strategy 6. This underscores the vulnerability of Ugandan smallholders: without scaling irrigation adoption, they remain exposed to rainfall variability and climate shocks.
The researchers argue that the enthusiasm expressed by farmers for adopting modern irrigation technologies, if given the opportunity, is a strong signal for policy. Farmers’ willingness demonstrates that the barrier is not cultural resistance but rather affordability and access. This suggests that interventions such as subsidies, targeted credit schemes, and stronger extension services could unlock significant productivity and resilience gains. Moreover, the reliance on small-scale, low-cost methods reflects both farmers’ ingenuity and their marginalization from modern innovations. This dual reality, high willingness but low adoption, should guide policymakers to prioritize equity in resource distribution, ensuring that irrigation technologies are not confined to wealthier or better-connected farmers 7.
In conclusion, the study reveals both promise and constraint. Irrigation adoption contributes positively to livelihoods, but its limited scale undermines its transformative potential. Addressing structural barriers, financial, technical, and institutional is essential if Uganda is to harness irrigation as a pathway to sustainable agricultural productivity and resilience.
Conclusion
Irrigation farming adoption among smallholder farmers in Uganda remains low, constrained by financial, technical, and institutional barriers. Nevertheless, farmers demonstrate strong willingness to adopt modern irrigation systems if given the opportunity. Livelihood outcomes, including productivity, income growth, food security, social services, and asset accumulation, are generally high, with food security and social services showing the strongest gains. Climate adaptation, however, remains moderate, underscoring vulnerability to variability. Overall, irrigation adoption contributes positively to livelihoods, but greater uptake is essential to maximize benefits.
Recommendation
The study clearly shows that while smallholder farmers in Uganda are achieving strong livelihood outcomes, high productivity, income growth, food security, and access to social services, the actual adoption of modern irrigation technologies remains very low, constrained by cost, credit access, and uneven government support. This gap between awareness and adoption highlights a structural problem: farmers are willing and motivated to adopt but lack the enabling environment to do so. The modest but significant correlation between irrigation and livelihood outcomes suggests that irrigation contributes positively, yet its limited scale undermines its transformative potential. Critically, climate adaptation remains weak, leaving farmers vulnerable to variability despite irrigation’s recognized role in resilience. These findings call for urgent policy attention to affordability, equitable distribution of resources, and integration of climate-smart practices, so that irrigation can move from being a marginal contributor to a central driver of sustainable livelihoods.
Author's contribution
Conceptualized and designed the study, VA, participated in data analysis and methodology alignment: FOM, and CE. All authors contributed to the manuscript's final review, editing, and approval.
Consent for Publication
All participants involved in the study provided informed consent for participation and for publication. The consent statement was documented within the informed consent form, and it included explicit agreement that anonymized data and results will be published and disseminated among key stakeholders.
References
- 2.Tesfaye A, Alemu D, Bekele S. (2021) Motorized pumps and household income among smallholder farmers in. , Ethiopia.Agricultural Water Management 243, 106-112.
- 3.Agula C, J A Awuni, S I Alhassan, Braimah I. (2018) Ecosystem-friendly irrigation practices and agricultural sustainability in. , Ghana.Environmental Management 62(3), 10-1007.
- 4.Zeweld W, G Van Huylenbroeck, Tesfaye A, Speelman S. (2015) Small-scale irrigation and its impact on household income and food security in Ethiopia.Food Security. 7(5), 1207-1223.
- 5.Assefa T, Gebremedhin B, Tadesse T. (2022) Irrigation adoption and asset accumulation among smallholder farmers in. , Ethiopia.Agricultural Economics Review 43(2), 215-229.
- 6.Serote P, Moyo T, Dlamini N. (2021) Climate-smart irrigation technologies for water optimization in smallholder farming.Sustainability. , Science 16(5), 1345-1358.
- 7.Birhanu D, Alemu T, Mekonnen G. (2023) Livelihood benefits of solar-powered irrigation systems in sub-Saharan. , Africa.African Journal of Agricultural Research 18(4), 112-124.
- 8. (2020) FAO.Irrigation and agricultural productivity in Africa: A review of evidence. Food and Agriculture Organization of the United Nations.
- 9.R V Krejcie, D W Morgan. (1970) Determining sample size for research activities.Educational and Psychological Measurement. 30(3), 607-610.
- 10.Mohammed A, Shallo S. (2020) Efficiency gains from irrigation technologies in. , Ethiopia.Journal of Rural Development 39(1), 45-62.