
The Design and Demonstrative Analysis of the Gas Turbine Operation’s Simulator
Abstract
The Gas Turbine operation was investigated with a view to evolving a system designed to provide a realistic imitation of the controls and operation of a Gas Turbine, used for training purposes. Operator Training Simulator has been widely adopted by many industries being a computer simulation which attempts to model a real-life plant so that it can be studied. A well trained and skilled operator is key in increasing power plant safety and productivity. Therefore, enabling quality training for operators is becoming more important as they need to handle increased load of information and duties whereas the lack of training is a major reason for inadequate performance. By changing variables in the simulator, predictions are made about the behaviour of the engine. It is a tool to virtually investigate the behaviour of the system while in operation. This work becomes indispensable because it is prohibitively expensive or simply too dangerous to allow trainees use the real equipment in a power plant. The Gas Turbine operation’s simulator is born from Object Oriented Programming, employing key programming languages. The simulator design focused on specific tasks in the operation of the Gas Turbine which include; startup, synchronization and monitoring of vital parameters like vibration, temperature, pressure, and angle of the Inlet Guide Vane. The statuses of various valves, pumps and motors as well as the Performance of actuators and the response of concatenated components are also being tracked. The simulator was found to effectively mimic a real plant life. With this simulator, trainee operators in Gas Turbine can spend time learning valuable lessons in a "safe" virtual environment yet living a lifelike experience. This will go a long way in minimizing operators’ error in GT power plants, thereby curtailing power outages and conserving power plant components.
Article Information
- Received
- Accepted
- Published
Academic Editor: Reza Razaghi, School of Mechanical Engineering, Iran University of Science & Technology, Narmak, Tehran, Iran.
Checked for plagiarism: Yes
Review by: Single-blind
Copyright © 2023 Abel Edeowede Abhulimen
 This is an open-access article distributed under the terms of the Creative Commons Attribution License, which permits unrestricted use, distribution, and reproduction in any medium, provided the original author and source are credited.
Corresponding author: Abel Edeowede Abhulimen, National Power Training Institute of Nigeria (NAPTIN) —
Competing Interests
The authors have declared that no competing interests exist.
Funding
No specific funding statement was provided by the authors.
Data Availability
No data-availability statement was provided by the authors.
Citation:
Introduction
The history of the gas turbine goes back to 1791, when John Barber patented his work “A method for Rising Inflammable Air for the Purpose of Producing Motion and Facilitating Metallurgical Operations”. Many attempts have been made since then particularly in the early 1900s to build an operational gas turbine. In 1903, a Norwegian, Aegidius Elling, built the first successful gas turbine using a rotary/dynamic compressor and turbine, which is credited with building the first gas turbine that, produced excess power of about 8kW. By 1904 Elling had improved his design, achieving exhaust gas temperatures of 773K, from 673K and producing about 33kW. The engine operated at about 20 000rpm. Much of his later work was carried out (from 1924 to 1927) at Kongsberg, in Norway 1. The gas turbine which began as a relatively simple engine has evolved into a complex but reliable and high efficiency prime mover. The principle behind the basic operation of gas turbine is known as the Brayton cycle. The gas turbine comprises three main components namely; the compressor, the combustion chamber (combustor) and the turbine. These three components are illustrated in Figure 1. A gas turbine comprising these components is often referred to as a simple cycle gas turbine. Clearly, the power output from a gas turbine depends on the efficiency of these three components. The higher the efficiency of the components, the better will be the performance of the gas turbine, resulting in increased power output and thermal efficiency. It uses air as the working fluid where fresh atmospheric air is drawn into the engine and brought to a higher pressure by the compressor. Energy is then added by spraying fuel into the air and igniting it in the combustion chamber, in order that the combustion generates a high-temperature flow. This high temperature high-pressure gas enters the turbine, where it expands down to the exhaust pressure, producing a shaft work output in the process 2
In an ideal gas turbine, gases undergo four thermodynamic processes: an adiabatic compression, isobaric (constant pressure) combustion, adiabatic expansion and isobaric heat rejection. Together, these make up the Brayton cycle. The Temperature-Entropy (TS) diagram representation of Figure 1 is shown in Figure 2. Point 1 to point 2 begins the process, where air is drawn in and isentropically compressed.
Figure 1. Single shaft, simple cycle gas turbine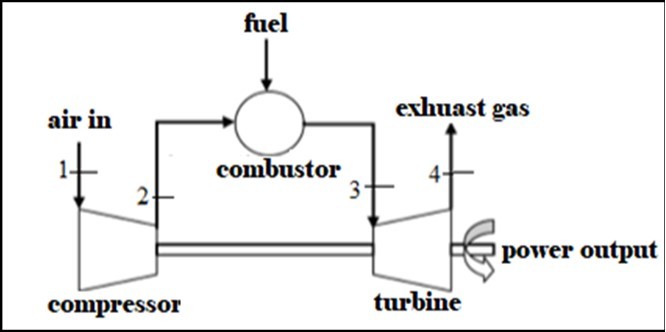
Download figure
Figure 2. T-S Diagram of an ideal simple cycle 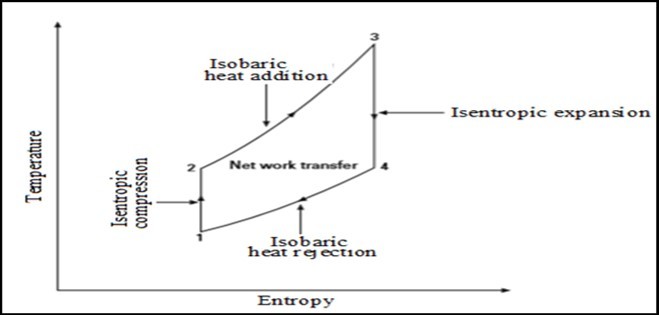
Download figure
The compressed air is heated at constant pressure from point 2 to point 3. The flue gas is isentropically expanded from point 3 to point 4. Finally, the working fluid is exhausted at constant pressure to the atmosphere from point 4 back to point 1.
Conventional training methodologies are not enough to train an operator for seldom-occurring dangerous situations in the power sector. Therefore, the operator training simulator (OTS) has become inevitable part of their training where they are able to learn without actually endangering the plant and personnel 3.
Overview Of Electricity Generation
Electricity generation is the process of generating electric power from sources of primary energy. For electric utilities in the electric power industry, it is the first stage in the delivery of electricity to end users, the other stages being transmission, distribution, energy storage and recovery, using pumped-storage methods.A characteristic of electricity is that it is not a primary energy freely present in nature in remarkable amounts and it must be produced. Production is carried out in power plants. Electricity is most often generated at a power station by electromechanical generators, primarily driven by heat engines fueled by combustion or nuclear fission but also by other means such as the kinetic energy of flowing water and wind. Other energy sources include solar photovoltaics and geothermal power 4. In portable and mobile applications, electrochemical mean of electricity generation may be employed. Currently, most electrochemical power comes from batteries. Primary cells, such as the common zinc–carbon batteries, act as power sources directly, but secondary cells (i.e., rechargeable batteries) are used for storage systems rather than primary generation systems. Open electrochemical systems, known as fuel cells, can be used to extract power either from natural fuels or from synthesized fuels. Osmotic power is a possibility at places where salt and fresh water merges 5.
Power Generation In Nigeria
Electricity generation in Nigeria began in 1896. The Nigeria Electricity Supply Company (NESCO) commenced operations as an electric utility company in Nigeria in 1929 with the construction of a hydroelectric power station at Kurra near Jos. The Electricity Corporation of Nigeria (ECN) was established in 1951, while the first 132KV line was constructed in 1962, linking Ijora Power Station to Ibadan Power Station. The Niger Dams Authority (NDA) was established in 1962 with a mandate to develop the hydropower potentials of the country. However, ECN and NDA were merged in 1972 to form the National Electric Power Authority (NEPA). In 1998, NEPA ceased to have an exclusive monopoly over electricity generation, transmission, distribution and sales. The Authority had nine (9) power stations. However, power generation facilities received no expansion throughout the 1990s, even with the increase in population and structure. By 1999, the installed capacity of 5,906MW reached could hardly supply 1,750MW of electricity to a population of 120 million people. As at 2000, the generation capacity decreased to 1,500MW, representing 25.3 percent of installed capacity. The total installed capacity then, hovered around 6,200MW from 2 hydro and 4 thermal plants 6. Presently, Nigeria’s population is over 211 million 7. Also, it is the country that attracts more direct foreign investments than any other in Africa. An electricity demand estimate for developing countries is about 1000MW per million people. That means Nigeria would require a minimum of 211,000MW generation of electricity to meet up with her current demands. This is a far margin from the present status of total installed capacity the country possesses 6.
Gas Turbine Configuration
The Gas turbine engine derives its power from burning fuel in a combustion chamber and using the fast-flowing combustion gases to drive a turbine in much the same way as the high-pressure steam drives a steam turbine. The compressor draws in air, compresses it and feeds it at high pressure into the combustion chamber increasing the intensity of the burning flame via a positive feedback mechanism. As the turbine speeds up, it also causes the compressor to speed up, forcing more air through the combustion chamber which in turn increases the rate of burning fuel and sending more high-pressure hot gases into the turbine, thereby increasing its speed even more 8. The gas turbine cycle can be classified mainly into two categories. These are:
Open cycle gas turbine power plant and
Closed cycle gas turbine power plant
In the open cycle gas turbine power plant, atmospheric air is charged into the combustor through acompressor and the exhaust of the turbine also discharges to the atmosphere as shown in Figure 3. In the closed cycle gas turbine power plant, the mass of the working fluid is constant. This fluid circulates through the cycle over and over again 8, as shown in Figure 4. Besides the advantages of a smaller compressor and turbine as well as efficient control, the closed cycle also avoids erosion of the turbine blades and other detrimental effects due to the products of combustion. The chief disadvantage of the closed cycle however, is the need for an external heating system, which involves the use of an auxiliary cycle and introduces a temperature difference between the combustion gases and the working fluid.
Early gas turbines found only limited use despite their versatility and their ability to burn a variety of fuels, because of low compressor and turbine efficiencies as well as low turbine inlet temperatures due to metallurgical limitations.
The open cycle gas turbine configuration is achieved with different layouts such as;
Single shaft GT
Two-shaft GT and
Three-shaft GT.
A single-shaft gas turbine consists of a compressor, combustor and a turbine as shown in Figure 1.
Figure 3. The Open cycle system
Download figure
Figure 4. The closed cycle system
Download figure
Figure 5. layout of a two-shaft gas turbine with a power turbine.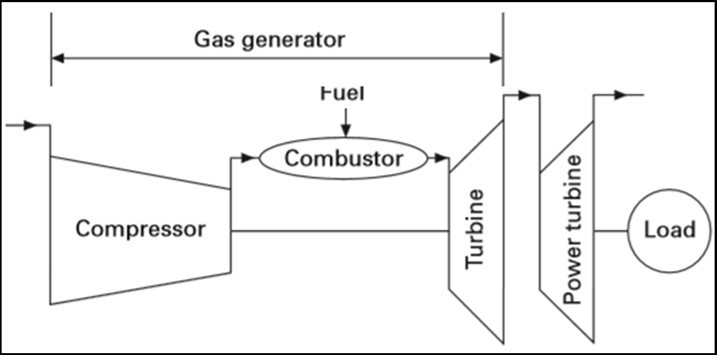
Download figure
It has the advantage of preventing over-speed conditions due to the high power required by the compressor and can therefore act as an effective brake in case of loss of electrical load. However, the expansion process in the turbine may be split into two separate turbines. The first is used to drive the compressor and the second is used to drive the load as illustrated in Figure 5. The mechanically independent (free) turbine driving the load is called the power turbine. The remaining turbine or high pressure turbine, the compressor and the combustor are collectively called the gas generator. Two-shaft gas turbines operating with a power turbine are often used to drive loads where there is a significant variation in the speed with power demand such as in mechanical drive applications like gas compression.
Gas turbine Control
The power output from the gas turbine is primarily controlled by the amount of fuel that is burnt in the combustor. Uncontrolled fuel addition will lead to overheating of the turbine and over-speeding, which can seriously damage the engine. Therefore, there is a necessity for a control mechanism to prevent the engine from exceeding its operating limits. However, the performance of the gas turbine should not be compromised in the process. Control systems are quite complex, particularly in units having Dry Low NOx (DLN)combustors, having additional requirements of maintaining air–fuel ratios within acceptable limits so as to keep low emissions of NOx, CO and other unburnt hydrocarbons 9.
Gas Turbine Simulator
Understanding gas turbine performance is of paramount importance in order to minimize life cycle costs. This can be achieved using simulators. Simulators address not only engine performance (including power augmentation and enhancement) but also its deterioration, emissions, turbine creep life usage, controls and life cycle cost analysis. The use of simulator therefore helps in gaining invaluable insight and experience into gas turbine performance and operability 10.
Simulation models for gas turbines are widely used in the design and development stage, as well as control and operation stage and finds a wide spread application in Engine Health Monitoring (EHM). In occurrence of a fault, the anomaly is analyzed by the comparator algorithm that passes its results to the fault identification and isolation algorithm. This algorithm not only detects the presence of the fault but also flags the component that is responsible for the deviations in measurements and lists probable faults in the component. This task is complicated as the signature to source relationship is often not unique and hence, multiple faults in the engine may have the same signature in the measurements. However, increasing the number and quality of measurements greatly improves the reliability of the fault identification and isolation algorithms 11.
Statement Of problem
A well trained and skilled Gas Turbine operator is a key element in increasing the safety and productivity of a thermal power plant. Enabling quality training for operators is becoming more and more important as these operators need to handle an increased load of information and duties while the lack of operators' training is a major reason for operators’ inadequate performance. Conventional training methodologies are not enough to train an operator for seldom-occurring dangerous situations in the power sector. The trial-and-error method currently in place by many Gas Turbine operators in Nigeria has become alarming. This has led to the grounding of many GT units and the increase in incessant and epileptic power situation in the country. A lot of Gas Turbine operators are not adequately trained before they are allowed to man such multi billion naira investments in the power sector and as such, many Gas Turbines are not running due to operators' inefficiencies.
Materials and Methods
Materials
The materials used are manly software for Object Oriented Programming (OOP) employing; classes, objects, methods, abstraction, encapsulation, inheritance and polymorphism. Visual Basic (VB) was employed in transforming the designed concept into visual display.
Methods
The design study is a major phase of the simulation process. In this phase, some steps were investigated in more detail and the technical aspects of the problem given more weight. Several visits for information gathering and observation of the actual process were paid to the various power plants; Afam IV-VI, First Independence Power Ltd (FIPL) and Transcorp power plc. The thesis report involves researching through the internet, collating materials from all NAPTIN modules, obtaining materials from places of field posting and technical field experience gained, as well as consulting various plant manuals. Application software was created from automation tools that select proven GE control and protection algorithms and then integrated with the I/O, sequencing, and displays for each application. The operational algorithms were written in the programming languages which include ladder diagram (LAD) and function block diagram (FBD).
Principles of the Control System
The gas turbine uses two major control modes to achieve its operation. These are:
Open-loop process control and
Closed-loop process control
The design of the simulator which is categorized into; startup system, shutdown system, control system and protection system, was actualized with either the open loop system or the closed loop system at every phase.
Startup Control Design
The start-up control system, functions to bring the gas turbine from zero speed up to operating speed. It is a sequential program that gives commands to the various auxiliaries to come in or go out during the start-up period. It has step orders which must be fulfilled before going to the next step under a specified time. Hence, it is an open loop control. The start-up fuel demand is preset until the gas turbine attains Full Speed No Load (FSNL) status. Various speed relay settings are used to bring in the appropriate auxiliary as the turbine accelerates. The speed relays include:
L14HR–Zero-speed (approx. 0%TNH)
L14HM–Minimum–speed (approx. 16%TNH)
L14HA–Accelerating speed (approx. 50%TNH)
L14HS–Operating speed (approx. 95% TNH)
The design of the startup sequence simulation is summarized in the algorithm illustrated by the information flow charts in Figure 6, Figure 7, Figure 8, Figure 9, and Figure 10.
Figure 6. Startup flow chart-1
Download figure
Figure 7. Startup flow chart-2
Download figure
Figure 8. Startup flow chart-3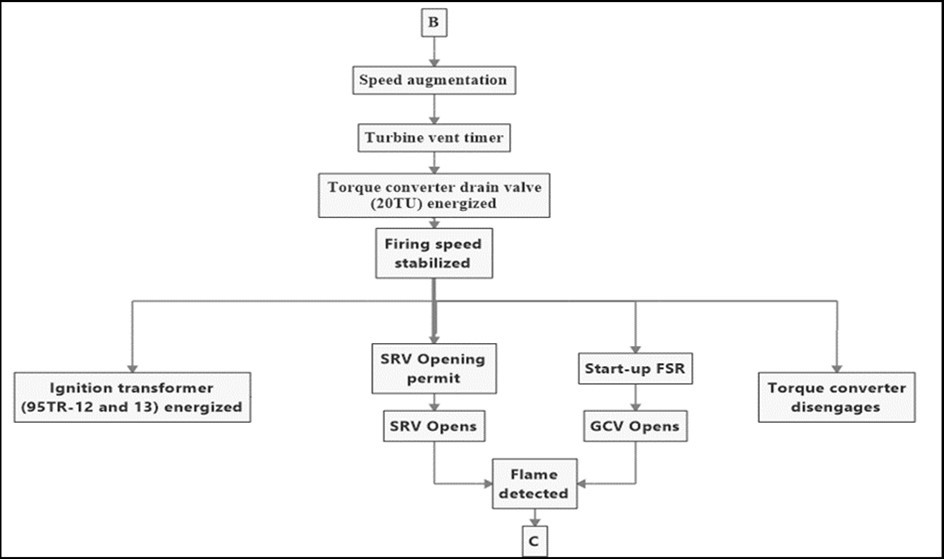
Download figure
Figure 9. Startup flow chart-4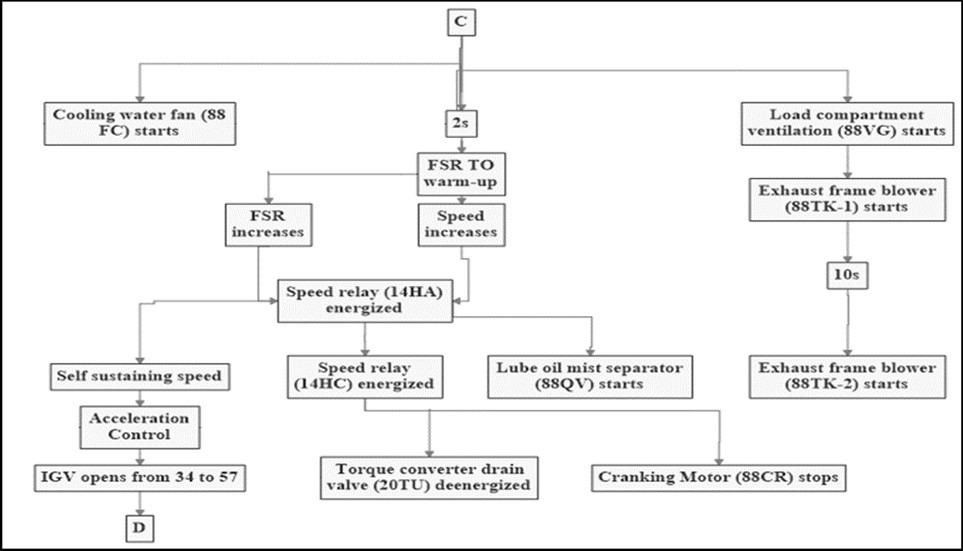
Download figure
Figure 10. Startup flow chart-5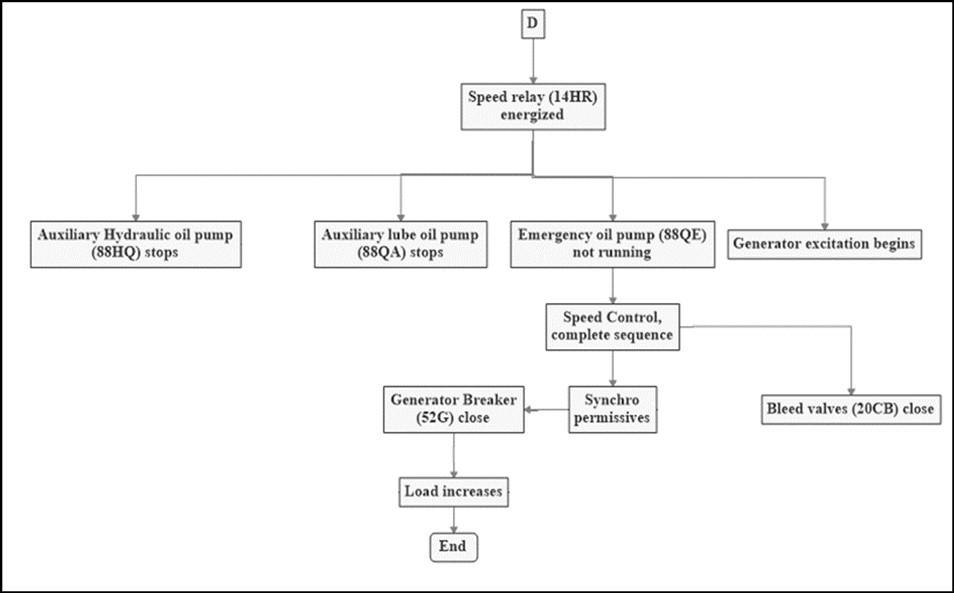
Download figure
Monitoring Control Design
The gas turbine control system, is a sohpisticated Triple Modular Redundant (TMR) microprocessor control system with a heritage of over 40 years of successful turbine automation. This TMR, labeled <R>, <S>, and <T> controllers are identical controllers that are the core of the system. They perform all the critical control algorithms and sequencing as well as acquire the data needed to generate outputs to the turbine. The three control processors, <R>, <S>, and <T>, acquire data from triple-redundant sensors as well as from dual or single sensors. The actual number of sensors will depend on the turbine type. The extremely high reliability achieved by TMR control systems is due in considerable measure to the use of triple sensors for all critical parameters 12.
The monitoring and control design employs the closed loop control mechanism. It is a system in which a quantity being controlled is continuously measured, fedback and compared with another quantity which is the reference input. The result of this comparison is used as the new input which is intended to compensate for the deviation from the desired value as illustrated in Figure 11. The outcome of the comparison is a value called error or deviation. The controller uses this deviation to bring back the process to the desired value called set point. Three coil servos on the valve actuators are separately driven from each controller, and Linear Variable Deferential Transformers (LVDTs) provide the position feedback. The normal position of each valve is the average
Figure 11. Block diagram of a closed loop system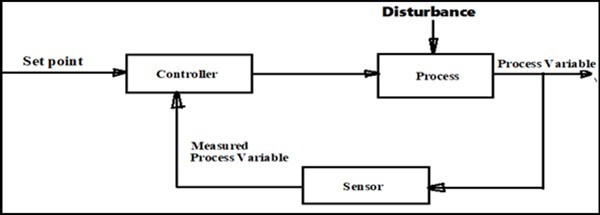
Download figure
of the three commands from <R>, <S>, and <T>. The design algorithm is as illustrated in Figure 12 below.
Figure 12. Monitoring/control flow chart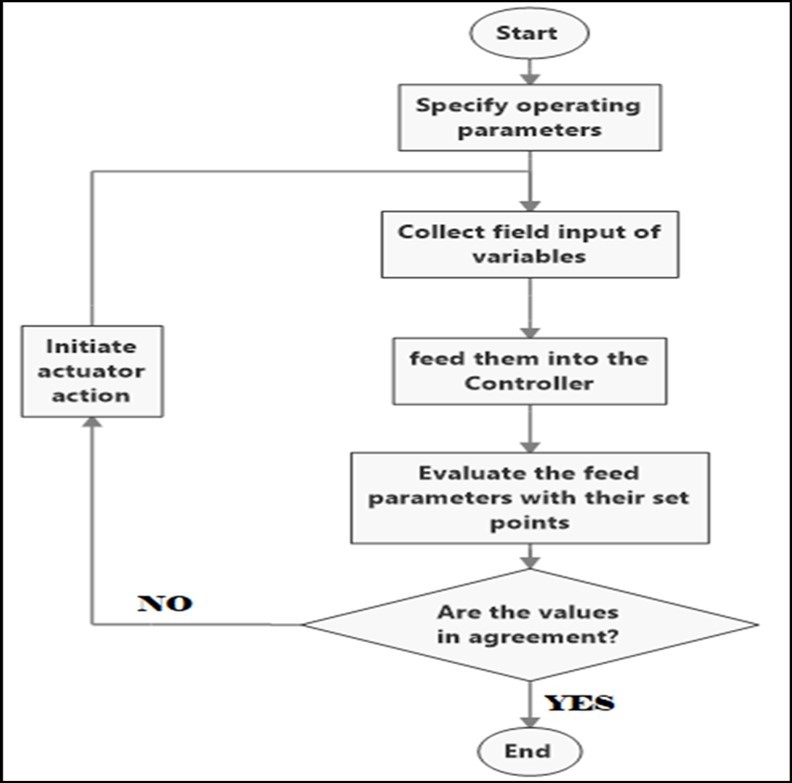
Download figure
Protection /Tripping Control Design
There are a number of gas turbine protection systems; several of them operate at normal start-up and shutdown while the others function strictly under emergency and abnormal operating conditions. The protection system of the simulator was set up to detect such a failure and sound an alarm when one occurs. The diagnostic algorithm monitors a predefined deadband for all analog inputs to each controller. If one of the analog inputs deviates from this deadband, a diagnostic alarm is activated to alert the operator. A condition serious enough to disable the protection completely would trip the turbine. The protection module, <P>, provides the protection for critical functions and contains three sets of identical cards, X, Y, and Z, each with its own processor. These are used to provide separate relay drivers for each of the <R>, <S>, and <T> controllers prior to their interfacing with the hydraulic trip solenoids. The extreme condition sensors such as overspeed, lube oil level Low/High and lube oil header temperature/pressure Low/High are connected to sections X, Y, and Z for emergency protection. There are two essentially independent paths; stopping fuel flow, comprising the Gas Control Valve (GCV) and the Speed/Stop Ratio Valve (SRV) as well as the air path (i.e. IGV). Each protective system is designed independently of the control system to avoid the possibility of a failure in the control system disabling the protective devices. Figure 13 is the information flow chart for the design algorithm.
Figure 13. Protection/tripping flow chart
Download figure
Fundamentals of the Control Programming
Gas turbine programs are control instructions written with any of the programming languages on a programming device and then downloaded by a direct-connection cable or over a network to the Controller. The program is stored in the Controller either in battery-back-up RAM or in some other non-volatile flash memory. Some components of the simulator program are as highlighted below.
Normally Open Contact
Normally open contacts are contacts which allow signal flow when the assigned bit in the process image input has value of 1, as shown in Figure 14.
Figure 14. Normally open contact
Download figure
Normally Closed contact
The normally closed contacts are contacts that will continue to allow signal flow through it when the assigned bit in the process image input has a value of 0, as shown in Figure 15.
Figure 15. Normally closed contact
Download figure
Output Coil
The output coil as shown in Figure 16is the component being energized from the result of the logic operation. It is activated when there is signal flow across the entire rung, to which it is connected,
Figure 16. Output coil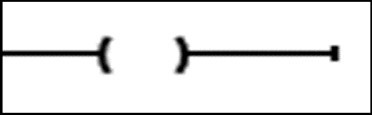
Download figure
Data Type and Addressing
In programming the simulator, every input and output device was given an address in the controller’s memory as well as in all the internal instructions such as the counters and timers. The address indicates where the variables and data can be located, with which the controller performs the control logics. These memory addresses have identifiers for easy location such as bit memory identifier (I) data type, output memory identifier (Q) data type, memory word identifier (MW) data type and double word identifier (MD) data type. It is vital in ensuring that these addresses were referenced in the control program during programming, using the memory identifiers listed below:
Boolean -e.g., 1 or 0
Byte-e.g. 8-bit data
Word (MW) in bytes-e.g., MW1 (two bytes)
Integer–e.g.(constant) numbers
Floating points integer–e.g. (constant) numbers with decimal points
Double word (MD)-32-bit data.
The programming of the simulator made use of the addresses of the input and output (I/O) points in
Figure 17 such that:
Figure 17. I/O addressing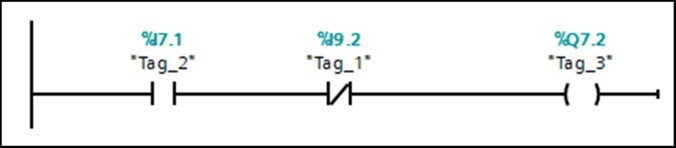
Download figure
I7.1 means, I is the input, 7 is the byte position and 1 is the bit position
I9.2 means, I is the input, 9 is the byte position and 2 is the bit position
Q7.2 means Q is the output, 7 is the byte position and 2 is the bit position
The processor starts its operation by scanning all the signal values connected to the input modules and loading them into the process image of input register or table. These user control programs are executed according to the control logics, referencing the corresponding bits addresses of the I/O points. The result of the logic operation values are then entered into the process image of output register. Through the load operation instruction, the processor transfers and updates the output modules as in Figure 18.
Figure 18. Data processing by the controller
Download figure
The “AND” Operation
This operation indicates that the signal states of I7.1 and I9.2 will each be 1 to activate output relay Q7.2 from
Figure 17 above.
The “OR” Operation
This operation indicates that the signal state of either I9.2 or I1.7 should be 1 to activate output relay Q7.2 as shown in Figure 19.
Figure 19. The "OR" operation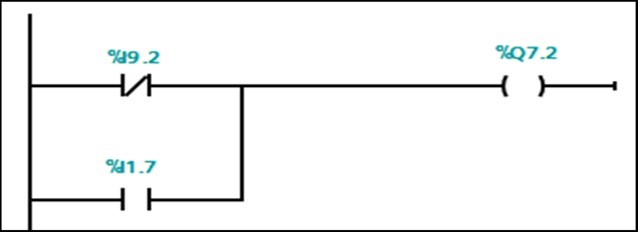
Download figure
The Binary Logic
The binary logic instruction has 1 or 0, true or false, on or off. The signal state of each binary logic element depends on whether it is activated or deactivated. The binary logic functions indicate contact closed or contact open usually called normally closed contact or normally open contact. During scanning as in Figure 18, the controller reads the physical contact position of the device in process image of input (PII), and relates it to the control program and performs control action. When the signal state I7.1 and signal state of I9.2 are 1, the output coil Q7.2 (Figure 17) will be activated. When any of the signal state of I9.2 or I1.7 is 1, the output coil Q7.2 (Figure 19) will be activated.
The Timers
In the control program logic of gas turbine operation, there may be need to delay an action before it comes up or goes off, even when the criteria to do so has been initiated. To achieve this, timers are employed. Timers are internal controller’s programming instructions that perform the same functions as the hardware timers. They were used at some points in the simulator development to activate or deactivate certain devices when the preset time is reached. The preset time is the number of ticks the timers must count before changing the state of the output. This is equal to the set time PT multiplied by the time base. The time base is in the range of 1s, 0.01s, 0.001s as the case may be. When timers are activated/deactivated, the accumulated value must be equal to the preset time or zero before the output turns on or off respectively. There are various types of timers employed, as shown in Figure 20. The On-delay timer (TON) is the timer that keeps an output off only for a specified (preset) time after the input signal state at IN has been turned on or has logic 1. The Off-delay timer (TOF) is the timer that keeps an output on for a specified time after the input signal state is turn off or has signal logic 0. The Retentive on-delay timer (TONR) is one that retains the accumulated time values even if the input goes to 0 and it normally needs a reset input.
Figure 20. Timers
Download figure
The Counters
The Counters are software program instructions that perform the same functions as in physical counting. They count the number of events or steps that occur when the enabling input has logic 1. Until the target number is reached, the output cannot turn on. Various types of counters, shown in Figure 21 were used to regulate certain actions in the simulator. While the Up-counter (CTU) increases the preset value by 1 whenever the signal state of the input connected to the CU changes from 0 to 1, the Down-counter (CTD) decreases the preset value by 1 whenever the signal state of the input connected to CD changes from 0 to 1. However, the two counters can be used at the same time to count up and count-down respectively. This is called the Up and Down Counter (CTUD). While the Up-counter counts from zero to a preset value, the Down-counter counts from the preset value to zero.
Figure 21. the counters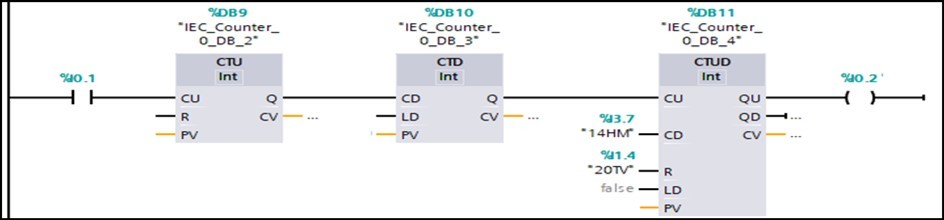
Download figure
The Mathematical Function
The simulator development has some mathematical functions like; addition, subtraction and compare control instructions.
For the addition;
EN = Enable input
IN1 = Number value for addition
IN 2 = second number for addition
OUT = Result of addition.
When the signal state of I0.2 is 1, the addition block is activated to add IN1 value to IN2 value and the result is put in the output memory address specified,
For subtraction, when the signal state of I0.3 is true, then the subtraction instruction is activated, IN1 – IN2. The value at IN1 is read in, as the first address and the value at IN2, as the second. The result of the mathematical operation is stored in the address of the output, as shown in Figure 22.
Figure 22. The mathematical functions
Download figure
The compare function compares the values stored in words memory location, IW1 and IW2 for an expression specified such as:
== IN1 is equal to IN2
> IN1 is greater than IN2
< IN1 is less than IN2
<= IN1 is less than or equal to IN2
>= IN1 is greater than or equal to IN2
<> IN1 is not equal to IN2
Results and Discussions
The formulated simulator was systematically exposed in visual form. It possesses the feature of a General Electric (GE) frame 9E gas turbine being controlled with Speedtronics Mark VI. Specific tasks in the operation of the Gas Turbine ere displayed and vital parameters, monitored.
The Shutdown/Idle State
Once the unit is not running, the starting means (which in this model, comprises; the cranking motor, the torque converter and the accessory gear box) are detached from the compressor through a flexible coupling and the cranking motor (88CR) is turned off, as shown in Figure 23. Since the unit is not running, there would be no combustion process in progress. Hence, there would be no supply of gas to the combustion chamber and no burning visualized in the chamber. At this time, the valves (Speed/Ratio valve –SRV and the Gas Control Valve –GCV) controlling the flow of fuel into the combustion chamber were found to be closed, signified by green colour as identified in Figure 24.
Figure 23. Position of the starting means at shutdown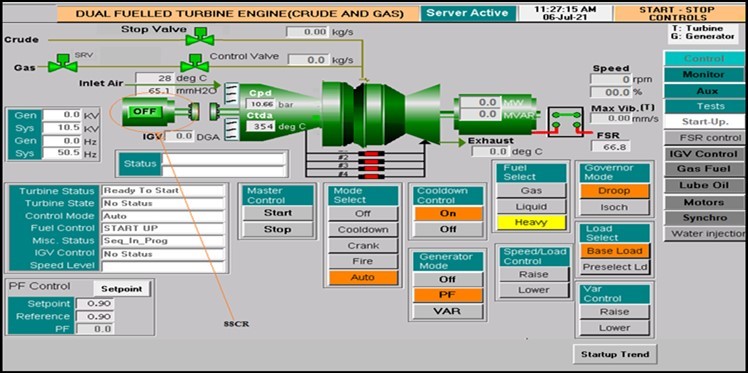
Download figure
Figure 24. Position of the fuel valves and the combustor at shutdown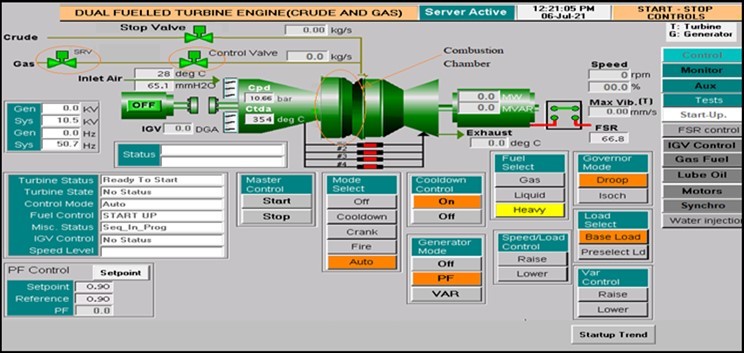
Download figure
The Startup Operation
On receiving the startup command, the cranking motor is turned on and the entire starting means connects with the compressor through the flexible coupling as shown in Figure 25. Then, operating parameters like the revolution per minute (rpm) and the percentage speed begin to change. When the firing stage is attained, the valves regulating the flow of fuel into the combustion chamber are opened and with the internal mechanism of firing obeyed, the unit fires with the visual position of the combustion chamber uttered, as shown in Figure 26.
Figure 25. Position of 88CR at startup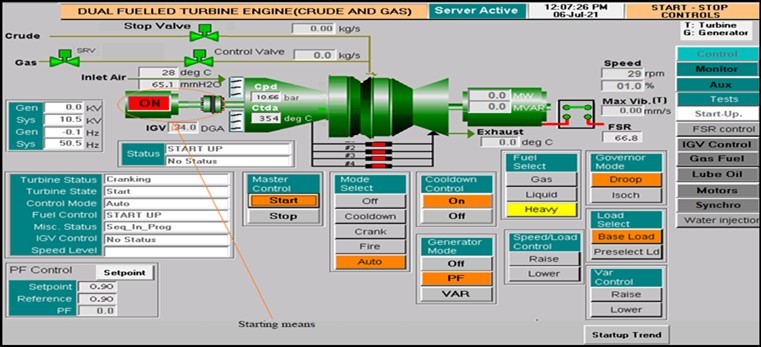
Download figure
Figure 26. Position of the fuel valves and the Combustor, at firing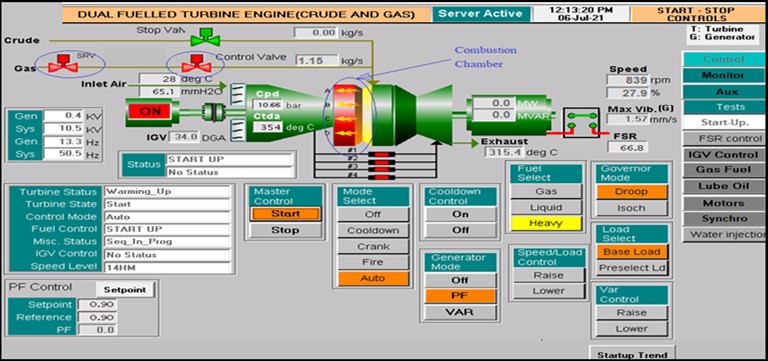
Download figure
Figure 27. Self-sustaining speed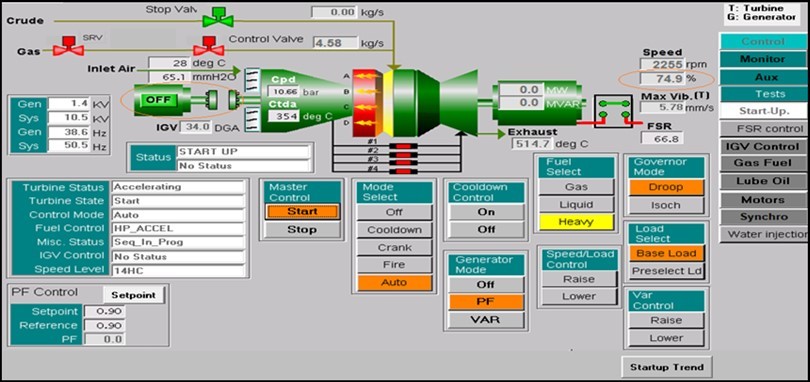
Download figure
Figure 28. FSNL
Download figure
As the fire is sustained, the speed of the shaft continues to increase due to increased torque from the starting means and the extraction of thermal energy from the flue gas (product of combustion between the air and gas) by the turbine blade and the onward conversion of this thermal energy into mechanical energy. At about 75% of the rated speed, the speed of the rotor is sufficient to sustain rotation without an external assistance (initially provided by the starting means). This is known as the self-sustaining speed. When this speed is attained, with the firing architecture sustained, the starting means disengages and the 88CR is turned off as shown in Figure 27. Other auxiliaries such as auxiliary lube oil and hydraulic oil pumps are equally taken out of service at this stage. For the single shaft, uniform speed GT being researched, the rated speed is 300RPM. At this rpm, the percentage speed is 100 as shown in Figure 28. This is known as full speed no load (FSNL).
The Synchronization Process
This refers to various degrees of coordination leading a system to operate in unison. For an electricity grid with interconnected generators, synchronization ensures that electricity delivery from various producers to the consumers is of same quality. Figure 29 and Figure 30 display the position of the unit before synchronization. At FSNL, the breaker connecting the generator to the grid is opened with the generator parameters (MW AND MVAR) being zero. During synchronization; the voltage, the frequency and the phase angle of the grid and the generator is continually monitored by the synchroscope and once found to be equal, the unit is synchronized with the breaker closed and the generator parameters, changing in line with the power being generated as shown in Figure 31 and Figure 32.
Figure 29. Position of the breaker and the generator at FSNL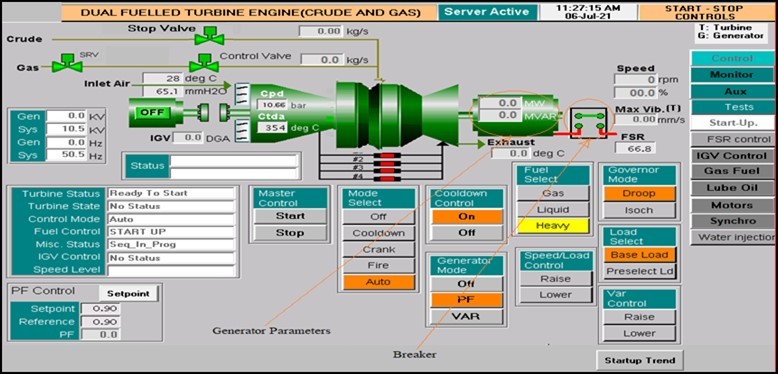
Download figure
Figure 30. Opened breaker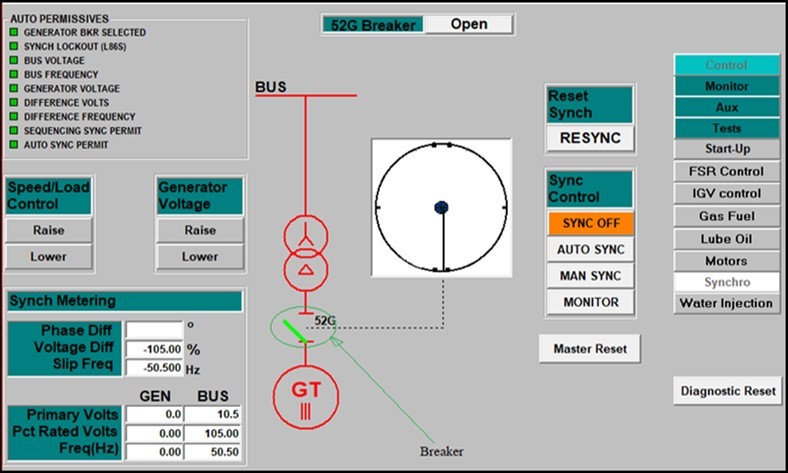
Download figure
Figure 31. Closed breaker
Download figure
Figure 32. Generator and Breaker, grid condition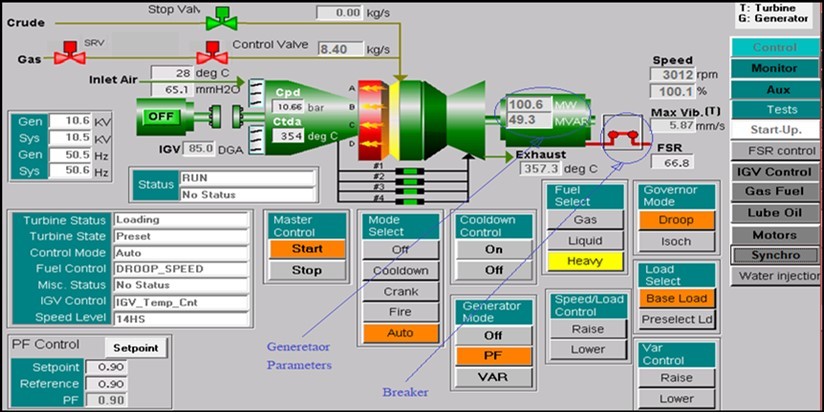
Download figure
Monitoring Process
The simulator provides a means of monitoring vital parameters of the gas turbine, such as vibration, temperature, pressure, and angle of the Inlet Guide Vane (IGV). An operator holds the performance monitoring of the GT, paramount in responsibility. The optimization of performance through vibration level monitoring and temperature regulation is made possible by the simulator.
Vibration Monitoring
simulator a view for tracking the level of vibratio of the GT at various times in the operation of the unit. Figure 33, Figure 34, Figure 35 show the view on the Human Machine Interface (HMI) pertaining to vibration monitoring. While on shutdown and during startup (prior to firing), the level of vibration is negligible as shown Figure 33. However, as the startup operation progresses and firing is established, the level of vibration begins to increase as seen in Figure 34. On reaching 25mm/s, a warning signal is given to the operator through an alarm. If no action is taken, the unit trips on vibration, on getting to 30mm/s. These two points of alarm and trip are indicated by yellow and red respectively in Figure 35
Figure 33. Bearing vibration at idle time
Download figure
Figure 34. vibration monitoring during operation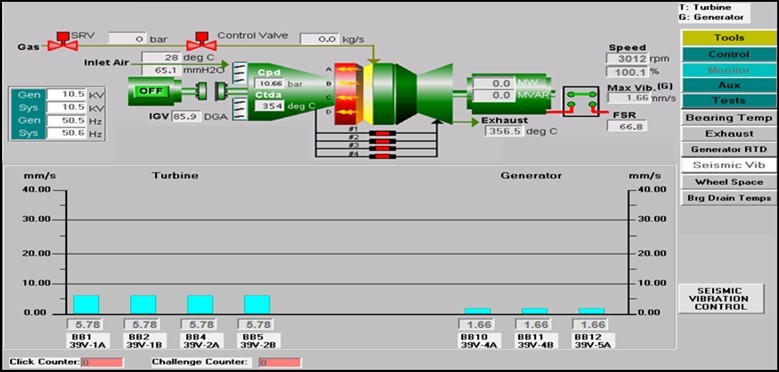
Download figure
Figure 35. Vibration Alarm and Trip display
Download figure
Temperature Monitoring and Control
In order to maintain operating temperatures of GT within design thermal stress limitations of the turbine parts, the fuel flow to the gas turbine is controlled. The highest temperature attained in the gas turbine occurs in the combustion chambers and inlet to the first stage turbine nozzle. This is known as Turbine Inlet Temperature (TIT). Since it is impractical to measure TIT directly, the temperature control system is designed to measure and control turbine exhaust temperature. Then, the indirect control of TIT is possible through known thermodynamic relationships, gas turbine cycle performance calculations, and site conditions. Figure 36 and Figure 37, show the HMI display of exhaust temperature. Prior to firing, the position of exhaust temperature screen is shown in Figure 36 whereas the rise in exhaust temperature, as the unit enters the firing phase is displayed in Figure 37. Similar to the vibration monitoring, the positions of alarm and trip functions are indicated by yellow and red marks respectively.
Figure 36. Exhaust gas temperature spread without firing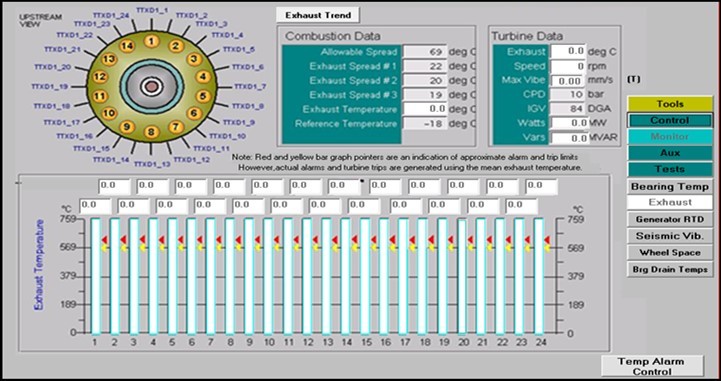
Download figure
Figure 37. Exhaust gas temperature spread at firing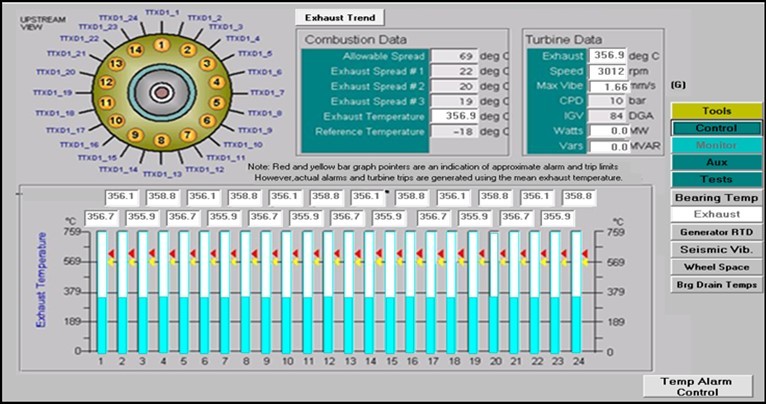
Download figure
Conclusion
Training a human to be adaptable under stress is elusive without the actual situation. Classroom instruction will never be able to fill the knowledge gap between school and reality. Simulation, on the other hand, can erase common mistakes and bring a student closer to the reality experience. It is not the physical verisimilitude that provides the immersive environment for the participant, but the cognitive realism afforded by complex and engaging tasks. The exposure to, and completion of the tasks (afforded by the simulation) develop the necessary knowledge and skills which are transferable to the “live” context.
The operation of the gas turbine was adequately performed in a virtual mode. The simulator was able to demonstrate specific tasks in the operation of the Gas Turbine which include; startup, synchronization and monitoring of vital parameters like vibration, temperature, pressure, and angle of the Inlet Guide Vane. The simulator was found to effectively mimic a real plant life and the operator has a limitless opportunity for trial and error in his operation leading to perfection, which is impracticable in real plant scenario.
Recommendation
It is imperative that operators in the Nigeria Electricity Supply Industry (NESI) be adequately trained to minimize human error in carrying out their responsibilities.
It is therefore recommended that the simulator be developed to a specific commercial scale through investment by gas turbine owners in NESI.
It is highly advised that all fresh entrants into the gas turbine industry as operators be made to undergo aggressive GT operation training with the simulator before they are exposed to the real plant
Other subsectors of the electricity industry have “operation” at their core. Having a simulator to demonstrate the various processes and to mimic the real scenarios, will not only enhance the capacity of the operators but will reduce the incessant outages being experienced in the country and extend components life.
References
- 2.E A Abhulimen, M U Bonet, S O Oyekunle, Achara N, W C Solomon. (2020) An Inquisition on the Combined Effects of Ambient Temperature and Relative Humidity on The Performance of a Uniform Speed Single Shaft Gas Turbine in Tropical Monsoon Climate. , using GPAL 5(6).
- 3.D A Patle, P R Gande. (2014) Operator training simulators in the chemical industry: Review, issues, and future directions, Reviews in Chemical Engineering. https://simulatelive.com Accessed
- 4.(2021).Pearl Street Station Engineering and Technology History. Wiki’. https://ethw.org/Pearl_Street_Station?gclid=Cj0KCQjw8vqGBhC_ARIsADMSd1BirPxfyiMcA1d3QSl3mWVQUdsce-I7Y_Dy54v91CpuDqqcx4DGdo0aAi-_EALw_wcB
- 5. (2021) Electricity generation -. Wikipedia’. https://en.wikipedia.org/wiki/Electricity_generation
- 6. (2021) Current Power Generation in. , Nigeria’. https://infoguidenigeria.com/current-power-generation-nigeria
- 7.Population ‘Nigeria. (2021) . Worldometer’. https://www.worldometers.info/world-population/nigeria-population/ (accessed 02.
- 9.Saravanamutoo. (2013) Gas Turbine Theory. Dorling Kindersley (India). , Pvt. Ltd., licensees of Pearson Education in South Asia