
Abstract
Colon cancer has a five-year survival of 64.7%, and about 50,000 people are expected to die from colon cancer this year. Patients with metastatic colorectal cancer have a significantly worse prognosis, a 12.9% five-year survival. This emphasizes the need for strategies to inhibit the growth and metastases of colorectal cancer. Prostate apoptosis response protein 4 (Par-4) is a pro-apoptotic protein that has been shown to mediate apoptosis in response to stimuli, such as chemotherapeutics and radiation. Recombinant Par-4 protein has been shown to reduce the occurrence of Lewis lung carcinoma metastases in-vivo; however, the mechanism by which Par-4 can inhibit metastasis has not been elucidated. In this study, human colon cancer cell lines - SW480 and SW620 - were transfected with Par-4 plasmid or anti-Par-4 shRNA, and the effect on metastasis was examined. Par-4 overexpression inhibited cell migration and invasion, while Par-4 knockdown promoted it. Moreover, the morphology of SW620 cells was altered when Par-4 levels were increased. The change was characteristic of a mesenchymal-to-epithelial transition (MET) in these cells. MET can be induced by upregulation of E-cadherin expression, and RT-PCR and Western blot analyses showed that E-cadherin mRNA and protein levels, respectively, were increased in the Par-4 overexpressing cells concomitant with a decrease in vimentin. The results of this study demonstrate the potential of Par-4 in colon cancer therapy, not only in primary tumors but also in metastatic cells.
Author Contributions
Academic Editor: Basem Azab, Staten Island university hospital
Checked for plagiarism: Yes
Review by: Single-blind
Copyright © 2015 Jeffrey Nguyen, et al.
 This is an open-access article distributed under the terms of the Creative Commons Attribution License, which permits unrestricted use, distribution, and reproduction in any medium, provided the original author and source are credited.
Competing interests
The authors have declared that no competing interests exist.
Citation:
Introduction
Although the 5-year survival rates of patients having early stages of colon cancer are higher than 60%, the 5-year survival rate of patients with metastatic colorectal cancer is only 12.9%1. Despite increases in length of survival with the combination of targeted agents, including anti-epidermal growth factor receptor and anti-vascular endothelial growth factor agents, with a 5-fluorouracil based regimen, patients with metastases are expected to survive for 2 years. This underscores the need for strategies to inhibit colorectal cancer metastases.
Prostate apoptosis response protein – 4 (Par-4) was first identified in prostate cancer cells that were induced to undergo cell death. Since the report of its identification, it has been shown to play a role in apoptosis in a cell-type-specific manner. Par-4 overexpression is sufficient to induce apoptosis in vitro and in vivo in a myriad of cancer cell types: breast cancer2, 3, androgen-independent and androgen-dependent prostate cancer cell line TRAMP, lung cancer, cervical cancer, nasopharyngeal cancer, and melanoma4. In other cell types - Jurkat T lymphocytes5, androgen-dependent prostate cancer cell line, LNCaP6, 7, melanoma cells8, and renal carcinoma - Par-4 increases susceptibility to pro-apoptotic stimuli, including UV irradiation, serum-withdrawal, ionizing radiation, doxorubicin, and camptothecin. In colon cancer cells, Par-4 overexpression increases apoptosis in response to the chemotherapeutic agent 5-fluorouracil9.
Par-4 activates both the extrinsic6 and intrinsic pathways of apoptosis5, 10, 11, 12, 13. Par-4 overexpression induces the mobilization of the death receptors Fas6, 14, DR 515, and the death ligand, FasL6, to the membrane. This results in the cleavage of caspase 86, 15. Par-4 overexpression downregulates the anti-apoptotic protein, Bcl-25, 10, 11, 12, 13, resulting in caspase-9 cleavage and engagement of the intrinsic pathway.
Par-4 not only induces cell death in cancer cells, but it may also inhibit their metastasis. This was suggested in a previous study, where mRNA and microRNA microarray analyses on Par-4 overexpressing HT-29 colorectal cancer cells showed that Par-4 altered the expression of genes involved in cell movement, including cell migration and invasion16. In addition, Par-4 induces the upregulation of 13 and downregulation of 9 microRNA’s. Among the predicted target mRNAs of these dysregulated microRNAs, a significant number are involved in the WNT/β-catenin pathway, a pathway that has been strongly implicated in colon cancer metastasis. In vivo, recombinant Par-4 protein inhibits the formation of lung nodules by mouse Lewis lung carcinoma cells in a tail vein metastasis model17. The goal of this study is to uncover the mechanisms by which Par-4 inhibits metastasis.
Materials and Methods
Cell Culture and Transfection
SW480 and SW620 colorectal cancer cells were maintained in RPMI + 10% fetal bovine serum (FBS) + 1% penicillin-streptomycin. The cells were transiently transfected with empty vector (mock), a plasmid vector encoding for human Par-4 (OriGene Technologies, Rockville, MD), or a plasmid vector encoding for anti-Par-4 shRNA (Thermo Scientific, Waltham, MA) using either Lipofectamine 2000 Transfection Reagent (Life Technologies, Grand Island, NY) or PolyJet DNA Transfection Reagent (SignaGen Laboratories, Rockville, MD), according the manufacturer’s instructions. Stable transfectants were isolated using geneticin selection 24 hours post-transfection.
Western Blot Analyses
Cells were washed twice with PBS and were lysed into lysis buffer (50mm HEPES,100 mm NaCl, 10 mm EDTA, 0.5 % NP40,10% glycerol, supplemented with 0.0001% Tween20, 0.1 mM PMSF, 0.1 mM NaVO4, 0.5 mM NaF, 5 μg/ml leupeptin, 0.1 mm DTT). Theproteins were quantified according to the BCA Assay (Thermo Scientific Inc., Rockford, IL) and loaded equally onto 10% SDS-polyacrylamide gels. Proteins were electrophoresed at 150 V and transferred to nitrocellulose membranes using a semi-dry blotter (BioRad, Hercules, CA). Membranes were blocked with 5% non-fat dry milk or 5% BSA for 1 h and incubated with primary antibody overnight. The blots were washed 3X in TBS with 0.1% Tween20 and incubated for 1 hr in appropriate HRP-conjugated secondary antibodies (Amersham, Piscataway, NJ). Blots were washed 3X and chemiluminescent detection was performed using Amersham ECL Prime Western Blotting Detection Reagent (Thermo Scientific Inc., Rockford, IL). The blots were either exposed to autoradiography film (GE Healthcare Life Sciences, Pittsburgh, PA) and scanned or imaged using the Molecular Imager Gel Doc XR System (Bio-Rad). Densitometric analyses were performed with NIH Image J software18. Primary antibodies used were: E-Cadherin, Claudin-1, Occludin, ZO-1, Vimentin (Cell Signaling, Danvers, MA), Par-4 (Santa Cruz Biotechnology, Santa Cruz, CA), and Actin (Sigma-Aldrich, Saint Louis, MO).
MTT Assay
SW620 cells were seeded at a density of 6 x 10³ cells/well in a 96-well culture plate. After 24 hours, the medium was replaced with medium containing different concentrations of 5-fluorouracil (5-FU). Forty-eight hours later, MTT reagent was added (Calbiochem) and the cells were incubated for 3.5 hrs at 37◦ C. After incubation, the media was aspirated off, crystals were dissolved in MTT solvent (4 mM HCl, 0.1% Nonidet P-40, in isopropanol), and viability was assessed by measuring the absorbance at 570 nm with 630 nm absorbance as the reference.
Scratch Assay
Mock, Par-4, and anti-Par-4 shRNA transfected cells were plated in either 6-well or 12-well plates and grown to confluence. A scratch was made with sterile pipette tip. The wells were washed with PBS and photomicrographs were collected under 200x magnification. The cells were incubated for 24 hours and the scratch areas were again photographed.
Boyden Chamber Assays
Matrigel-coated inserts (BD Biosciences) were prepared according to manufacturer’s instructions. The inserts were aseptically-transferred into 12 well culture plates containing medium with 10% FBS. Mock and Par-4 transfected SW620 cells were suspended in culture medium with 0.1% FBS and seeded into each insert. The cells were allowed to invade for 72 hours. After removing the culture medium and scrubbing the cells off of the inside of the insert, the cells on the underside of the insert were stained with 1% crystal violet in 50% methanol and counted under a microscope.
Cell culture inserts without matrigel were aseptically transferred into 24 well culture plates containing 10% FBS-RPMI. Mock, Par-4 and shRNA transfected SW480 cells (1x10⁵) were suspended in 1% FBS-RPMI and seeded into the inserts. The cells were allowed to migrate for 24 hrs. After removing the culture medium, cells were fixed with 4% paraformaldehyde, permeabilized with 100% methanol, and stained with 0.1% crystal violet in 50% methanol. After scrubbing off non-migrated cells from the inside of the insert with a cotton swab, the number of migrated cells on the outside of the insert was quantified at 100X magnification.
RT-PCR Analyses
RNA was isolated from mock and Par-4-transfected SW620 cells using RNeasy kit (Qiagen). cDNA was synthesized using a High Capacity cRNA reverse transcription kit (Applied Biosystems). Real-time quantitative PCR was performed using ABI Gene Expression Assay primers on the ABI7900 HT Sequence Detection System. Using the 2ΔΔCt analysis method with the ABI SDS2.2.2 software, relative amounts of target mRNA were quantitated using actin as an internal control.
Cell Proliferation Assay
SW480 and SW620 cells were seeded into a 12-well culture dish (1 x 10⁵ cells/well). At the appropriate timepoints, cells were trypsinized, and the number of viable cells was quantitated using a hemacytometer and trypan blue.
Statistical Analyses
The statistical analyses were carried out using GraphPad Prism software, version 6.04 (GraphPad Software, Inc., San Diego, CA, USA). Unpaired two-tailed t-tests are carried out in order to determine statistically significant differences between control and transfectants, unless otherwise noted. The threshold for significance is a P < 0.05. *P<0.05; **P<0.01; ***P<0.001.
Results
Par-4 Increases Susceptibility of Metastatic SW620 Cells to 5-FU
Par-4 expression was increased in the SW620 colorectal cancer cell line by stably transfecting cells with a plasmid vector encoding human Par-4 (Figure 1a and b). Figures 1a and 1b demonstrate increased Par-4 levels at the RNA and protein levels, respectively. The susceptibility of mock and Par-4 transfected SW620 cells to the chemotherapeutic agent 5-fluorouracil (5-FU) was assessed by performing MTT viability assays on treated cells. As can be seen in Figure 1c, both Par-4-overexpressing clones tested had lower viability in comparison to a mock-transfected clone when treated with 385 μM 5-FU for 48 hours.
Figure 1.Overexpression of Par-4 increases susceptibility of metastatic SW620 cells to 5-FU. SW620 colorectal cancer cells were transfected either with a plasmid vector containing a human Par-4 construct or an empty vector (mock). a) Par-4 mRNA expression was assessed in mock-(M) and Par-4-transfected (Pcl5 and Pcl7) cells by RT-PCR analysis. The bars in the graph reflect the fold upregulation of Par-4 mRNA expression in Par-4-transfected cells over the expression in mock-transfected cells. Data shown are means + SE of three biological replicates. b) Western blot analyses were performed to assess Par-4 protein expression in mock- and Par-4-transfected cells. The intensities of the Par-4 bands were normalized against the respective intensities of the bands for the loading control, actin, to calculate the -fold increase in expression. c) The susceptibility of mock- and Par-4 transfected SW620 cells to the chemotherapeutic agent 5-FU was assayed by MTT. Cells were treated with either the vehicle control (DMSO) or with the indicated concentrations of 5-FU for 48 hours. The bars in the graph reflect the absorbance readings of the 5-FU-treated cells normalized against those of the vehicle-treated cells. Data shown are means + SE of at least three biological replicates.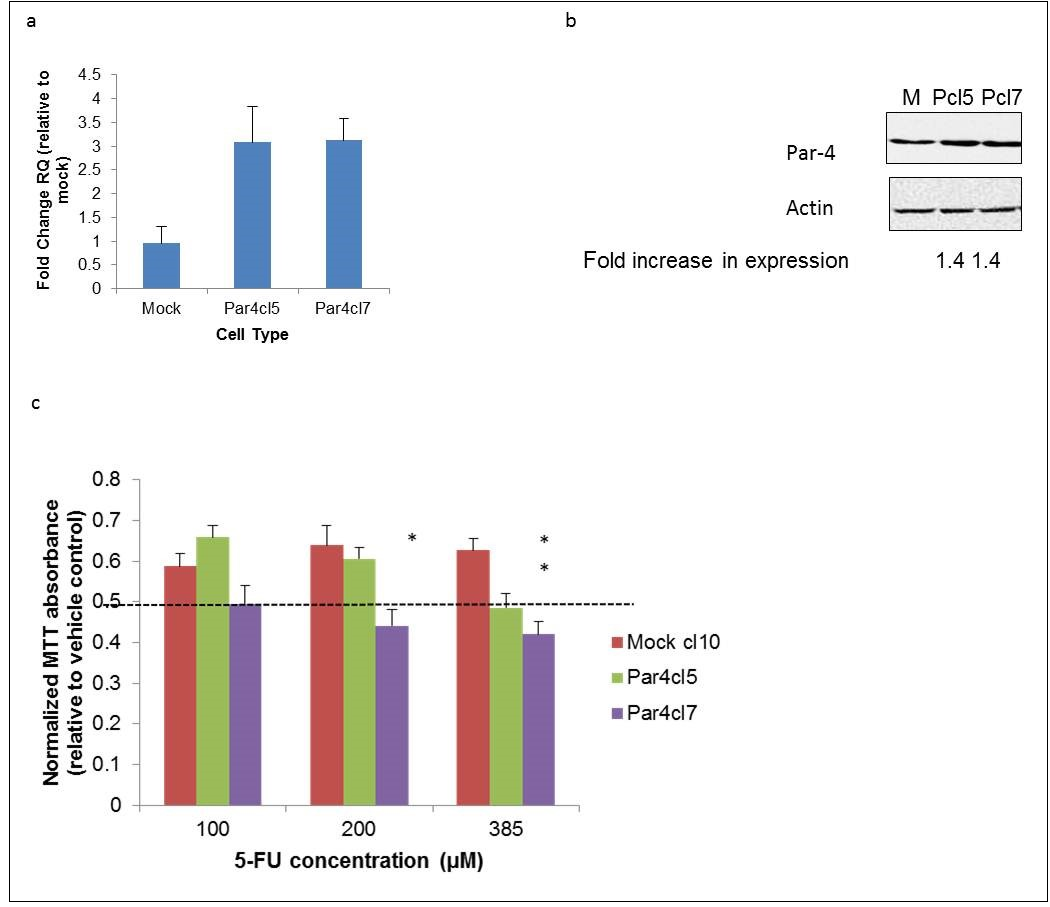
Par-4 inhibits cell migration and invasion in SW480 and SW620 cells
The effects of Par-4 overexpression on two key steps of metastasis, migration and invasion, were examined. We performed scratch assays on SW620 cells and quantified the number of cells that migrated into the area of the scratch after 24 hours to examine migration. Fewer Par-4 overexpressing cells than mock-transfected cells migrated into the scratch area (Figure 2a and b). The scratch assay showed that Par-4 overexpression inhibited the migratory ability of SW620 cells. The invasive ability of mock- and Par-4-transfected SW620 cells was assessed in a Matrigel assay. As can be seen in Figure 2c, fewer Par-4 overexpressing cells were able to invade through the Matrigel than mock transfected cells. It is possible that more of the mock-transfected cells appeared to invade through the Matrigel, because increased Par-4 expression reduced cell proliferation. To assess this, we monitored the cell growth of mock- and Par-4 transfected SW620 cells (Figure 2d). No significant differences in cell proliferation were observed as a result of increased Par-4 expression.
Figure 2.Par-4 overexpression inhibits metastatic processes in SW620 cells. a) Scratch assays were performed to compare the ability of mock- and Par-4 transfected cells to migrate in 24 hours. The lines are drawn to indicate the boundaries of the scratch made at the 0 hour timepoint. b) The number of cells that migrated into the scratch area after 24 hours were graphed. Data shown are means + SE of at least two biological replicates and a total of six scratch areas were imaged. c) Mock- and Par-4 transfected cells were cultured in low-serum (0.1%) media in Matrigel-coated inserts to assess invasive capability. The bars in the graphs reflect the number of cells that invaded through the insert after 72 hours. Data shown are means + SE of at least 5 biological replicates. d) Cell proliferation was assessed by counting viable cells in trypan blue assays. Data shown are means ± SE of at least two replicates.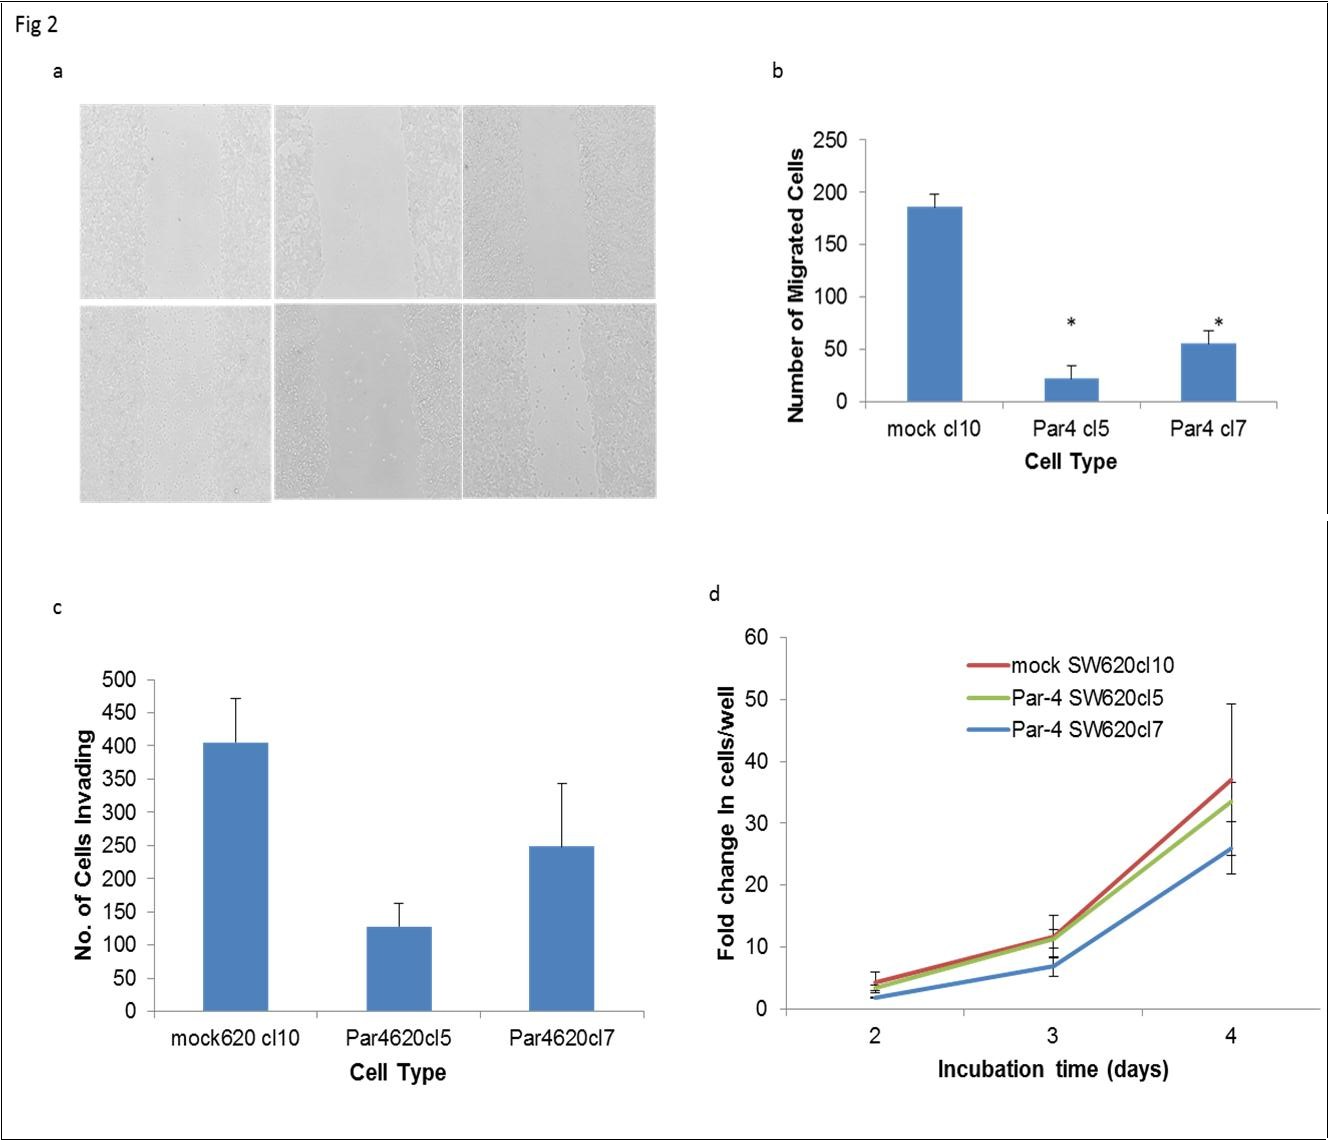
To extend our observations beyond a single cell line, SW480 cells were transiently transfected with either control or anti-Par-4 shRNA, and scratch assays were performed to assess migratory ability. Consistent with the inhibitory effect of Par-4 on migration in SW620 cells, Par-4 knock-down in SW480 cells enhanced migration as evidenced by complete closure of the scratch relative to the control transfected cells (Figure 3a). To validate this observation, SW480 cells were transiently transfected with control plasmid, Par-4 expression plasmid, or anti-Par-4 shRNA, then seeded into a Boyden chamber, and the number of cells that migrated across the boyden chamber after 24 hrs were quantified (Figure 3b). As can be seen in Figure 3b, Par-4 overexpression inhibited migration, whereas knock-down of Par-4 enhanced migration across the boyden chamber. Western blots confirming overexpression and knock-down of Par-4 are also shown in Figure 3b. Cell proliferation assays were performed to compare the growth of Par-4 and control transfected SW480 cells. Although there is a statistically significant difference in proliferation by day 3 post-transfection, the 24-hour time point of the Boyden chamber assay corresponds to day 1 post-transfection; therefore, differences in proliferation cannot account for the inhibition of migration seen in Par-4 transfected SW480 cells in Figure 3b.
Figure 3.Par-4 inhibits migration in SW480 cells. a) Scratch assays were performed to compare the ability of mock- and anti-Par-4 shRNA-transfected cells to migrate in 24 hours. A representative image of the scratch at the 0 and 24 hour timepoint is shown. b) SW480 cells that were transiently transfected with either Par-4 expression plasmid, anti-Par-4 shRNA (A11, A12, B1, and B2), or empty vector were cultured in media with 1% FBS in the inner chamber of a Boyden chamber, while media with 10% FBS in the lower chamber acted as a chemoattractant. Cells are allowed to migrate for 24 hrs, then the number of migrated cells were quantitated (# cells/high-powered field). Data shown are the means ± SE of five random fields. Western blots confirming the overexpression and knock-down of Par-4 levels are also shown. c) Cell proliferation was assessed by counting viable cells in trypan blue assays. Data shown are means ± SE of at least two replicates.
Par-4 Induces a Mesenchymal-to-epithelial Transition in SW620 Cells
Given the novel observations that Par-4 inhibits migration and invasion of metastatic colon cancer cells, the mechanisms behind these effects were investigated. Par-4 overexpression
altered the morphology of SW620 cells (Figure 4a). This is significant, since the SW620 cell line is one that was derived from a metastatic site, a lymph node, from a patient with colorectal cancer. Both mock-transfected clones exhibited a mixture of round cells and elongated cells with minimal cell-to-cell contacts. However, with Par-4 overexpression, the cells demonstrate more cell-to-cell contacts. It is proposed that a cancer cell that has gained the ability to metastasize undergoes a phenotypic change in a process referred to as epithelial-to-mesenchymal transition (EMT). One characteristic of this change is a morphologic change where the epithelial cell loses cell-to-cell contacts and becomes more elongated. Thus, the morphologic changes observed in the SW620 cell line are suggestive of an EMT reversal, namely a mesenchymal-to-epithelial transition (MET).
Another hallmark of EMT is the loss of the epithelial protein, E-cadherin, concomitant with the gain of the mesenchymal marker, vimentin. Thus, the levels of E-cadherin and vimentin were examined. Western blot analyses showed that E-cadherin protein expression was increased in the Par-4 overexpressing cells, while vimentin levels were reduced (Figure 4b). Par-4 overexpression in SW480 cells also increased the expression of E-cadherin (Figure 4c). These data further support the observation of an MET phenotypic change.
Figure 4.Par-4 induces a mesenchymal-epithelial transition in SW620 cells. a) Phase-contrast microscope images of mock and Par-4-transfected SW620 cells were collected, and b) lysates were processed for Western blot analyses of E-cadherin, the mesenchymal marker, vimentin, and actin. c) SW480 cells were transfected with Par-4 and western blot analyses were performed for Par-4, E-cadherin, and actin.
Par-4 Regulates Tight-junction Protein Expression in SW620 Cells
E-cadherin protein expression can be altered by different mechanisms, including transcriptional, post-transcriptional, and epigenetic. To determine whether Par-4 increases E-cadherin mRNA expression, RT-PCR analyses were performed on mock and Par-4 transfected SW620 cells. As can be seen in Figure 5a, E-cadherin mRNA levels were increased in the Par-4 overexpressing SW620 clones. Western blot analyses were performed to identify other tight-junction proteins that may be altered in response to Par-4 overexpression. Claudin, occludin, and ZO-1 were all found to be upregulated by Par-4 (Figure 5b).
Figure 5.Par-4 induces E-cadherin transcription and tight-junction protein upregulation. a) RT-PCR analyses for E-cadherin mRNA expression in mock and Par-4-transfected cells were performed. The bars in the graph reflect the fold upregulation of E-cadherin mRNA expression in Par-4-transfected cells over the expression in mock-transfected cells. Data shown are means + SE of three biological replicates. b) Western blot analyses for tight junction proteins, claudin 1, occludin, ZO-1, and actin were performed.
Discussion
The potential of Par-4 in cancer therapy has been increasingly appreciated given its ability to induce cell death by itself or in combination with chemotherapeutics and radiation 19. In this study, we have shown that SW620 cells are sensitized to 5-FU upon ectopic Par-4 expression. This sensitization corroborates our prior findings in HT-29 cells in response to 5-FU and ISC-4 treatment, respectively9, 16, 20, 21. Although it has been shown that recombinant Par-4 can inhibit metastasis17, the mechanisms behind this effect have been scarcely elucidated. Furthermore, ectopic Par-4 expression in HT-29 cells was shown to deregulate mRNA’s and microRNA’s involved in cell migration and motility16. Specifically, several target genes of these deregulated miRNA’s are part of the Wnt/β-catenin and PI3K/Akt pathways, both of which have been implicated in colon cancer progression and metastasis22, 23. We have shown in this study that Par-4 can inhibit the ability of colon cancer cell lines, SW480 and SW620, to migrate and invade.
The ability of SW620 cells to migrate and invade was reduced with increased expression of Par-4. Moreover, the ability to SW480 cells to migrate was also inhibited by Par-4 overexpression, while downregulation of Par-4 resulted in increased migration. One of the mechanisms behind this reduction in migration and invasion may be the Par-4-induced upregulation of E-cadherin. Increased expression of E-cadherin in mammary and prostate epithelial carcinoma cells has been shown to inhibit migration and invasion 24, 25. Small molecules that can restore E-cadherin expression in SW620 cells have been shown to reduce invasion 26. The ability of E-cadherin to inhibit cell migration and invasion has been shown to be independent of its role in mediating cell-cell adhesions, and instead is due to its role in downregulating the β-catenin/TCF pathway 25. E-cadherin sequesters β- catenin, keeping β- catenin from interacting with actinin-4. On the other hand, in the absence of E-cadherin or when E-cadherin is downregulated, β- catenin has been found to colocalize with actinin-4 in bleb-like membrane protrusions in colorectal cancer cells 27. Overexpression of actinin-4 has been shown to increase motility of colorectal cancer cells 28. The mechanism underlying the β-catenin/actinin-4 complex-induced migration remains to be elucidated. Another mechanism by which E-cadherin can inhibit migration and invasion is due to downregulation of hNanos1. Overexpression of hNanos1 is sufficient to induce invasion in collagen type I gels and increase migration 29. This may be due in part to the hNanos1-induced expression of the matrix metalloproteinase MT1-MMP (membrane type1-matrix metalloproteinase) 30.
The loss or heterogenous expression of E-cadherin in colorectal cancer tissue samples has been correlated to an advanced clinical stage and liver metastasis 31. This makes the upregulation of E-cadherin induced by Par-4 overexpression in SW480 and SW620 cells a significant finding. E-cadherin expression is regulated via different mechanisms 32. Although the CpG island on the E-cadherin promoter is methylated in a number of cancers 33, including colorectal cancer 34, 35, this may not be the dominant mechanism of E-cadherin downregulation in colorectal cancer 36. E-cadherin expression is also inhibited by a number of transcriptional repressors, including members of the ZEB and basic helix-loop-helix (bHLH) families 37. In this study, we reported the transcriptional upregulation of E-cadherin as a result of Par-4 overexpression. In addition, the expression levels of other tight junction proteins – claudin-1, occludin, and ZO-1 – were upregulated. The mechanisms by which Par-4 regulates the expression of these genes is an area for further study.
Increasing Par-4 levels in SW620 cells was sufficient to alter the cell morphology from a rounded phenotype with minimal cell-to-cell contacts to one with many cell-to-cell contacts, which is characteristic of epithelial cells. Par-4-overexpressing cells had a decreased expression of mesenchymal markers, such as vimentin, and upregulation of the epithelial cell protein, E-cadherin. This is significant, because it suggests an MET transition, the opposite of the epithelial-to-mesenchymal transition (EMT) that primary tumor cells must undergo in order to metastasize. In colorectal cancer, EMT has been observed in cells at the invasive front of primary tumors and lymph node metastases 38. Characteristics of cells undergoing EMT include the decreased expression of epithelial markers, in particular E-cadherin, and upregulation of mesenchymal markers, like vimentin. A further indication of EMT is the increased nuclear localization of β-catenin. In this study, we report that by increasing the levels of Par-4 in the metastatic cell line, SW620, MET was induced, which is significant in that it helps to resolve a discrepancy in the literature regarding the regulation of EMT by Par-4. In a study by Tan et. al., Par-4 downregulation was shown to induce EMT in the cell line, BxPc-3, concomitant with the acquisition of cisplatin resistance39; however, in a more recent study, Par-4 was shown to mediate TGF-β-induced EMT40. In that study, TGF-β induced EMT resulted in a Smad-dependent Par-4 upregulation, which in turn downregulated epithelial markers and upregulated mesenchymal markers with a concomitant increase in cell motility in several different cell lines. Overexpression and knockdown of Par-4 showed that these phenotypic changes were mediated by Par-440. Thus, our results corroborate the data by Tan et. al. and contradict the data by Chaudhry et. al. A potential explanation for this discrepancy is that Par-4 regulates EMT in a cell-type dependent manner. In the study by Tan et. al., the studies were carried out in a pancreatic cancer cell line39, whereas in the study by Chaudhry et. al., endometrial, cervical, ovarian, and breast cancer cell lines were used40. Our study was carried out in colon cancer cell lines. The exact, cell-specific mechanisms by which Par-4 regulates EMT remain to be elucidated. Taken together, in this study, the increased cell-to-cell contacts due to the increased expression of tight junction proteins along with the EMT reversal help to explain the observed inhibitory effect of Par-4 on the migration and invasion of colon cancer cells.
In summary, our data show that Par-4 inhibits the migration and invasion of SW480 and SW620 colon cancer cells, and the upregulation of epithelial markers and downregulation of mesenchymal markers concomitant with a mesenchymal-to-epithelial transition can partially explain the observed phenotype. These findings provide an additional impetus to explore the use of Par-4 in colon cancer therapy. A potential limitation of this study is that the migration and invasion experiments were entirely in-vitro. Future experiments in in-vivo models, such as a tail-vein injection model, would help to address this limitation. Additional future experiments should also examine the effect of Par-4 on migration and invasion in other types of cancer and further elucidate the cell-specific mechanisms by which Par-4 regulates migration.
Acknowledgements
This work was supported by Penn State Hershey start-up funds of Rosalyn B. Irby.
References
- 2.Gurumurthy S. (2005) Phosphorylation of Par-4 by protein kinase A is critical for apoptosis. , Mol Cell Biol 25(3), 1146-61.
- 3.Zhao Y. (2007) Cancer resistance in transgenic mice expressing the SAC module of. Par-4 Cancer Res 67(19), 9276-85.
- 5.Boehrer S. (2002) In lymphatic cells par-4 sensitizes to apoptosis by down-regulating bcl-2 and promoting disruption of mitochondrial membrane potential and caspase activation Cancer Res. 62(6), 1768-75.
- 6.Chakraborty M. (2001) Par-4 drives trafficking and activation of Fas and Fasl to induce prostate cancer cell apoptosis and tumor regression Cancer Res. 61(19), 7255-63.
- 7.Goswami A. (2005) Binding and phosphorylation of par-4 by akt is essential for cancer cell survival Mol Cell. 20(1), 33-44.
- 8.Sells S F. (1997) Expression and function of the leucine zipper protein. Par-4 in apoptosis Mol Cell Biol 17(7), 3823-32.
- 9.C L Kline. (2009) Delivery of PAR-4 plasmid in vivo via nanoliposomes sensitizes colon tumor cells subcutaneously implanted into nude mice to 5-FU Cancer Biol Ther. 8(19), 1831-7.
- 10.Camandola S, Mattson M P. (2000) Pro-apoptotic action of PAR-4 involves inhibition of NF-kappaB activity and suppression of BCL-2. , expression J Neurosci Res 61(2), 134-9.
- 11.S K Cheema. (2003) . Par-4 transcriptionally regulates Bcl-2 through a WT1-binding site on the bcl-2 promoter J Biol Chem 278(22), 19995-20005.
- 12.Chendil D. (2002) Par-4, a pro-apoptotic gene, inhibits radiation-induced NF kappa B activity and Bcl-2 expression leading to induction of radiosensitivity in human prostate cancer cells PC-3 Cancer Biol Ther. 1(2), 152-60.
- 13.Qiu G. (1999) Mutually exclusive expression patterns of. Bcl-2 and Par-4 in human prostate tumors consistent with down-regulation of Bcl-2 by Par-4 Oncogene 18(3), 623-31.
- 14.Bergmann M. (2004) Prostate apoptosis response gene-4 sensitizes neoplastic lymphocytes to CD95-induced apoptosis Ann Hematol. 83(10), 646-53.
- 15.T J Lee. (2010) Overexpression of Par-4 sensitizes TRAIL-induced apoptosis via inactivation of NF-kappaB and Akt signaling pathways in renal cancer cells. , J Cell Biochem 109(5), 885-95.
- 16.B D Wang. (2010) Prostate apoptosis response protein 4 sensitizes human colon cancer cells to chemotherapeutic 5-FU through mediation of an NF kappaB and microRNA network Mol Cancer. 9, 98.
- 17.Zhao Y. (2011) . Systemic Par-4 inhibits non-autochthonous tumor growth Cancer Biol Ther 12(2), 152-7.
- 18.C A Schneider, W S Rasband, K W Eliceiri. (2012) NIH Image to ImageJ: 25 years of image analysis. , Nat Methods 9(7), 671-5.
- 19.R B Irby, C L Kline. (2013) Par-4 as a potential target for cancer therapy Expert Opin Ther Targets. 17(1), 77-87.
- 20.C L Kline, R B Irby. (2011) The pro-apoptotic protein Prostate Apoptosis Response Protein-4 (Par-4) can be activated in colon cancer cells by treatment with Src inhibitor and 5-FU Apoptosis. 16(12), 1285-94.
- 21.A K Sharma. (2011) The Akt inhibitor ISC-4 activates prostate apoptosis response protein-4 and reduces colon tumor growth in a nude mouse model Clin Cancer Res. 17(13), 4474-83.
- 22.S M Johnson. (2010) Novel expression patterns of PI3K/Akt/mTOR signaling pathway components in colorectal cancer. , J Am Coll Surg.210(5),p.767-76 776-8.
- 23.S P Tenbaum. (2012) beta-catenin confers resistance to PI3K and AKT inhibitors and subverts FOXO3a to promote metastasis in colon cancer. , Nat Med 18(6), 892-901.
- 24.Mao Q. (2010) Suppression of migration and invasion of PC3 prostate cancer cell line via activating E-cadherin expression by small activating. , RNA Cancer Invest 28(10), 1013-8.
- 25.A S Wong, B M Gumbiner. (2003) Adhesion-independent mechanism for suppression of tumor cell invasion by. , E-cadherin J Cell Biol 161(6), 1191-203.
- 26.Stoops S L. (2011) Identification and optimization of small molecules that restore E-cadherin expression and reduce invasion in colorectal carcinoma cells. , ACS Chem Biol 6(5), 452-65.
- 27.Hayashida Y. (2005) E-cadherin regulates the association between beta-catenin and actinin-4. , Cancer Res 65(19), 8836-45.
- 28.Honda K. (2005) Actinin-4 increases cell motility and promotes lymph node metastasis of colorectal cancer Gastroenterology. 128(1), 51-62.
- 29.Strumane K. (2006) E-cadherin regulates human Nanos1, which interacts with p120ctn and induces tumor cell migration and invasion Cancer Res. 66(20), 10007-15.
- 30.Bonnomet A. (2008) The E-cadherin-repressed hNanos1 gene induces tumor cell invasion by upregulating MT1-MMP expression Oncogene. 27(26), 3692-9.
- 31.Mohri Y. (1997) Prognostic significance of E-cadherin expression in human colorectal cancer tissue Surg Today. 27(7), 606-12.
- 32.Berx G, F van Roy. (2009) Involvement of members of the cadherin superfamily in cancer Cold Spring Harb Perspect Biol.1(6),p.a003129.
- 33.P G Corn. (2001) Frequent hypermethylation of the 5' CpG island of E-cadherin in esophageal adenocarcinoma Clin Cancer Res. 7(9), 2765-9.
- 34.Darwanto A. (2003) MeCP2 and promoter methylation cooperatively regulate E-cadherin gene expression in colorectal carcinoma Cancer Sci. 94(5), 442-7.
- 35.J M Wheeler. (2001) Hypermethylation of the promoter region of the E-cadherin gene (CDH1) in sporadic and ulcerative colitis associated colorectal cancer Gut. 48(3), 367-71.
- 36.Liu Y. (2008) Modest promoter methylation of E-cadherin gene in sporadic colorectal cancers: a quantitative analysis Cancer Biomark. 4(2), 111-20.
- 37.Peinado H, Olmeda D, Cano A. (2007) Snail, Zeb and bHLH factors in tumour progression: an alliance against the epithelial phenotype?. , Nat Rev Cancer 7(6), 415-28.
- 38.Brabletz T. (2001) Variable beta-catenin expression in colorectal cancers indicates tumor progression driven by the tumor environment. Proc Natl Acad Sci U S A 98(18), 10356-61.
Cited by (2)
- 1.Irby Rosalyn B., Kline Christina Leah B., Sharma Arun K., 2021, , , (), 59, 10.1007/978-3-030-80558-6_4
- 2.Ganguly Saptadwipa, Burikhanov Ravshan, Qiu Shirley, Rangnekar Vivek M., 2022, , , (), 1, 10.1007/978-3-030-73572-2_1