
Technical Evaluation of Automated Left Ventricular Quantification in Cardiac Magnetic Resonance Imaging: Comparison with Manual Reference Measurements

Abstract
Background
Automated left ventricular (LV) quantification may reduce the manual post-processing burden of cardiac magnetic resonance (CMR) imaging but requires evaluation against manual reference measurements before routine clinical use.
Purpose
To evaluate automated CMR post-processing for LV quantification against manual reference measurements and to compare its performance with Inline scanner-derived measurements.
Methods
CMR examinations from 178 patients at a single tertiary referral center were retrospectively evaluated. Ejection fraction (EF), end-diastolic volume (EDV), end-systolic volume (ESV), stroke volume (SV) and myocardial mass obtained with automated syngo.via post-processing and Inline scanner analysis were compared with manual expert measurements using intraclass correlation coefficients (ICC), Bland–Altman analysis, root mean square error (RMSE) and mean absolute percentage error (MAPE).
Results
Automated post-processing showed excellent agreement with manual measurements for all five parameters (ICC 0.957–1.000; MAPE 0.72–3.21%). Bland–Altman mean biases were small: −0.83 percentage points for EF, 0.74 mL for EDV, −1.43 mL for ESV, −1.45 mL for SV and −1.03 g for myocardial mass, although ESV showed wider limits of agreement. Inline measurements showed greater disagreement with the manual reference, including an EF bias of +4.22 percentage points and moderate ICCs for SV (0.733), EDV (0.673) and ESV (0.619), with consistently higher RMSE and MAPE.
Conclusions
Automated CMR post-processing agreed closely with manual reference measurements and showed lower measurement error than Inline scanner-derived measurements, supporting its use to aid routine LV quantification with expert review where segmentation is uncertain. Further multicenter evaluation across scanners and patient populations is warranted.
Article Information
- Received
- Accepted
- Published
Academic Editor: Ian James Martins, Principal Research Fellow, Edith Cowan University
Checked for plagiarism: Yes
Review by: Single-blind
Copyright © 2026 Suha Faleh Alharbi, et al.
 This is an open-access article distributed under the terms of the Creative Commons Attribution License, which permits unrestricted use, distribution, and reproduction in any medium, provided the original author and source are credited.
Corresponding author: Suha Faleh Alharbi, Medical Physics Department, King Abdullah Medical City Specialist Hospital, Muzdalifah Road, Al Mashair District, Makkah 24246, Saudi Arabia —
Competing Interests
The authors declare that they have no known competing financial interests or personal relationships that could have appeared to influence the work reported in this paper. Although this study evaluates commercially available platforms (Siemens syngo.via and Inline scanner outputs), the authors have no financial interest, sponsorship, or licensing agreements with Siemens Healthineers.
Funding
This research received no specific grant from any funding agency in the public, commercial, or not-for-profit sectors.
Data Availability
No data-availability statement was provided by the authors.
Acknowledgements
No artificial intelligence (AI) or large language model (LLM) tools or applications were used in the preparation, analysis, writing, or editing of this manuscript.
Citation:
Introduction
Cardiac magnetic resonance (CMR) imaging is the non-invasive reference standard for measurement of left ventricular (LV) volumes, LV ejection fraction (LVEF), and myocardial mass.1,2 However, manual endocardial and epicardial contouring is labour-intensive and time-consuming, and presents inter-observer variability, potentially causing disruption in clinical workflow and delaying clinical decision making.3 Although specific software packages have been individually validated to meet manual reference standards, there is a dearth of knowledge about comprehensive user-to-user analysis and comparison of commercial software platforms based on real-world clinical datasets. This paper addresses this gap by comparing automated cardiac MRI analysis using a post-processing workstation,4 and Inline CMR measurements derived directly from the scanner, against the manual reference standard for LV quantification. We hypothesised that automated post-processing would show closer agreement with, and lower measurement error relative to, manual reference measurements than Inline scanner-derived measurements.
Methods
Study Design and Population
A retrospective observational design was employed for this study; the study included 178 cardiovascular patients who underwent cardiac magnetic resonance (CMR) imaging between January 2025 and January 2026 at King Abdullah Medical City Specialist Hospital, a single tertiary referral center. Cases were retrospectively retrieved from the cardiology department database and the Picture Archiving and Communication System (PACS).5 Patients with complete CMR imaging datasets and available automated left ventricular (LV) measurements were included in the analysis.
Data collection was performed retrospectively and included CMR image datasets and measurements obtained using the Siemens syngo.via post-processing system and Inline CMR analysis. Manual measurements obtained by radiologists and cardiologists using standard volumetric contouring techniques served as reference measurements. During the study period, no changes were made to the clinical imaging protocols, patient management pathways or acquisition procedures. Given that all data acquired were retrospective, there was no effect on image acquisition or clinical decision making. This retrospective observational study was approved by the Institutional Review Board (IRB) / Research Ethics Committee of King Abdullah Medical City Specialist Hospital (approval no. 25-1408, May 2025). Because the study utilized fully anonymized, historically archived data retrieved retrospectively from the Picture Archiving and Communication System (PACS) between January 2025 and January 2026, the requirement for active informed patient consent was waived. Patient confidentiality and data privacy were strictly maintained throughout the study in accordance with institutional guidelines.
Cardiac Parameters
The five left ventricular variables considered in this study were Ejection Fraction (EF), End-Diastolic Volume (EDV), End-Systolic Volume (ESV), Stroke Volume (SV), and Myocardial Mass. Left Ventricular Ejection Fraction (LVEF) was calculated using the volumetric equation:
LVEF (%) = [(LVEDV − LVESV) / LVEDV] × 100 (1)
LVEDV represents the left ventricular end-diastolic volume and LVESV represents the left ventricular end-systolic volume.
Alternatively, LVEF represents the proportion of blood ejected from the left ventricle during a single cardiac cycle and is calculated using Stroke Volume (SV) as follows.6
LVEF (%) = [LVSV / LVEDV] × 100 (2)
where LVSV = LVEDV − LVESV is the left ventricular stroke volume, i.e., the amount of blood that is ejected per heartbeat; and the mass of the left ventricular myocardium, which is derived from the volumetric analysis, is known as Myocardial Mass (g).7
Statistical Analysis
Descriptive statistics were calculated for the five LV parameters obtained using the three measurement methods. Agreement was assessed using the intraclass correlation coefficient (ICC) and Bland–Altman analysis; while measurement error was evaluated using root mean square error (RMSE) and mean absolute percentage error (MAPE). These analyses were performed for both automated versus manual and Inline versus manual comparisons across all five LV parameters.
For Bland–Altman analysis, signed differences between paired measurements were calculated to determine mean bias and limits of agreement. Absolute and percentage differences were calculated for the corresponding error analyses. RMSE was calculated from the squared differences between paired measurements, while MAPE was used to express measurement error as a percentage of the manual reference measurements. Statistical analysis was performed using IBM SPSS Statistics (version 24; IBM Corp., Armonk, NY, USA).
Additional analyses, including normality testing, Friedman and Wilcoxon signed-rank tests, were considered secondary or exploratory analyses and are presented in the Supplementary Material.
Results
Sample Characteristics
The sample comprised 130 males (73.0%) and 48 females (27.0%). Three cardiac magnetic resonance (CMR) procedure types were represented: Cardiac Function with Contrast (CFC, n = 142, 79.8%), Cardiac MRI with Contrast (CMw/C, n = 26, 14.6%), and Cardiac MRI without Contrast (CMw/oC, n = 10, 5.6%). Table 1 presents the sample characteristics.
Table 1. Sample characteristics| Characteristic | n | % |
|---|---|---|
| Gender | ||
| Male | 130 | 73.0% |
| Female | 48 | 27.0% |
| Procedure Type | ||
| Cardiac Function with Contrast (CFC) | 142 | 79.8% |
| Cardiac MRI with Contrast (CMw/C) | 26 | 14.6% |
| Cardiac MRI without Contrast (CMw/oC) | 10 | 5.6% |
| Total | 178 | 100% |
Descriptive Statistics
Cardiac Parameter Measurements
Table 2 presents the summary statistics of the five cardiac parameters; across all cardiac parameters, values derived from Automated cardiac MRI analysis were closer to the Manual reference standard. In contrast, Inline CMR measurements showed greater deviation from the Manual reference standard (Figure 1, Figure 2, Figure 3, Figure 4, Figure 5).
Table 2. Descriptive statistics of cardiac parameter measurements.| Parameter | Inline | Automated | Manual (Reference) | |||
| Mean | SD | Mean | SD | Mean | SD | |
| EF (%) | 44.22 | 16.42 | 39.18 | 16.66 | 40.01 | 16.91 |
| EDV (ml) | 174.17 | 95.85 | 196.66 | 190.40 | 195.92 | 190.43 |
| ESV (ml) | 107.39 | 84.30 | 132.33 | 179.85 | 133.76 | 181.91 |
| SV (ml) | 67.22 | 21.16 | 63.79 | 23.16 | 65.25 | 23.77 |
| Mass (g) | 132.39 | 48.92 | 137.57 | 50.25 | 138.60 | 50.39 |
Figure 1. Mean Ejection Fraction: Inline vs Automated vs Manual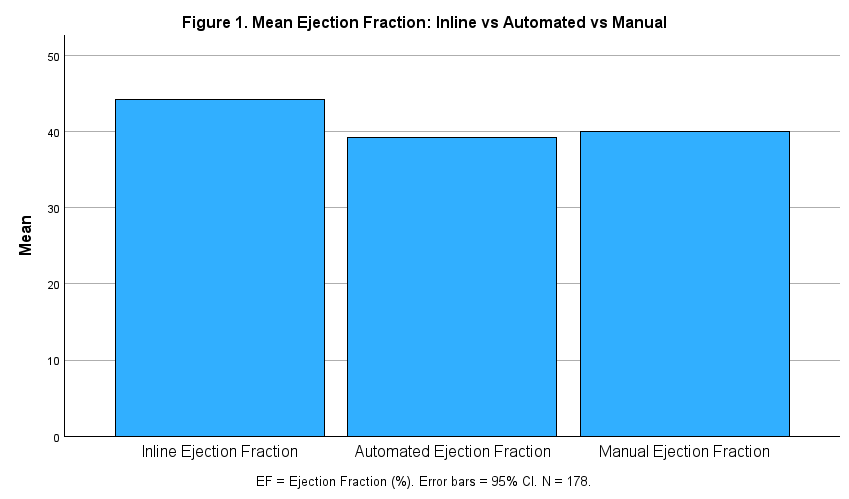
Download figureNote. Mean Ejection Fraction are shown for each of Inline, Automated and Manual measurements.
Figure 2. Mean End-Diastolic Volume: Inline vs Automated vs manual.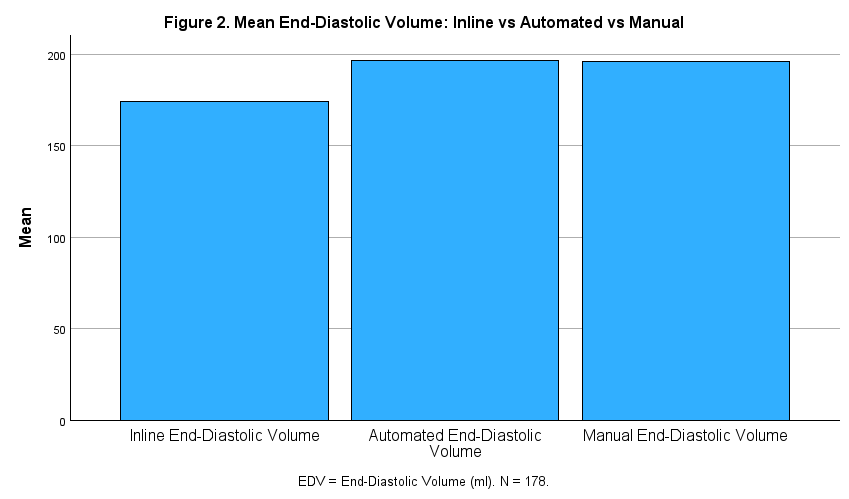
Download figureNote. Mean End-Diastolic Volume scores are shown for Inline, Automated, Manual measurements
Figure 3. Mean End-Systolic Volume: Inline vs Automated vs Manual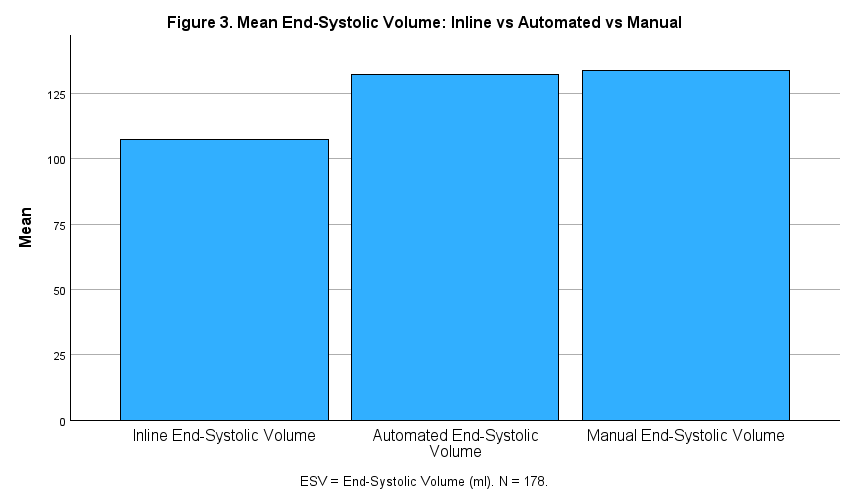
Download figureNote. Mean End-Systolic Volume scores are shown for Inline, Automated, Manual measurements
Figure 4. Mean stroke Volume: Inline vs Automated vs Manual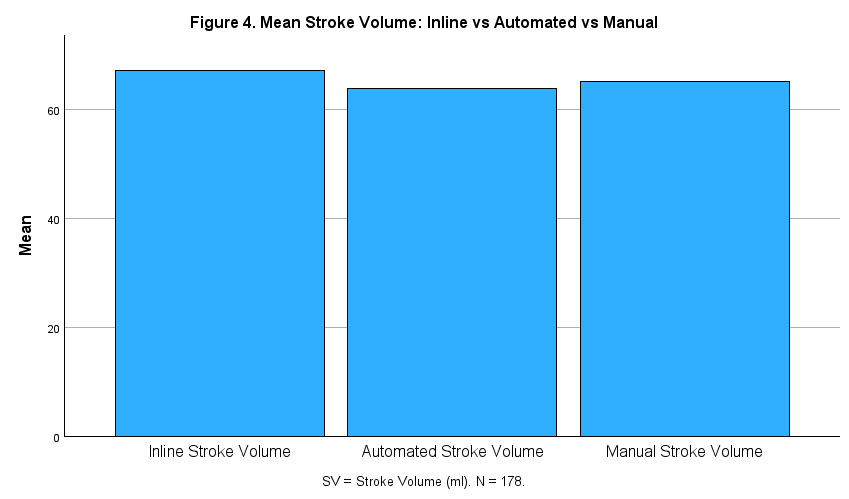
Download figureNote. Mean Stroke Volume scores are shown for Inline, Automated, Manual measurements
Figure 5. Mean Myocardial Mass: Inline vs Automated vs Manual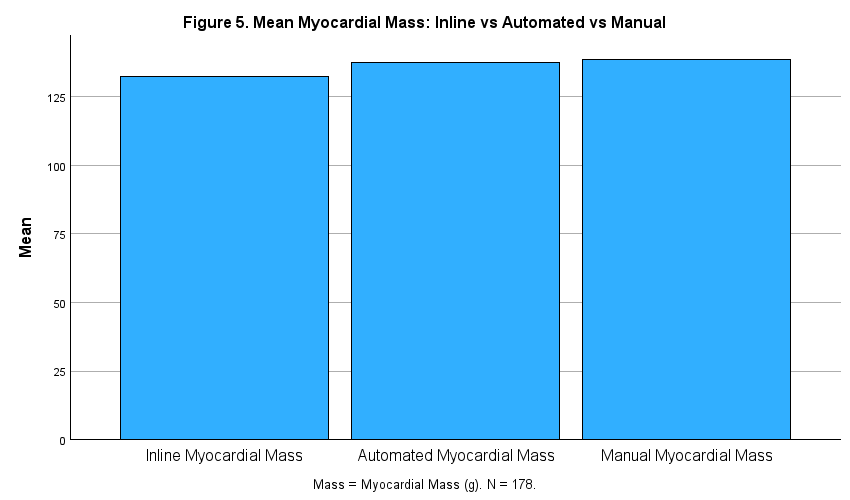
Download figureNote. Mean Myocardial Mass are shown for Inline, Automated, Manual measurements
Accuracy Metrics
The Root Mean Square Error (RMSE) and Mean Absolute Percentage Error (MAPE) values are displayed for both comparison pairs in Table 3. These measures were employed to measure the agreement between methods. Specifically, RMSE places greater weight on larger individual deviations and is expressed in the original measurement units, making it sensitive to extreme errors in cardiac parameters. In contrast, MAPE expresses the average error relative to the Manual reference values in percentage terms, which allows for standardized comparison across parameters measured in different units (Figure 6).
Table 3. Accuracy metrics by comparison pair and parameter| Parameter | Automated vs Manual | Inline vs Manual | ||||
| RMSE | MAPE | Max Error | RMSE | MAPE | Max Error | |
| EF (%) | 1.57 | 2.37% | 14.51% | 8.49 | 19.41% | 161.19% |
| EDV (ml) | 2.41 | 0.72% | 18.47% | 122.48 | 11.30% | 113.73% |
| ESV (ml) | 31.26 | 3.21% | 89.26% | 124.70 | 19.03% | 126.58% |
| SV (ml) | 6.90 | 2.65% | 73.63% | 16.47 | 17.90% | 382.43% |
| Mass (g) | 6.21 | 1.86% | 51.02% | 29.70 | 13.20% | 346.99% |
Figure 6. MAPE by Parameter: Automated vs Manual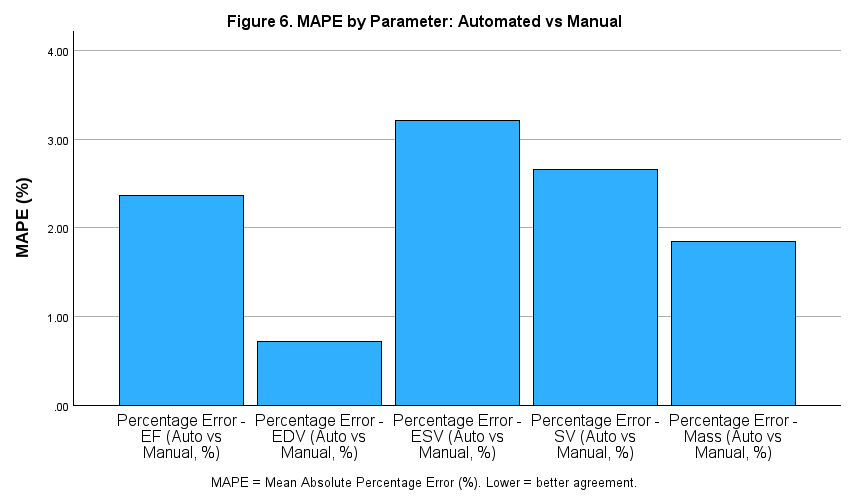
Download figureNote. Mean MAPE score are shown for Automated, and Manual measurements comparisons
Automated vs Manual for (RMSE) and (MAPE)
The Automated vs Manual comparison was the primary analysis. In this comparison, RMSE values were generally low across EF (1.57%), EDV (2.41 ml), SV (6.90 ml), and Mass (6.21 g). ESV showed a higher RMSE of 31.26 ml. MAPE values further confirmed consistent close agreement between both methods: EF 2.37%, EDV 0.72%, ESV 3.21%, SV 2.65%, and Mass 1.86%. All five MAPE values remained below 3.5%, including ESV (3.21%); however, ESV showed a higher maximum individual percentage error (89.26%) than the other parameters, reflecting the influence of isolated outlier cases rather than poor average agreement. Overall, these results indicate that the Automated post-processing measurements achieved high accuracy relative to Manual reference values.
Inline vs Manual for (RMSE) and (MAPE)
This comparison yielded poorer accuracy metrics compared to the Automated vs Manual analysis across all five cardiac parameters. The RMSE for EF was 8.49%, which is more than five times higher than the Automated equivalent, with a MAPE of 19.41%, indicating that, on average, the raw Inline EF value deviated from the Manual reference by nearly one fifth of the reference value. The volumetric parameters demonstrated the largest discrepancies, with EDV showing an RMSE of 122.48 ml (MAPE = 11.30%) and ESV showing an RMSE of 124.70 ml (MAPE = 19.03%). Stroke volume and myocardial mass also exhibited substantially higher errors compared to the Automated approach, with MAPE values of 17.90% and 13.20% respectively.
The maximum percentage errors observed for Inline vs Manual were extreme, reaching 382.43% for SV and 346.99% for Mass in individual cases, indicating that the raw scanner output can, in a minority of cases, deviate drastically from the clinician-derived reference. These findings indicate that Inline measurements may require additional verification or post-processing before being used as a substitute for manual reference measurements (Figure 7).
Figure 7. MAPE by Parameter: Inline vs Manual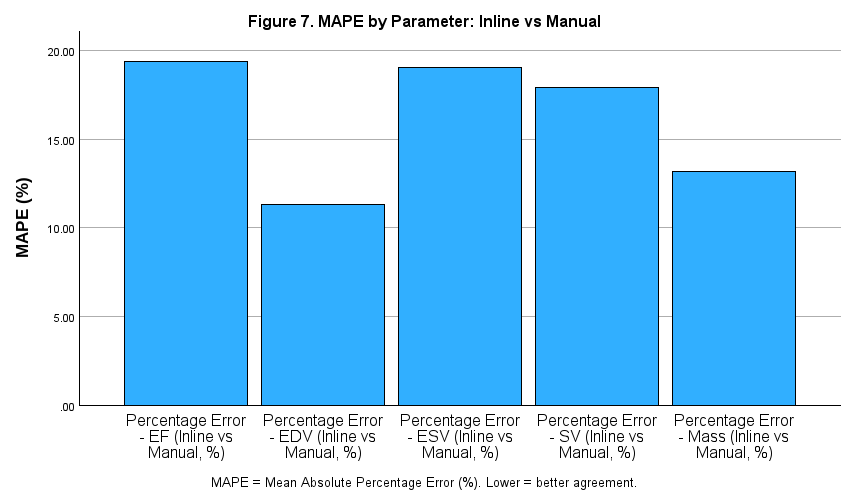
Download figureNote. Mean MAPE score are shown for Inline, and Manual measurements comparisons
Bland-Altman Analysis
Bland-Altman analysis was conducted for both comparison pairs across all five cardiac parameters. For each parameter, the mean bias (signed difference: Method minus Manual) and 95% Limits of Agreement (LoA = bias ± 1.96 SD) were derived from the signed difference descriptive statistics. Bland-Altman scatter plots were generated for all ten comparisons; reference lines were added to each plot representing the mean bias and upper and lower LoA. Results are summarized in Table 4.
Table 4. Bland-Altman analysis: bias and 95% Limits of Agreement by comparison pair.| Parameter | Automated vs Manual | Inline vs Manual | ||||||
| Bias | SD | Lower LoA | Upper LoA | Bias | SD | Lower LoA | Upper LoA | |
| EF (%) | −0.83 | 1.34 | −3.45 | 1.80 | 4.22 | 7.39 | −10.26 | 18.70 |
| EDV (ml) | 0.74 | 2.30 | −3.77 | 5.25 | −21.75 | 120.87 | −258.66 | 215.15 |
| ESV (ml) | −1.43 | 31.32 | −62.81 | 59.96 | −26.37 | 122.23 | −265.94 | 213.20 |
| SV (ml) | −1.45 | 6.76 | −14.71 | 11.80 | 1.98 | 16.39 | −30.15 | 34.11 |
| Mass (g) | −1.03 | 6.12 | −13.02 | 10.97 | −6.21 | 29.07 | −63.18 | 50.77 |
Automated vs Manual Bland-Altman analysis
The Automated method demonstrated small, clinically negligible biases relative to the Manual reference across four of five parameters. EF bias was −0.83% (95% LoA: −3.45 to 1.80%), indicating that Automated measurements were very slightly lower than Manual on average, with 95% of the differences expected to lie between −3.45 and +1.80 percentage points. EDV bias was +0.74 ml (LoA: −3.77 to 5.25 ml), and Mass bias was −1.03 g (LoA: −13.02 to 10.97 g) both narrow and centred near zero. SV showed a small negative bias (−1.45 ml, LoA: −14.71 to 11.80 ml), indicating that Automated SV values were on average slightly lower than Manual. ESV produced a larger SD (31.32 ml) and correspondingly wider LoA (−62.81 to 59.96 ml), driven by the small number of extreme outlier cases. The median absolute ESV difference (0.72 ml) confirms that agreement was close in most cases, and the wide limits reflect outlier influence rather than systematic disagreement across the sample.
Inline vs Manual Bland-Altman analysis
The Inline vs manual comparison revealed systematic and clinically significant biases across all five parameters. EF showed a positive bias of +4.22% (LoA: −10.26 to 18.70%), confirming the systematic inflation of Inline EF relative to Manual. This is clinically meaningful: a patient with a true EF of 42% (borderline reduced) could receive an Inline EF reading as high as 60%, potentially obscuring the need for clinical intervention. Additionally, volume parameters showed particularly wide limits of agreement, reflecting both systematic bias and extreme variability. EDV bias was −21.75 ml (LoA: −258.66 to 215.15 ml) and ESV bias was −26.37 ml (LoA: −265.94 to 213.20 ml). These extraordinarily wide limits indicate that the Inline scanner output is not interchangeable with Manual measurements for volume assessment in this population. SV bias was +1.98 ml (LoA: −30.15 to 34.11 ml), appearing modest in absolute terms but with limits spanning approximately 64 ml, clinically unacceptable for individual patient assessment. Mass bias was −6.21 g (LoA: −63.18 to 50.77 g), again with wide limits reflecting substantial individual variability.
Overall, the two comparisons revealed that Automated measurements were the closest to the standard reference (Manual) across nearly all cases, with biases that are small in absolute terms and clinically acceptable for EF, EDV, and Mass. On the other hand, inline measurements varied widely with significant biases.
Intraclass Correlation Coefficient (ICC)
ICC results are presented in Table 5 with 95% confidence intervals and interpreted using the benchmarks of Koo and Li:8 ICC > .90 = Excellent; .75–.90 = Good; .50–.75 = Moderate; < .50 = Poor. All ICC values were statistically significant (all p < .001).
Table 5. Intraclass Correlation Coefficients with 95% confidence intervals by comparison pair.| Parameter | Automated vs Manual | Inline vs Manual | ||||
| ICC | 95% CI Lower | 95% CI Upper | ICC | 95% CI Lower | 95% CI Upper | |
| EF (%) | .996 | .988 | .998 | .874 | .739 | .929 |
| EDV (ml) | 1.000 | 1.000 | 1.000 | .673 | .582 | .746 |
| ESV (ml) | .985 | .980 | .989 | .619 | .516 | .704 |
| SV (ml) | .957 | .941 | .968 | .733 | .657 | .794 |
| Mass (g) | .992 | .990 | .994 | .823 | .766 | .867 |
Automated vs Manual (ICC)
The Automated method achieved excellent reliability relative to the Manual reference standard across all five cardiac parameters. The ICC for EF was .996 (95% CI: .988–.998), for EDV was 1.000 (95% CI: 1.000–1.000), for ESV was .985 (95% CI: .980–.989), for SV was .957 (95% CI: .941–.968), and for Mass was .992 (95% CI: .990–.994). All five values exceeded the excellent threshold of .90, with EF, EDV, and Mass approaching the theoretical maximum of 1.0. This finding is consistent with the Bland-Altman analysis and the accuracy metrics that found the Automated measurements to be near the manual measurements.
Inline vs Manual (ICC)
The Inline comparison produced substantially lower ICC values across all five parameters, compared to the Automated process. EF achieved good reliability (ICC = .874, 95% CI: .739–.929), though with a notably wide confidence interval indicating greater uncertainty. Mass (.823, 95% CI: .766–.867) falls within the ‘Good’ range. SV (.733, 95% CI: .657–.794), EDV (.673, 95% CI: .582–.746) and ESV (.619, 95% CI: .516–.704) fall within the ‘Moderate’ range, indicating that Inline volumetric measurements share a meaningful portion of variance with Manual values but are not sufficiently reliable for interchangeable clinical use.
The contrast between the two comparisons is striking: every automated parameter exceeded the Excellent threshold, whereas three Inline parameters (SV, EDV and ESV) fell within the Moderate range. This finding, combined with the Bland-Altman results, provides strong and consistent evidence that Automated post-processed measurements are substantially more reliable than Inline scanner output.
Discussion
This study compared Inline scanner-derived measurements, Automated post-processing, and Manual quantification of left ventricular functional parameters (EF, EDV, ESV, SV, and myocardial mass) in 178 cardiac MRI examinations. The aim was to evaluate the agreement, bias, and measurement error across the three approaches.
Overall, Automated post-processing demonstrated excellent agreement with Manual reference standards, showing consistently strong concordance across all evaluated parameters and minimal clinically relevant deviation. Bland–Altman analysis confirmed slight systematic differences, supporting close agreement between Automated segmentation and Manual contouring. In contrast, Inline scanner measurements showed greater disagreement with Manual values. A consistent pattern of directional bias was observed across ventricular functional parameters, with an overestimation of EF and underestimation of ventricular volumes. The wider limits of agreement indicate that Inline measurements may be less suitable as a substitute for manual reference measurements at the individual-patient level.
Performance of the Automated Method
The Automated post-processing pipeline in this study demonstrated excellent agreement with Manual reference standards across all evaluated cardiac parameters (EF, EDV, ESV, SV, and myocardial mass). The ICC values observed ranged from 0.957 to 1.000, indicating excellent agreement; while MAPE remained below 3.5% for all variables. Bland–Altman analysis further confirmed minimal systematic bias, with EF (-0.83%), EDV (0.74 mL), SV (-1.45 mL), and myocardial mass (-1.03 g) showing clinically negligible deviations from Manual measurements.
The high agreement observed in the present study is consistent with previous evaluations of automated CMR segmentation, which have reported performance approaching expert manual measurements.9 The high ICC values (>0.95) observed in this study are likewise consistent with Böttcher et al.,10 who noted that clinically meaningful differences occurred in approximately 18% of cases when compared with expert-corrected manual analysis, although overall agreement remained excellent.
Inline Scanner Performance
Inline scanner-derived measurements demonstrated systematic and clinically relevant deviations from Manual reference standards, in contrast to the Automated pipeline. EF was consistently overestimated (+4.22%), while EDV and ESV were underestimated, producing a distorted stroke volume profile. Furthermore, Inline measurements showed lower agreement than automated measurements, with ICCs ranging from 0.619 to 0.874; EF and myocardial mass showed good agreement, whereas EDV, ESV, and SV fell within the moderate ICC range. Bland–Altman limits of agreement were wide, reaching up to ±250 mL in extreme volumetric cases, highlighting substantial variability at the individual patient level. These findings align with the UK Biobank InlineVF evaluation,11 which reported similar systematic patterns of bias, including LV mass overestimation (~29.9 g) and moderate agreement for EF (ICC ≈ 0.586).
In a similar large-scale clinical evaluation, Böttcher et al.10 noted that fully automated inline-style analyses required expert correction in 18% of cases despite high ICC values, suggesting that Inline systems may produce acceptable aggregate performance but unreliable individual-level measurements.
Comparison Between Methods
A clear and consistent hierarchy in performance was observed at comparison between Inline, Automated, and Manual methods across all five cardiac parameters. The Automated method demonstrated excellent agreement with Manual reference measurements across all five evaluated parameters; while Inline measurements demonstrated only moderate-to-good agreement with Manual reference values (good for EF and myocardial mass; moderate for SV, EDV and ESV). Systematic bias was evident across all parameters, particularly EF overestimation and EDV/ESV underestimation. This distinction is supported by ICC analysis and reinforced by Bland–Altman bias patterns and percentage error metrics. Importantly, while Inline methods may show acceptable correlation at the population level, their wide variability and directional bias significantly reduce reliability for individual clinical decision-making.
Overall, automated post-processing showed closer agreement with manual reference measurements than Inline measurements across the evaluated LV parameters.
Clinical Implications
The findings of this study have direct implications for clinical cardiac MRI workflows. The findings support the feasibility of incorporating automated post-processing into routine LV quantification workflows, with expert review when segmentation or measurement reliability is uncertain. This supports the growing body of literature advocating for AI-assisted cardiac imaging workflows, where automated segmentation serves as the primary quantification method with selective human oversight.
In contrast, the greater disagreement observed with Inline measurements suggests that these measurements may warrant confirmation when used for clinical decision-making. The systematic bias and wider variability suggest that Inline measurements should be interpreted cautiously during clinical decision-making. Despite advances in automation, Manual review remains essential in selected cases, particularly where image quality is suboptimal or anatomical abnormalities are present.
Several limitations could be addressed in future studies. First, the Manual measurements, while treated as the reference standard, are subject to inter- and intra-observer variability; a single clinician measurement per patient was used without inter-rater reliability assessment. Second, the Automated method was evaluated as a whole pipeline; the contribution of individual algorithmic steps to any residual errors was not examined.
Conclusion
Automated CMR post-processing demonstrated excellent agreement with manual reference measurements across the five evaluated LV parameters, with small measurement biases and low measurement error. In comparison, Inline scanner-derived measurements showed greater bias and variability relative to the manual reference measurements. These findings support the feasibility of using automated post-processing to aid routine LV quantification, with expert review when segmentation or measurement reliability is uncertain. Further evaluation across multiple centers, scanners, and patient populations is warranted to assess the generalizability of the automated workflow.
Abbreviations
- AI = Artificial Intelligence
- CFC = Cardiac Function with Contrast
- CI = Confidence Interval
- CMR = Cardiac Magnetic Resonance
- CMw/C = Cardiac MRI with Contrast
- CMw/oC = Cardiac MRI without Contrast
- EDV = End-Diastolic Volume
- EF = Ejection Fraction
- ESV = End-Systolic Volume
- ICC = Intraclass Correlation Coefficient
- LoA = Limits of Agreement
- LV = Left Ventricular
- LVEDV = Left Ventricular End-Diastolic Volume
- LVEF = Left Ventricular Ejection Fraction
- LVESV = Left Ventricular End-Systolic Volume
- MAPE = Mean Absolute Percentage Error
- PACS = Picture Archiving and Communication System
- RMSE = Root Mean Square Error
- SD = Standard Deviation
- SV = Stroke Volume
References
- 1.Mahmoodi A, Yeluru A, Aguirre-Chavez J, et al. Artificial intelligence in cardiovascular MRI: From imaging to biomechanics and diagnosis. J Thorac Imaging. 2026;41(2). doi:10.1097/RTI.0000000000000864
- 2.Angiras S, Boruah DK, Phukan P, et al. Automated deep learning based cardiac quantification in hypertrophic cardiomyopathy: A comparative study with manual segmentation. Acta Med Litu. 2025;32(2):333–347. doi:10.15388/Amed.2025.32.2.8
- 3.Mikeladze B, Nikolaishvili G, Kobaladze N. Artificial intelligence in cardiology: The current applications and future directions. Cureus. 2025;17(12):e99270. doi:10.7759/cureus.99270
- 4.Siemens Healthineers. syngo.via: The intelligent imaging software. Siemens Healthineers website. https://www.siemens-healthineers.com/digital-health-solutions/syngovia. Accessed July 14, 2026.
- 5.Pergola V, Mattesi G, Cozza E, et al. New non-invasive imaging technologies in cardiac transplant follow-up: Acquired evidence and future options. Diagnostics. 2023;13(17):2818. doi:10.3390/diagnostics13172818
- 6.Wandt B, Bojo L, Tolagen K, et al. Echocardiographic assessment of ejection fraction in left ventricular hypertrophy. Heart. 1999;82(2):192–198. doi:10.1136/hrt.82.2.192
- 7.Wisneski JA, Pfeil CN, Wyse DG, et al. Left ventricular ejection fraction calculated from volumes and areas: underestimation by area method. Circulation. 1981;63(1):149–151. doi:10.1161/01.CIR.63.1.149
- 8.Koo TK, Li MY. A guideline of selecting and reporting intraclass correlation coefficients for reliability research. J Chiropr Med. 2016;15(2):155–163. doi:10.1016/j.jcm.2016.02.012
- 9.Backhaus SJ, Schuster A, Lange T, et al. Impact of fully automated assessment on interstudy reproducibility of biventricular volumes and function in cardiac magnetic resonance imaging. Sci Rep. 2021;11:11648. doi:10.1038/s41598-021-90702-9