
Evaluation of Immunomodulatory Effect of a Novel Test Formulation in D-Galactose-Induced Aging Dysfunction in Sprague Dawley Rats
Abstract
The aim of the study was to evaluate the immunomodulatory activity of the Biofield Treated/Blessed proprietary test formulation consisting of essential ingredients viz. minerals (zinc, magnesium, iron, and copper) and vitamins (B6, B12, and D3) in male Sprague Dawley rats. Each ingredient of the test formulation was divided into two parts. One part was denoted as the control without any Biofield Energy Healing Treatment/Blessing, while the other part was defined as the Biofield Energy Treated/Blessed sample, which received the Biofield Energy Healing Treatment/Blessing by a renowned Biofield Energy Healer, Mr. Mahendra Kumar Trivedi remotely. Additionally, three group of animals were also received Biofield Energy Treatment per se (at day -15) under similar conditions. The parameters were assessed such as immune biomarkers (IgM, IgG, IgA, IgE, CD4+, CD8+, and CD28+), biochemistry and hematology and histopathology. The experimental results showed IgG level was significantly increased by 10.70% and 8.03% in the G6 (Biofield Energy Treatment per se at day -15) and G8 (Biofield Treatment per se to animals plus Biofield Treated test formulation from day -15) groups, respectively as compared with untreated test formulation (G4). Additionally, CD8+ count was significantly increased by 20.67% in the G8 group, while CD28+ count was significantly increased by 11.70%, 8.32%, and 9.82% in the G7 (Biofield Energy Treated test formulation at day -15), G8, and G9 (Biofield Treatment per se (day -15) to animals plus untreated test formulation) groups, respectively after Biofield Energy Treatment to the animals as compared with the untreated test formulation. In hematological analysis, platelet count was increased in the G5, G6, G7, G8, and G9 groups by 40.69%, 27.95%, 26.67%, 38.58%, and 28.28%, respectively compared with the disease control (G2) group. Biochemical parameters showed significant decrease in the level of creatinine by 32.14% in the G9 group as compared with the G2 group. Further, animal body weight, feed intake, relative organ weight, and histopathological findings of all the tested groups did not show any abnormal findings with respect to the safe and non-toxic treatment strategies. Overall, the experimental data concluded that the Biofield Energy Treated/Blessed test formulation showed considerable improved cellular and humoral immune response as compared with the untreated test formulation. Thus, the Trivedi Effect®-Biofield Energy Healing Treatment per se and the test formulation has the significant capacity for immunomodulatory effect, stress management and anti-aging by improving overall health.
Article Information
- Received
- Accepted
- Published
Academic Editor: Ian James Martins, PRINCIPAL RESEARCH FELLOW Edith Cowan University, Australia.
Checked for plagiarism: Yes
Review by: Single-blind
Copyright © 2021 Mahendra Kumar Trivedi, et al.
 This is an open-access article distributed under the terms of the Creative Commons Attribution License, which permits unrestricted use, distribution, and reproduction in any medium, provided the original author and source are credited.
Corresponding author: Snehasis Jana, Trivedi Science Research Laboratory Pvt. Ltd., Thane (W, ), Maharashtra, India —
Competing Interests
The authors have declared that no competing interests exist.
Funding
No specific funding statement was provided by the authors.
Data Availability
No data-availability statement was provided by the authors.
Acknowledgements
The authors are gratefully acknowledged to Trivedi science, Trivedi Global, Inc., and Trivedi master wellness and to Dabur Research Foundation (DRF), India for their support.
Citation:
Introduction
High incidence of diseases, increased population growth, unemployment, and altered ethical values have been widely dominant in 21st century 1. With high use of antibiotics and other drugs, multidrug resistance is the common cause of high mortality and treatment failure 2. Thus, most of the research has been focusing towards immunomodulation, which would significantly help the immune system to fight against broad spectrum of diseases. This will manipulate the state of activity of the immune system either increase or decrease depending on the immune response. Immunostimulation/immunopotentiation is the augmentation of immune response, while immunosuppression referred to the suppression of immune responsiveness 3. Thus, using various complementary source of medicine, which are supposed to be safe as compared with the synthetic molecules, immune response is altered at desired level 4. Immunomodulation play a vital role in aging and its associated disorders. In aging, various physiological functions have been progressively declined and are associated with dysfunction of body function leads to death. Oxidative stress is one of the major factors along with other such as alcohol intake, air pollutions, environmental pollutants, physical stress, and radiations, etc. are some of the extrinsic factors, which results in generation of free radicals causing damage to body cells 5, 6. Thus, any formulations that have significant immunomodulatory activity can be used as anti-aging formulation against various disorders. Thus, with this respect a new proprietary test formulation was formulated containing mixture of minerals (zinc chloride, magnesium gluconate hydrate, and ferrous sulphate, copper chloride) and vitamins (pyridoxine HCl, cyanocobalamin, and cholecalciferol). Each constituent of this formulation is commonly used as nutraceutical supplement 7, 8. The immunomodulatory agents have the ability to normalize or modulate pathophysiological processes, while minerals such as zinc and magnesium has enzyme catalyzing activity and minimizing the production of inflammatory cytokines 9, respectively.
As a Complementary and Alternative Medicine (CAM), Biofield Energy Healing/Blessing Treatment was selected as one of the best approach, which is accepted worldwide using various Energy Healing Therapies 10, 11. Biofield Energy Healing Therapies have been practiced and accepted by the U.S. population and is well defined by National Center for Complementary and Alternative Medicine (NCCAM) 12, 13. Some complementary therapies has been extensively used and reported such as external qigong, Johrei, Reiki, therapeutic touch, yoga, Qi Gong, polarity therapy, Tai Chi, pranic healing, deep breathing, chiropractic/osteopathic manipulation, guided imagery, meditation, massage, homeopathy, hypnotherapy, progressive relaxation, acupressure, acupuncture, special diets, relaxation techniques, Rolfing structural integration, healing touch, movement therapy, pilates, mindfulness, Ayurvedic medicine, traditional Chinese herbs and medicines in biological systems both in vitro and in vivo. The Trivedi Effect®-Consciousness Energy Healing therapies have been widely accepted worldwide in nonliving materials and living organisms. Consciousness Energy Healing Treatment found to be significant to improve the metal physicochemical properties 14, 15, 16, improved crop yield in agriculture science 17, 18, microbiology 19, 20, 21, biotechnology 22, 23, improved bioavailability of many compounds 24, 25, 26, improved skin health 27, 28, improved properties of nutraceuticals 29, 30, cancer science research 31, 32, improved overall bone health 33, 34, 35, human health and wellness. Thus, the present study was designed to study the immunomodulatory activity of the test formulation using immune biomarkers such level of immunoglobulins (IgA, IgE, IgG, and IgM), CD markers (CD4+, CD8+, & CD28+), body weight, feed consumption, hematology parameters, biochemistry, and histopathology in Sprague Dawley (SD) rats.
Materials and Methods
Chemicals and Reagents
Copper chloride, cholecalciferol (vitamin D3), sodium carboxymethyl cellulose (Na-CMC), and iron (II) sulfate were procured from Sigma-Aldrich, USA. Pyridoxine hydrochloride (vitamin B6), zinc chloride, cyanocobalamin (vitamin B12), magnesium (II) gluconate, and resveratrol were purchased from TCI, Japan. D (+) galactose obtained from Amresco, LLC. All the other chemicals used in this experiment were analytical grade procured from India.
Experimental Animals
Randomly breed maleSD rats with body weight around 300 gm were used in this study. The animals were purchased from M/s. National Institute of Biologicals, India. Animals were randomly divided into nine groups based on their body weights consist of ten animals of each group. They were kept individually in sterilized polypropylene cages with stainless steel top grill having provision for holding pellet feed and drinking water bottle fitted with stainless steel sipper tube. The animals were maintained as per standard protocol throughout the experiment.
Consciousness Energy Healing Strategies
Each ingredient of the test formulation was divided into two parts. One part of each ingredient was considered as control, where no Biofield Energy Treatment/Blessing was provided. Another part of each ingredient was received Biofield Energy Treatment/Blessing by Mr. Mahendra Kumar Trivedi (known as the Trivedi Effect®) under laboratory conditions for ~3 minutes. Besides, three group of animals were also received Biofield Energy Treatment under laboratory conditions for ~3 minutes. The Blessing/Treatment was given to the test items remotely in the laboratory of Dabur Research Foundation, near New Delhi, India. Similarly, the control samples were subjected to “sham” healer under the same laboratory conditions for ~3 minutes. The “sham” healer did not have any knowledge about the Biofield Energy Treatment. After that, the Biofield Energy Treated samples were kept in the similar sealed condition and used as per the study plan. The Biofield Energy Treated animals were also taken back to the experimental room for further proceedings.
Experimental Procedure
Five days after acclimatization, animals were randomized and grouped based on their body weight. The dosing for group G7 and G8 was also initiated on day -15 till the end of the experiment. However, group G1 to G6 and G9 animals were dosed from day 1 till the end of experiment. All the animals except G1 received D-galactose, daily (500 mg/kg; i.p.) from day 1 to the end of the experiment. At the end of the experimental period, i.e., during 9th week, animals were bled and the blood and serum samples were subjected for the test such as immunoglobulins (IgA, IgE, IgG, and IgM), CD markers (CD4+, CD8+, and CD28+), hematology parameters, biochememistry, and organs were subjected to histopathological analysis.
Assessment of Cellular and Humoral Responses
In order to study the humoral immune response, IgA, IgE, IgG, and IgM were estimated using Mini Vidas, Biomeurix (French) from serum, using commercially available kits as per manufacturer’s instructions. Flow cytometry was used to evaluate the CD4+, CD8+, & CD28+ cells in whole blood as a measure of the cellular immune response using Guava Flow Cytometer, EasyCyte. The mean value was calculated for each group with SEM. The percent change in the Biofield Energy Treated/Blessed group was calculated compared to the vehicle treatment group.
Determination of Hematological and Biochemical Parameters
In order to determine the effect of test formulation on blood profile, blood was collected from the retro-orbital plexus using heparinized or non-heparinized capillary tubes in all the experimental animals. Blood was placed in plain bottles for isolation of serum in order to perform the biochemical analysis. The other portion of the blood samples were subjected to estimation of various haematological parameters using Hematology analyzer (Abbott Model-CD-3700). The levels of hemoglobin (Hb), red blood cell count (RBC), packed cell volume (PCV), mean corpuscular volume (MCV), mean corpuscular hemoglobin (MCH), mean corpuscular haemoglobin concentration (MCHC) and platelets were analyzed. In addition, magnesium, blood urea, creatinine, uric acid, calcium, phosphorus, potassium, sodium, and chloride ion concentration were also analyzed.
Determination of Body Weight and Feed Intake
All the experimental animals were daily analyzed for their change in body weight and feed intake, which was calculated by weighing the daily feed supply and the left-over amount that evaluate the average daily feed intake. The average of the feed intake was computed for every three days of the experimental period. All the data were reported through the study treatment regimen.
Clinical Sign and Symptoms
All the animals in different test groups were analyzed for various clinical signs and symptoms in accordance with in-house protocol. Abnormal behaviour in animals was recorded with the time of onset and disappearance.
Measurement of Relative Organ Weight and Histopathology
All the rats were subjected to histopathological analysis at the end of the experiment, while the organs of all the animals such as liver, kidneys, heart, spleens, lungs and uterus were excise for relative organ weight. The organ to body weight ratio percentage was identified by comparing the weight of each organ with the final body weight of individual rat. Histopathological examination of all the collected samples was placed in 10% neutral buffered formalin.
Relative organ weight was calculated using the formula mentioned below-
Relative organ weight = Absolute organ weight (g)/weight of rat on sacrifice day (g) x 100
Statistical Analysis
All the animal experimental data of immunological studies were expressed as mean ± standard error of mean (SEM) followed by Student’s t-test. Statistical significance was considered at p≤0.05.
Results and Discussion
Evaluation of Humoral Immune Response
Immunoglobulin’s levels (IgM, IgG, IgA, and IgE) after treatment with the test formulation are shown in Figure 1 (A-D). IgM level of rats treated with D-galactose (G2) showed 0.47 ± 0.07 mg/mL, which was higher than the normal control (G1) group 0.37 ± 0.03 mg/mL. However, rats treated with Biofield Energy Treatment per se, reference compound, different combination of Biofield Energy Treated and untreated test formulation to the Biofield Energy Treated and untreated D-galactose induced animals, showed significant change in the level of IgM. Overall, the level of IgG was significantly increased by 2.18%, 10.70%, and 8.03% in G5, G6, and G8 groups, respectively while IgE level was increased by 7.83% and 5.79% in G5 and G8 groups, respectively after Biofield Energy Treatment as compared with the untreated test formulation. Overall, it can be concluded that the Biofield Energy Healing Treatment altered the humoral immune response with respect to the untreated test formulation.
Figure 1. The effect of the test formulation on tested immunoglobulin, (A) IgM, (B) IgG, (C) IgA, and (D) IgE in various test groups G1 to G9 in male SD rats. G1: Normal control; G2: Disease control (Aging control D-galactose (500 mg/kg, i.p.)); G3: Resveratrol, 200 mg/kg; G4: Untreated test formulation; G5: Biofield Energy Treated test formulation; G6: Biofield treatment per se to animals (-15 Days); G7: Biofield Energy Treated test formulation (-15 Day); G8: Biofield Energy Treatment per se to animals plus Biofield Energy Treated test formulation ( -15 Day); and G9: Biofield Energy Treatment per se to animals plus untreated test formulation. All the values are represented as mean ± SEM (n=8).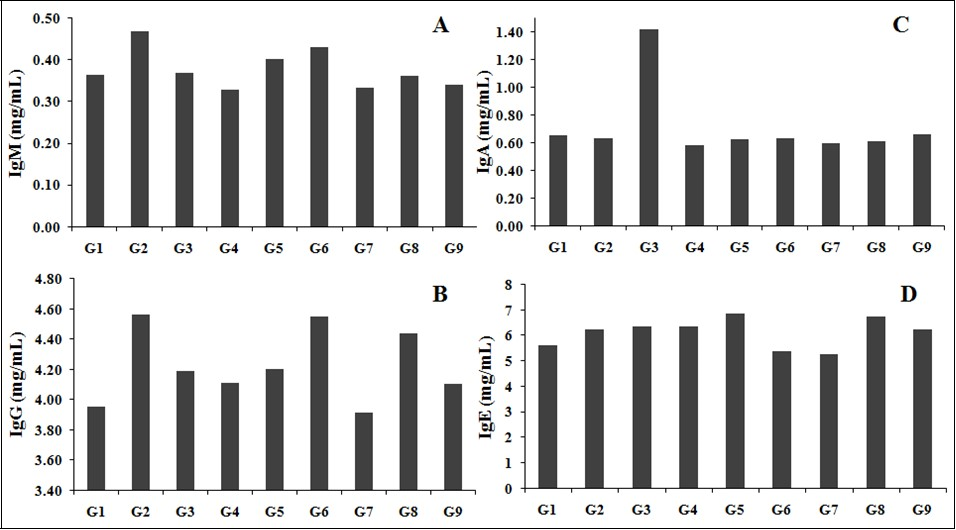
Download figure
IgM, IgG, IgA, and IgE are considered as the major immunoglobulins, which regulates the immune system 36. The test formulation used contained vitamins and minerals, which are reported to have significant immunomodulatory activity. Moreover, various studies reported that there is a correlation between immune response and activation of anti-aging gene Sirtuin-1 expression 37, 38. Therefore, the effects of the novel test formulation and the Trivedi Effect®-Biofield Energy Healing may activate the anti-aging gene Sirtuin 1 that is connected to the immune system, oxidative stress and improving overall health. Besides, literature also cited that activation of heat shock gene Sirtuin-1 is due to improvement of immune system 39, 40. Thus, the effects of the Trivedi Effect®-Biofield Energy Healing may possibly involve activation of the heat shock gene Sirtuin 1 that is connected to mitochondrial function, immune system, cell senescence and apoptosis. All-inclusive, the data suggested that the Biofield Energy Healing Treatment has significantly modified the immune response and altered the immunoglobulin production in various test groups, could be used as antiaging potential.
Measurement of Cellular Responses
The test formulation was tested for cellular immune response, which was estimated by calculating the percentage of vital biomarkers such as CD4+, CD8+, and CD28+ and the results are presented in the Figure 2 (A-B). CD28+ level of rats treated with D-galactose (G2) was 61.20 ± 1.00%, which was higher than the control (G1) group 54.28 ± 1.49% (p<0.01). The results showed the percentage of CD8+ was significantly increased by 20.67% in the G8 group, while % of CD28+ was significantly increased by 5.44%, 11.70%, 8.32%, and 9.82% in the G5, G7, G8, and G9 groups, respectively after Biofield Energy Treatment to animals as compared with untreated test formulation. This experimental data suggested that the Biofield Energy Healing Treatment has shown a significant improved cellular immune response in the test groups as compared with the untreated test formulation, which showed its use in many inflammatory and autoimmune disorders.
Figure 2. The effect on the cellular biomarkers in blood sample of male SD rats after treatment with the test formulation on various groups (G1 – G9). (A) CD4+, (B) CD8+, and (C) CD28+. G1: Normal control; G2: Disease control (Aging control D-galactose (500 mg/kg, i.p.)); G3: Resveratrol, 200 mg/kg; G4: Untreated test formulation; G5: Biofield Energy Treated test formulation; G6: Biofield treatment per se to animals (-15 Days); G7: Biofield Energy Treated test formulation (-15 Day); G8: Biofield Energy Treatment per se to animals plus Biofield Energy Treated test formulation ( -15 Days); and G9: Biofield Energy Treatment per se to animals plus untreated test formulation. All the values are represented as mean ± SEM (n=8).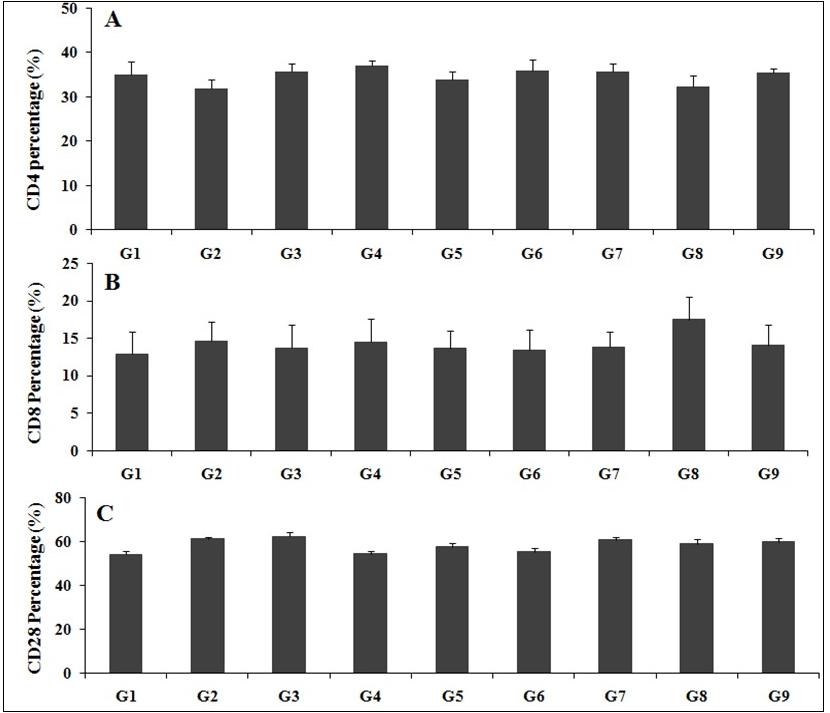
Download figure
Cellular immunity plays a vital role against various antigens, while CD4+ or T4 cells manage infection control and its spread and CD8+ T lymphocyte T8 cells or CD8+i.e. suppressor or killer cells have the capacity to kill the infected cells or cancerous cells. CD28+ cells are antigen specific cytotoxic T cells, which also plays a vital role in immunity to fight against numerous infections 41. T cells activation and its proliferation play a major role in strong immunity to fight against infections and its associated diseases 42. The present study concluded that Biofield Energy Healing (the Trivedi Effect®) Treatment in test formulation showed a significant improved cellular response, which results in increased number of CD4+, CD8+, and CD28+ cells that would significantly improved the cellular immunity to fight against various infections.
Hematological Analysis
Table 1 showed the result of change in major hematological parameters after treatment with the Biofield Energy Treated and untreated test formulation. However, all the treatment groups showed similar levels, except G5 which was marginally higher than G2. The RBC (106/μL) count in the Biofield Energy Treated test formulation group (G5) was slightly increased i.e., 10.03 ± 0.23 X 10⁶/μL as compared with the disease control group. However, significant increase in the platelet count was reported in G5, G6, G7, G8, and G9 by 40.69%, 27.95%, 26.67%, 38.58%, and 28.28%, respectively compared with the disease control (G2) group. However, the data suggested the change was not statistically significant in the following hematological parameters across all the treatment groups (G3 to G9) including normal (G1) and D-galactose induced aging group (G2), viz. neutrophils, platelets, PCV, MCV, MCHC, hemoglobin, MCH, RDW-CV and RBC.
Table 1. Hematology profile after treatment with the test formulation in experimental rats.| Group | RBC106/ μL | Hbgm/dL | PCV% | MCVfl | MCHpg | MCHC% | Platelet Count (thousand/mm3) | RDW-CV |
| G1 | 9.58 ± 0.20 | 16.99 ± 0.25 | 50.36 ± 0.80 | 52.41 ± 0.48 | 17.6 ± 0.19 | 33.67 ± 0.20 | 721.25 ± 89.47 | 0.13 ± 0.00 |
| G2 | 9.51 ± 0.23 | 16.95 ± 0.25 | 50.04 ± 0.91 | 52.05 ± 0.54 | 17.59 ± 0.25 | 33.81 ± 0.25 | 635.00 ± 59.32 | 0.13 ± 0.00 |
| G3 | 9.61 ± 0.27 | 17.08 ± 0.54 | 50.71 ± 1.63 | 51.90 ± 0.81 | 17.40 ± 0.19 | 33.34 ± 0.32 | 781.38 ± 107.76 | 0.13 ± 0.00 |
| G4 | 9.37 ± 0.18 | 16.94 ± 0.22 | 50.13 ± 0.66 | 51.90 ± 1.00 | 17.40 ± 0.28 | 33.68 ± 0.18 | 664.38 ± 64.22 | 0.13 ± 0.00 |
| G5 | 10.03 ± 0.23 | 17.16 ± 0.26 | 45.33 ± 5.91 | 50.38 ± 0.27 | 17.09 ± 0.16 | 34.21 ± 0.39 | 893.38 ± 114.74 | 0.13 ± 0.00 |
| G6 | 9.77 ± 0.16 | 17.00 ± 0.22 | 50.05 ± 0.77 | 50.51 ± 0.46 | 17.09 ± 0.17 | 33.96 ± 0.26 | 812.50 ± 97.11 | 0.13 ± 0.00 |
| G7 | 9.92 ± 0.13 | 17.19 ± 0.27 | 50.98 ± 0.83 | 51.24 ± 0.71 | 17.21 ± 0.25 | 33.68 ± 0.12 | 804.38 ± 90.99 | 0.12 ± 0.00 |
| G8 | 9.55 ± 0.23 | 16.94 ± 0.21 | 45.95 ± 4.27 | 51.25 ± 0.26 | 17.15 ± 0.10 | 33.59 ± 0.31 | 880.25 ± 92.74 | 0.12 ± 0.00 |
| G9 | 9.91 ± 0.16 | 17.16 ± 0.22 | 50.83 ± 0.86 | 51.29 ± 0.37 | 17.28 ± 0.13 | 33.86 ± 0.28 | 814.63 ± 76.98 | 0.13 ± 0.00 |
Overall, the haematological data suggested that Biofield Energy Treated test formulation showed an improved haematological profile of animals. The minerals and vitamins in the test formulation showed improved animal hematology parameters as compared with the untreated test formulation. This suggests that the improved immunomodulatory activity of the Biofield Energy Treated test formulation, which can be significantly active against various inflammatory and autoimmune diseases.
Biochemical Parameters
The general biochemistry after treatment with the test formulation showed statistically non-significant alterations, which were observed in the following ion panel of parameters across all the treatment groups (G3 to G9) including normal (G1) and D-galactose induced aging group (G2), magnesium, sodium, chloride, potassium, calcium and phosphorus. Besides, the level of creatinine was significantly decreased by 32.14% in the G9 group as compared with the G2 group. However, the detailed analysis of biochemical study after oral administration of Biofield Energy Treated and untreated test formulation are presented in Table 2. The study data showed vital role of Biofield Energy Healing Treatment on test formulation against many inflammatory diseases.
Table 2. Estimation of animal biochemical parameters after treatment with the test formulation.| Group | Magnesium (mg/dL) | Blood Urea (mg/dL) | Creatinine (mg/dL) | Uric Acid (mg/dL) | Calcium (mg/dL) | Phosphorus (mg/dL) | Na+ (Meq/L) | K+(mEq/L) | Cl-(mEq/L) |
| G1 | 4.46 ± 0.07 | 29.05 ± 0.81 | 0.28 ± 0.02 | 0.93 ± 0.12 | 9.69 ± 0.04 | 6.31 ± 0.27 | 144.00 ± 0.87 | 4.83 ± 0.14 | 103.66 ± 1.91 |
| G2 | 4.56 ± 0.06 | 29.05 ± 0.81 | 0.28 ± 0.02 | 1.39 ± 0.19 | 9.73 ± 0.12 | 6.70 ± 0.53 | 146.55 ± 0.74 | 4.76 ± 0.06 | 108.50 ± 2.03 |
| G3 | 4.78 ± 0.06 | 31.53 ± 1.35 | 0.23 ± 0.02 | 0.97 ± 0.16 | 9.66 ± 0.10 | 7.94 ± 0.38 | 145.90 ± 0.91 | 4.81 ± 0.10 | 106.63 ± 2.35 |
| G4 | 4.59 ± 0.06 | 30.38 ± 0.64 | 0.21 ± 0.01 | 1.41 ± 0.17 | 9.80 ± 0.10 | 7.14 ± 0.31 | 144.78 ± 0.95 | 4.86 ± 0.13 | 102.00 ± 1.82 |
| G5 | 4.59 ± 0.08 | 32.96 ± 1.36 | 0.24 ± 0.02 | 1.46 ± 0.30 | 10.08 ± 0.08 | 7.91 ± 0.53 | 144.01 ± 1.10 | 4.80 ± 0.06 | 105.83 ± 2.00 |
| G6 | 4.75 ± 0.07 | 30.53 ± 0.47 | 0.24 ± 0.03 | 1.55 ± 0.20 | 9.80 ± 0.20 | 8.03 ± 0.35 | 147.75 ± 0.66 | 4.89 ± 0.11 | 106.75 ± 1.13 |
| G7 | 4.34 ± 0.10 | 27.70 ± 1.31 | 0.23 ± 0.02 | 1.26 ± 0.16 | 10.56 ± 0.49 | 7.35 ± 0.22 | 145.90 ± 0.69 | 4.79 ± 0.10 | 108.88 ± 1.53 |
| G8 | 4.48 ± 0.10 | 28.70 ± 1.11 | 0.26 ± 0.03 | 1.40 ± 0.24 | 10.65 ± 0.51 | 7.70 ± 0.32 | 146.44 ± 0.64 | 4.86 ± 0.13 | 104.13 ± 1.91 |
| G9 | 4.35 ± 0.08 | 28.99 ± 1.42 | 0.19 ± 0.01 | 1.39 ± 0.23 | 10.00 ± 0.23 | 6.46 ± 0.24 | 147.19 ± 1.01 | 4.96 ± 0.05 | 104.50 ± 1.38 |
Measurement of Glucose and Lipid Biomarkers
Lipid profile analysis after treatment with the Biofield Energy Treated test formulation as per the experimental protocol showed a marginal increase in the HDL level in the group injected with D-galactose (G2) for 8 weeks (16.63 ± 0.94 mg/dL), when compared to the normal control (G1, 14.85 ± 0.73 mg/dL). However, all the treatment groups showed similar levels as of group G2. Besides, marginal increase in LDL level was also noticed in the group injected with D-galactose (G2) for 8 weeks (31.83 ± 1.75 mg/dL), when compared to normal control (G1, 25.79 ± 1.32 mg/dL). However, all the treatment groups showed similar levels as of group G2. Similarly, data suggested that slight increase in cholesterol level in G2 group for 8 weeks (54.67 ± 2.13 mg/dL) when compared to the normal control (G1, 48.11 ± 2.41 mg/dL). However, all the treatment groups showed similar level of group G2. Besides, marginal reduction in the VLDL and triglyceride level was noticed in the group injected with D-galactose (G2) for 8 weeks when compared to normal control. However, all the treatment groups showed similar levels as of G2, except G5 which was higher than Group G2 and almost equal to group G1. All the results have been compiled in Table 3. Therefore, the Biofield Energy Treated test formulation showed altered lipid profile, which can be used against inflammatory diseases. It can be concluded that Biofield Energy Healing Treatment has the capacity to improve the lipid profile that modulates after oral administration of Biofield Energy Treated test formulation, which might suggested its importance in the immunomodulation and its associated disorders.
Table 3. Lipid profile analysis after treatment with the test formulation on male rats.| Group | Glucose(mg/dL) | TC(mg/dL) | Triglyceride (mg/dL) | HDL(mg/dL) | LDL(mg/dL) | VLDL(mg/dL) |
| G1 | 81.99 ± 3.53 | 48.11 ± 2.41 | 35.73 ± 3.98 | 14.85 ± 0.73 | 25.79 ± 1.32 | 8.18 ± 0.93 |
| G2 | 100.59 ± 5.60 | 54.67 ± 2.13 | 32.30 ± 3.09 | 16.63 ± 0.94 | 31.83 ± 1.75 | 5.80 ± 0.61 |
| G3 | 68.13 ± 6.96 | 51.25 ± 3.11 | 30.00 ± 2.05 | 16.10 ± 1.01 | 29.24 ± 2.12 | 5.98 ± 0.41 |
| G4 | 66.01 ± 7.87 | 50.51 ± 2.36 | 29.50 ± 2.44 | 16.48 ± 0.75 | 28.29 ± 1.92 | 5.84 ± 0.49 |
| G5 | 64.84 ± 6.88 | 54.00 ± 2.95 | 37.46 ± 2.07 | 16.29 ± 0.80 | 29.10 ± 1.79 | 7.94 ± 0.59 |
| G6 | 59.06 ± 4.32 | 51.46 ± 2.94 | 29.99 ± 1.74 | 16.88 ± 1.13 | 28.33 ± 1.90 | 6.30 ± 0.45 |
| G7 | 74.26 ± 10.84 | 56.51 ± 2.01 | 31.27 ± 1.88 | 18.46 ± 0.90 | 33.66 ± 2.03 | 6.71 ± 0.59 |
| G8 | 75.35 ± 5.33 | 54.43 ± 2.59 | 25.29 ± 2.50 | 17.80 ± 0.92 | 30.75 ± 1.92 | 5.88 ± 0.95 |
| G9 | 75.11 ± 7.16 | 51.40 ± 3.62 | 31.44 ± 1.96 | 16.26 ± 1.28 | 28.94 ± 2.23 | 6.24 ± 0.39 |
Measurement of Hepatic and Cardiac Biomarkers
The test biomarkers used in hepatic and cardiac biomarkers such as serum glutamate oxaloacetate transaminase (SGOT), serum glutamate pyruvate transaminase (SGPT), alkaline phosphatase (ALP) and cardiac enzyme creatine kinase myocardium band (CK-MB), and others biomarkers such as, total bilirubin, albumin, and globulin showed alterations with respect to other groups, the results are summarized in Table 4. Liver toxicity is defined by the hepatic enzymes, and these are considered as the biomarkers for any infection in liver damage 43. Besides, minerals and vitamins were reported with vital importance against hepatic enzymes with protective effect 44, 45. Statistically non-significant increase in CK-MB level was noticed in the group injected with D-galactose (G2) for 8 weeks (244.83 ± 45.66 U/L) when compared to the normal control (G1, 166.44 ± 32.64 U/L). However, no significant change was observed in all the treatment groups (G3 to G9). Besides, no significant change was observed in other tested biochemical parameters such as TB, TP, A, G and A/G.
Table 4. Evaluation of hepatic biomarkers after treatment with the test formulation on male SD rats.| Group (G) | TB(mg/dL) | SGOT(U/L) | SGPT(U/L) | ALP(U/L) | TP(g/dL) | A(g/dL) | G(g/dL) | A/Gratio | CK-MB(U/L) |
| G1 | 0.10 ± 0.02 | 200.97 ± 20.60 | 46.89 ± 3.00 | 248.61 ± 10.53 | 6.91 ± 0.05 | 3.26 ± 0.05 | 3.65 ± 0.06 | 0.85 ± 0.04 | 166.44 ± 32.64 |
| G2 | 0.12 ± 0.01 | 184.97 ± 17.87 | 45.78 ± 4.22 | 322.09 ± 32.81 | 7.01 ± 0.09 | 3.26 ± 0.03 | 3.75 ± 0.07 | 0.83 ± 0.02 | 244.83 ± 45.66 |
| G3 | 0.11 ± 0.01 | 224.51 ± 11.77 | 47.74 ± 3.32 | 326.69 ± 15.28 | 7.11 ± 0.14 | 3.33 ± 0.06 | 3.79 ± 0.10 | 0.84 ± 0.03 | 257.04 ± 28.46 |
| G4 | 0.11 ± 0.01 | 259.01 ± 9.69 | 53.10 ± 2.41 | 263.63 ± 14.35 | 6.88 ± 0.14 | 3.25 ± 0.05 | 3.63 ± 0.09 | 0.84 ± 0.02 | 301.14 ± 27.72 |
| G5 | 0.14 ± 0.01 | 243.49 ± 10.54 | 50.14 ± 1.93 | 271.60 ± 12.79 | 6.96 ± 0.14 | 3.21 ± 0.05 | 3.75 ± 0.11 | 0.84 ± 0.03 | 287.57 ± 28.16 |
| G6 | 0.12 ± 0.01 | 251.91 ± 9.39 | 48.29 ± 1.99 | 301.16 ± 26.50 | 7.10 ± 0.22 | 3.28 ± 0.06 | 3.83 ± 0.17 | 0.81 ± 0.03 | 278.13 ± 34.79 |
| G7 | 0.12 ± 0.01 | 216.71 ± 15.57 | 44.23 ± 2.25 | 219.23 ± 14.54 | 6.73 ± 0.15 | 3.21 ± 0.06 | 3.51 ± 0.11 | 0.88 ± 0.03 | 235.33 ± 30.74 |
| G8 | 0.11 ± 0.01 | 200.34 ± 18.17 | 48.46 ± 1.97 | 253.40 ± 20.61 | 6.93 ± 0.14 | 3.21 ± 0.06 | 3.71 ± 0.10 | 0.83 ± 0.02 | 223.86 ± 53.12 |
| G9 | 0.12 ± 0.01 | 210.21 ± 17.45 | 45.06 ± 1.60 | 253.91 ± 13.95 | 6.65 ± 0.18 | 3.20 ± 0.06 | 3.45 ± 0.14 | 0.90 ± 0.04 | 213.47 ± 32.28 |
Estimation of Animal Weight Parameters and Feed Intake
The test formulation was tested in animals with respect to weight parameters, feed intake, and histopathology against Biofield Energy Treated and untreated test formulation. The results of animal tested organ weight parameters are summarized in the Table 5. The study data suggested that the initial and final weight were changed as per normal physiology pattern. In addition, the relative organ weight parameters did not show any significant change in the tested organ weight throughout the experiment in liver, lungs, kidneys, brain, heart, eyes, spleens, pancreas, thymus, adrenal gland, small intestine, large intestine, testis, prostrate, epididymis, and vas deference. Relative organ weight of rats treated with the Biofield Energy Treatment per se, reference compound, different combination of the Biofield Energy Treated and untreated test formulation to the Biofield Energy and untreated to the D-galactose induced animals were estimated. Organ to body weight ratio is the valuable index for any experimental test procedure with respect to the documentation of swelling, atrophy, or hypertrophy after exposure of test samples 46. All the data concluded that no direct cellular constriction and any associated inflammation, which suggested the safe treatment strategy. Overall, the animal weight data, relative organ weight, along with feed intake data suggest no significant change with respect to the disease control group, it suggest that Biofield Energy Treated test formulation and Biofield Energy Treatment per se were found safe in all the tested animals.
Table 5. Effect of the test formulation on organ weight parameters of male SD rats.| Relative weight (%) | G1 | G2 | G3 | G4 | G5 | G6 | G7 | G8 | G9 |
| Liver | 2.68 ± 0.17 | 2.58 ± 0.12 | 2.54 ± 0.08 | 2.66 ± 0.15 | 2.76 ± 0.18 | 2.50 ±0.19 | 2.60 ±0.14 | 2.41 ±0.09 | 2.82 ±0.17 |
| Lungs | 0.61 ± 0.05 | 0.53 ± 0.08 | 0.46 ± 0.05 | 0.52 ± 0.02 | 0.53 ± 0.03 | 0.48 ±0.02 | 0.51 ±0.01 | 0.55 ±0.04 | 0.53 ±0.05 |
| Kidney | 0.74 ± 0.02 | 0.73 ± 0.01 | 0.74 ± 0.02 | 0.76 ± 0.03 | 0.74 ± 0.02 | 0.71 ±0.02 | 0.74 ±0.02 | 0.72 ±0.02 | 0.77 ±0.05 |
| Brain | 0.47 ± 0.02 | 0.49 ± 0.01 | 0.50 ± 0.01 | 0.53 ± 0.02 | 0.49 ± 0.02 | 0.44 ±0.02 | 0.49 ±0.01 | 0.49 ±0.02 | 0.48 ±0.02 |
| Heart | 0.31 ± 0.01 | 0.31 ± 0.01 | 0.30 ± 0.01 | 0.31 ± 0.01 | 0.31 ± 0.01 | 0.29 ±0.01 | 0.34 ±0.04 | 0.31 ±0.01 | 0.31 ±0.01 |
| Eyes | 0.09 ± 0.01 | 0.08 ± 0.00 | 0.09 ± 0.00 | 0.09 ± 0.00 | 0.08 ± 0.00 | 0.09 ±0.02 | 0.08 ±0.01 | 0.08 ±0.01 | 0.07 ±0.00 |
| Spleen | 0.17 ± 0.01 | 0.21 ± 0.04 | 0.17 ± 0.01 | 0.18 ± 0.01 | 0.19 ± 0.01 | 0.16 ±0.01 | 0.18 ±0.01 | 0.19 ±0.01 | 0.17 ±0.01 |
| Pancreas | 0.33 ± 0.02 | 0.26 ± 0.03 | 0.32 ± 0.01 | 0.30 ± 0.02 | 0.30 ± 0.02 | 0.28 ±0.03 | 0.27 ±0.02 | 0.29 ±0.01 | 0.26 ±0.02 |
| Thymus | 0.08 ± 0.01 | 0.09 ± 0.01 | 0.10 ± 0.01 | 0.08 ± 0.01 | 0.08 ± 0.01 | 0.07 ±0.01 | 0.08 ±0.01 | 0.08 ±0.01 | 0.08 ±0.01 |
| Adrenal Gland | 0.02 ± 0.00 | 0.02 ± 0.00 | 0.01 ± 0.00 | 0.02 ± 0.00 | 0.02 ± 0.00 | 0.02 ±0.00 | 0.02 ±0.00 | 0.02 ±0.00 | 0.02 ±0.00 |
| Small Intestine | 2.03 ± 0.06 | 1.82 ± 0.05 | 1.97 ± 0.03 | 1.98 ± 0.03 | 1.96 ± 0.05 | 1.79 ±0.04 | 1.90 ±0.05 | 1.84 ±0.05 | 1.82 ±0.06 |
| Large Intestine | 1.48 ± 0.08 | 1.61 ± 0.10 | 1.63 ± 0.13 | 1.45 ± 0.06 | 1.70 ± 0.10 | 1.33 ±0.10 | 1.63 ±0.12 | 1.55 ±0.05 | 1.79 ±0.11 |
| Testis | 0.76 ± 0.03 | 0.75 ± 0.03 | 0.78 ± 0.03 | 0.79 ± 0.02 | 0.80 ± 0.03 | 0.74 ±0.03 | 0.81 ±0.05 | 0.76 ±0.02 | 0.77 ±0.03 |
| Prostrate | 0.16 ± 0.02 | 0.19 ± 0.03 | 0.16 ± 0.02 | 0.15 ± 0.01 | 0.14 ± 0.01 | 0.13 ±0.01 | 0.16 ±0.02 | 0.14 ±0.01 | 0.14 ±0.01 |
| Epididymis | 0.37 ± 0.01 | 0.37 ± 0.03 | 0.39 ± 0.01 | 0.38 ± 0.01 | 0.37 ± 0.01 | 0.35 ±0.01 | 0.41 ±0.02 | 0.38 ±0.02 | 0.40 ±0.01 |
| Vas Deference | 0.07 ± 0.00 | 0.08 ± 0.01 | 0.08 ± 0.01 | 0.08 ± 0.00 | 0.08 ± 0.01 | 0.08 ±0.00 | 0.08 ±0.01 | 0.07 ±0.01 | 0.09 ±0.01 |
Histopathological Findings
Masson’s Trichrome Staining of Skin
Histopathological findings of skin was evaluated for collagen deposition by Masson’s Trichrome staining for all the groups (G1 – G9), rats treated with Biofield Energy per se, reference compound, different combination of Biofield Energy Treated and untreated test formulation to the Biofield Energy Treated and untreated D-galactose induced animals. Skin at 8 weeks of D-galactose injected animals from Group G2, resulted in decreased intensity of collagen dermal fibre (Score: 1.63 ± 0.42) when compared to normal control G1 (Score: 0.0 ± 0.0). However, all the treatment groups (G3 – G9) showed decreased pattern of score to indicate prevention of degradation of dermal collagen fibre.
H&E Staining of Tissues
Histopathological findings of all the organs were evaluated for cellular changes by H&E staining for all the groups (G1 – G9), rats treated with Biofield Energy per se, reference compound, different combination of Biofield Energy Treated and untreated test formulation to the Biofield Energy Treated and untreated D-galactose induced animals. Findings of histology are presented in Figure 3. The lesions found in the brain (Neuronal apoptosis in hippocampus) and skin (decreased density of dermal collagen fibers) was related to D-galactose treatment. With respect to brain lesion, 50% of the animals in G3, 29% of the animals in G5 and 21% of the animals in G3 showed significant signs of recovery when compared to the disease control G2 group. With respect to skin lesion, 92% of the animals in G4, 69% of the animals in G8, 46% of the animals in G6, 38% of the animals in G3, G5 and G7, and 9% of the animals in G9 showed signs of recovery when compared to the disease control G2 group. In addition, all the other findings recorded in various organs of experimental animals were mostly non-specific, infrequent and minimal to moderate in nature. Moreover, the rates of occurrence of the findings recorded in treated groups were either very low or comparable to the concurrent vehicle control group. Hence, all these findings could be considered as spontaneous or incidental in nature, representing the normal physiological/metabolic or congenital changes encountered in rats of this age
Figure 3. Histopathology findings of overall all tissues and skin histology scoring using Masson Trichrome staining after treatment with the test formulation. G1: Normal control; G2: Disease control (Aging Control D-galactose (500 mg/kg, i.p.)); G3: Resveratrol, 200 mg/kg; G4: Untreated test formulation; G5: Biofield Energy Treated test formulation; G6: Biofield treatment per se to animals (-15 Days); G7: Biofield Energy Treated test formulation (-15 Day); G8: Biofield Energy Treatment per se to animals plus Biofield Energy Treated test formulation (-15 Day); and G9: Biofield Energy Treatment per se to animals plus untreated test formulation.
Download figure
Thus, the histological results did not showed any abnormal findings, which suggested the safe animal profile with the test formulation, which showed no toxic implications of the test formulation and treatment. With the above results, it can be concluded that the Biofield Energy Treatment per se and the test formulation was found safe and non-toxic.
Conclusions
The experimental data suggested significant activity of Biofield Energy Treated/Blessed (the Trivedi Effect®) test formulation for their significant immunomodulatory activity. Based on the current study findings, cellular and humoral immune response was significantly improved. The level of IgG was significantly increased by 2.18%, 10.70%, and 8.03% in the G5, G6, and G8 groups, while IgE was significantly increased by 7.83% and 5.79% in G5 and G8 groups, respectively after Biofield Energy Treatment as compared with untreated test formulation. Blood profile data showed that the platelet count was increased in the G5, G6, G7, G8, and G9 by 40.69%, 27.95%, 26.67%, 38.58%, and 28.28%, respectively compared with the G2 group. Creatinine level was significant decreased by 32.14% in the G9 group as compared with the G2 group. However, animal body weight, feed intake, relative organ weight, and histopathological findings of all the tested groups did not showed any abnormal findings with respect to the safe and non-toxic treatment strategies. Thus, the present study concluded that the novel test formulation and the Trivedi Effect®-Biofield Energy Healing remotely to the animals significantly enhanced the test formulation’s immunomodulatory and antiaging activities. Therefore, the Biofield Energy Treated test formulation and animals per se may act as an effective anti-inflammatory and immunomodulatory product, and it can be used as a Complementary and Alternative Medicine (CAM) with a safe therapeutic index for various autoimmune disorders such as systemic lupus erythematosus, fibromyalgia, Addison disease, Hashimoto thyroiditis, celiac disease (gluten-sensitive enteropathy), dermatomyositis, multiple sclerosis, Graves’ disease, myasthenia gravis, pernicious anemia, aplastic anemia, scleroderma, psoriasis, rheumatoid arthritis, reactive arthritis, type 1 diabetes, Sjogren syndrome, Crohn’s disease, vasculitis, vitiligo, chronic fatigue syndrome and alopecia areata, as well as inflammatory disorders such as irritable bowel syndrome (IBS), asthma, ulcerative colitis, Alzheimer’s disease, Parkinson’s disease, atherosclerosis, dermatitis, hepatitis, and diverticulitis. Further, the Biofield Energy Healing Treated/Blessed test formulation can also be used in the prevention of immune-mediated tissue damage in cases of organ transplants (for example heart transplants, kidney transplants, and liver transplants), for anti-aging, stress prevention and management, and in the improvement of overall health and Quality of Life (QoL).
References
- 1.Litchfield P, Cooper C, Hancock C, Watt P. (2016) . Work and Wellbeing in the 21stCentury. Tchounwou PB, ed. International Journal of Environmental Research and Public Health 13(11), 1065.
- 4.Archana S J, Paul R, Tiwari A. (2011) Indian medicinal plants: A rich source of natural immuno-modulator. , Int J Pharmacol 7, 198-205.
- 5.Fusco D, Colloca G, MRL Monaco, Cesari M. (2007) Effects of antioxidant supplementation on the aging process. , Clin Interv Aging 2, 377-387.
- 6.Pizzino G, Irrera N, Cucinotta M, Pallio G, Mannino F et al. (2017) Oxidative stress: Harms and benefits for human health. Oxid Med Cell Longev. 8416763.
- 7.Wintergerst E S, Maggini S, Hornig D H. (2007) Contribution of selected vitamins and trace elements to immune function. , Ann Nutr Metab 51, 301-323.
- 8.Karacabey K, Ozdemir N. (2012) The effect of nutritional elements on the immune system. , J Obes Wt Loss Ther 2, 152.
- 9.Lebish I J, Moraski R M. (1987) Mechanisms of immunomodulation by drugs. , Toxicol Pathol 15(3), 338-345.
- 10.Movaffaghi Z, Farsi M. (2009) Biofield therapies: Biophysical basis and biological regulations. , Complement Ther Clin Pract 15, 35-37.
- 11.Barnes P M, Powell-Griner E, McFann K, Nahin R L. (2004) Complementary and alternative medicine use among adults: United States. , Adv Data 343, 1-19.
- 12.Barnes P M, Bloom B, Nahin R L. (2008) Complementary and alternative medicine use among adults and children: United States. , Natl Health Stat Report 12, 1-23.
- 13.Fan K wai. (2005) National center for complementary and alternative medicine website. , J Med Libr Assoc 93, 410-412.
- 14.Trivedi M K, Tallapragada R M. (2008) A transcendental to changing metal powder characteristics. , Met Powder Rep 63, 22-28.
- 15.Trivedi M K, Nayak G, Patil S, Tallapragada R M, Latiyal O. (2015) Studies of the atomic and crystalline characteristics of ceramic oxide nano powders after bio field treatment. , Ind Eng Manage 4, 161.
- 16.Trivedi M K, Nayak G, Patil S, Tallapragada R M, Latiyal O et al. (2015) Effect of biofield energy treatment on physical and structural properties of calcium carbide and praseodymium oxide. , International Journal of Materials Science and Applications 4, 390-395.
- 17.Trivedi M K, Branton A, Trivedi D, Nayak G, Mondal S C et al. (2015) Morphological characterization, quality, yield and DNA fingerprinting of biofield energy treated alphonso mango (Mangifera indicaL.). , Journal of Food and Nutrition Sciences 3, 245-250.
- 18.Trivedi M K, Branton A, Trivedi D, Nayak G, Mondal S C et al. (2015) Evaluation of biochemical marker – Glutathione and DNA fingerprinting of biofield energy treatedOryza sativa. , American Journal of BioScience 3, 243-248.
- 19.Trivedi M K, Branton A, Trivedi D, Nayak G, Charan S et al. (2015) Phenotyping and 16S rDNA analysis after biofield treatment onCitrobacterbraakii: A urinary pathogen. , J Clin Med Genom 3, 129.
- 20.Trivedi M K, Patil S, Shettigar H, Mondal S C, Jana S. (2015) Evaluation of biofield modality on viral load of Hepatitis B and C viruses. , J Antivir Antiretrovir 7, 083-088.
- 21.Trivedi M K, Patil S, Shettigar H, Mondal S C, Jana S. (2015) An impact of biofield treatment: Antimycobacterial susceptibility potential using BACTEC 460/MGIT-TB System. , Mycobact Dis 5, 189.
- 22.Trivedi M K, Patil S, Shettigar H, Bairwa K, Jana S. (2015) Phenotypic and biotypic characterization ofKlebsiellaoxytoca: An impact of biofield treatment. , J Microb Biochem Technol 7, 203-206.
- 23.Nayak G, Altekar N. (2015) Effect of biofield treatment on plant growth and adaptation. , J Environ Health Sci 1, 1-9.
- 24.Branton A, Jana S. (2017) The influence of energy of consciousness healing treatment on low bioavailable resveratrol in maleSprague Dawleyrats. , International Journal of Clinical and Developmental Anatomy 3, 9-15.
- 25.Branton A, Jana S. (2017) The use of novel and unique biofield energy healing treatment for the improvement of poorly bioavailable compound, berberine in maleSprague Dawleyrats. , American Journal of Clinical and Experimental Medicine 5, 138-144.
- 26.Branton A, Jana S. (2017) Effect of the biofield energy healing treatment on the pharmacokinetics of 25-hydroxyvitamin D3[25(OH)D3] in rats after a single oral dose of vitamin D3. , American Journal of Pharmacology and Phytotherapy 2, 11-18.
- 27.Kinney J P, Trivedi M K, Branton A, Trivedi D, Nayak G et al. (2017) Overall skin health potential of the biofield energy healing based herbomineral formulation using various skin parameters. , American Journal of Life Sciences 5, 65-74.
- 28.Singh J, Trivedi M K, Branton A, Trivedi D, Nayak G et al. (2017) Consciousness energy healing treatment based herbomineral formulation: A safe and effective approach for skin health. , American Journal of Pharmacology and Phytotherapy 2, 1-10.
- 29.Trivedi M K, Branton A, Trivedi D, Nayak G, Plikerd W D et al. (2017) A systematic study of the biofield energy healing treatment on physicochemical, thermal, structural, and behavioral properties of magnesium gluconate. , International Journal of Bioorganic Chemistry 2, 135-145.
- 30.Trivedi M K, Branton A, Trivedi D, Nayak G, Plikerd W D et al. (2017) Chromatographic and spectroscopic characterization of the consciousness energy healing treatedWithaniasomnifera(ashwagandha) root extract. , European Journal of Biophysics 5, 38-47.
- 31.Trivedi M K, Patil S, Shettigar H, Mondal S C, Jana S. (2015) The potential impact of biofield treatment on human brain tumor cells: A time-lapse video microscopy. , J Integr Oncol 4, 141.
- 32.Trivedi M K, Patil S, Shettigar H, Gangwar M, Jana.S (2015)In vitroevaluation of biofield treatment on cancer biomarkers involved in endometrial and prostate cancer cell lines. , J Cancer Sci Ther 7, 253-257.
- 33.Anagnos D, Trivedi K, Branton A, Trivedi D, Nayak G et al. (2018) Influence of biofield treated vitamin D3on proliferation, differentiation, and maturation of bone-related parameters in MG-63 cell-line. , International Journal of Biomedical Engineering and Clinical Science 4, 6-14.
- 34.Lee A C, Trivedi K, Branton A, Trivedi D, Nayak G et al. (2018) The potential benefits of biofield energy treated vitamin D3on bone mineralization in human bone osteosarcoma cells (MG-63). , International Journal of Nutrition and Food Sciences 7, 30-38.
- 35.Stutheit M E, Trivedi K, Branton A, Trivedi D, Nayak G et al. (2018) Biofield energy treated vitamin D3: Therapeutic implication on bone health using osteoblasts cells. , American Journal of Life Sciences 6, 13-21.
- 36.Mora J R, Iwata M, von Andrian UH. (2008) Vitamin effects on the immune system: Vitamins A and D take centre stage. , Nature reviews Immunology 8(9), 685-698.
- 37.Martins I J. (2016) Anti-aging genes improve appetite regulation and reverse cell senescence and apoptosis in global populations. , Advances in Aging Research 5, 9-26.
- 38.Martins I J. (2017) Single gene inactivation with implications to diabetes and multiple organ dysfunction syndrome. , J Clin Epigenet 3(3), 24.
- 39.Martins I J. (2018) Heat shock gene inactivation and protein aggregation with links to chronic diseases. , Diseases 6(2), 39.
- 40.Martins I J. (2019) Body temperature regulation determines immune reactions and species longevity. In: Asea A., Kaur P. (eds) Heat Shock Proteins in Neuroscience. Heat Shock Proteins, vol 20. , Cham
- 41.Uppal S S, Verma S, Dhot P S. (2003) Normal values of CD4 and CD8 lymphocyte subsets in healthy Indian adults and the effects of sex, age, ethnicity, and smoking. , Cytometry B Clin Cytom 52, 32-36.
- 42.Miceli M C, Parnes J R. (1991) . The roles of CD4 and CD8 in T cell activation. Semin Immunol 3, 133-141.
- 43.Sidhu P, Garg M L, Dhawan D K. (2005) Protective effects of zinc on oxidative stress enzymes in liver of protein-deficient rats. , Drug Chem Toxicol 28, 211-230.
- 44.El-Boshy M E, Risha E F, Abdelhamid F M, Mubarak M S, Hadda T B. (2015) Protective effects of selenium against cadmium induced hematological disturbances, immunosuppressive, oxidative stress and hepatorenal damage in rats. , J Trace Elem Med Biol 29, 104-110.