Abstract
Objectives:
To clarify the role of trace elements in the etiology and the pathogenesis of the chondrosarcoma, a non-destructive neutron activation analysis with high resolution spectrometry of long-lived radionuclides were performed.
Methodology:
The silver (Ag), cobalt (Co), chromium (Cr), iron (Fe), mercury (Hg), rubidium (Rb), antimony (Sb), selenium (Se), and zinc (Zn)mass fractions and Co/Zn, Cr/Zn, Fe/Zn, Hg/Zn, Sb/Zn, Co/Rb, Cr/Rb, Fe/Rb, Hg/Rb, Sb/Rb, and Se/Rb mass fraction ratios were estimated in normal bone samples from 27 patients with intact bone (12 females and 15 males, aged from 16 to 49 years), who had died from various non bone related causes, mainly unexpected from trauma, and in tumor samples, obtained from open biopsies or after operation of 16 patients with chondrosarcoma ((3 females and 13 males, 8 to 65 years old). The reliability of difference in the results between intact bone and chondrosarcoma tissues was evaluated by Student’s t-test.
Key Results:
In the chondrosarcoma tissue the mass fractions of Co, Fe, and Se are significantly higher while the mass fraction of Rb is lower than in normal bone tissues. Moreover, significantly higher Co/Zn, Fe/Zn, Co/Rb, Cr/Rb, Fe/Rb, Sb/Rb, and Se/Rb mass fraction ratios are typical of the chondrosarcoma tissue compared to intact bone. In the chondrosarcoma tissue many correlations between trace elements found in the control group was no longer evident.
Major Conclusions:
In chondrosarcoma transformed bone tissues the trace element homeostasis is significantly disturbed.
Author Contributions
Academic Editor: Krzysztof Roszkowski, Department of Radiotherapy, the F. Lukaszczyk Oncology Center, Bydgoszcz, PL; Chair of Gynecology, Oncology and Gynecological Nursing, Collegium Medicum, Nicolaus Copernicus University, PL
Checked for plagiarism: Yes
Review by: Single-blind
Copyright © 2015 Vladimir Zaichick, et al.
 This is an open-access article distributed under the terms of the Creative Commons Attribution License, which permits unrestricted use, distribution, and reproduction in any medium, provided the original author and source are credited.
Competing interests
The authors have declared that no competing interests exist.
Citation:
Introduction
The roles of trace elements in the development and inhibition of cancer have a complex character and have risen many questions because of their essential and toxic effects on human health. The effects of trace elements are related to content and recorded observations range from a deficiency state, to function as biologically essential components, to an unbalance when excess of one element interferes with the function of another, to pharmacologically active doses, and finally to toxic and even life-threatening levels.1, 2 Thus, in normal environmental and health conditions there is a trace element homeostasis in tissues and fluids of human body and an unbalance of trace element contents could be a causative factor for many diseases, including cancer.2
It is well known that the tissues of human body differ greatly in their contents of trace elements. Our detailed previous studies have shown this using a chemical composition analysis of bone tissue.3, 4, 5, 6, 7, 8, 9, 10, 11, 12, 13, 14, 15, 16, 17, 18, 19, 20, 21, 22, 23, 24, 25, 26, 27, 28, 29 Bone tumors form a heterogeneous group of benign or malignant neoplastic diseases since they can derive from all the tissue components of bone (cartilage, osteoid, fibrous tissue, and bone marrow elements). Each tissue can be subject to inflammation, benign or malignant tumors.
Chondrosarcoma is the second most common primary bone cancer, whose tumor cells produce a pure hyaline cartilage that results in abnormal bone and/or cartilage growth. About one fourth of malignant bone cancers are chondrosarcoma. Although any bone can be affected, the long bones such as legs, arms, fingers, toes are most commonly involved. Chondrosarcoma is typically seen in adulthood between the ages of late 20 to 60 and occurs more commonly in men than women.30, 31
No single morphologic or functional imaging method provides findings for a specific diagnosis of chondrosarcoma, but the results do contribute to tumor staging. Therefore, obtaining a histologic specimen of the lesion in all patients is essential in recognizing this tumor and planning therapy. However, histological examination of bone tumors is one of the most difficult subjects in pathology.32It is the reason, why molecular techniques to assist in distinguishing among the various types of bone tumors are being developed, but these techniques have not yielded any clinically significant contribution.30
To our knowledge, no data are available for the trace element contents of chondrosarcoma, to permit conclusion about their role in malignant transformation or pathogenesis, and also about their usefulness as the tumor’s markers.
The aim of the study was to compare and to correlate the trace element mass fractions and the mass fraction ratios of selected traceelement in two groups of samples (normal bone and chondrosarcoma tissue). For this purpose, the silver (Ag), cobalt (Co), chromium (Cr), iron(Fe), mercury (Hg), rubidium (Rb), antimony (Sb), selenium (Se), and zinc (Zn) contents were determined in the two groups of samples using nondestructive instrumental neutron activation analysis (INAA) with high resolution spectrometry of long-lived radionuclides (INAA-LLR).
The study was approved by the Ethical Committee of the Medical Radiological Research Center, Obninsk.
Materials and Methods
Thirty-three children, adolescents and adults were included in this study. The subjects were divided into two groups: control and chondrosarcoma. The control group consisted of 27 patients with intact bone (12 females and 15 males, aged from 16 to 49 years, M±SEM 34.1±2.1 years) who had died from various non bone related causes, mainly unexpected from trauma. The intact cortical bone samples of femur, femoral neck, tibia and iliac crest were collected at the Department of Pathology, Obninsk City Hospital. Samples from 16 patients with chondrosarcoma (3 females and 13 males, 8 to 65 years old, M±SEM 34.6±4.6 years) were obtained from open biopsies or after operation from resected specimens. All patients with bone diseases were hospitalized at the Medical Radiological Research Centre. In all cases the diagnosis was confirmed by clinical and histological data.
A titanium tool was used to cut and to scrape samples33, 34. All bone and tumor tissue samples were freeze dried, until constant mass was obtained, and homogenized. Then samples weighing about 100 mg were wrapped separately in high-purity aluminum foil washed with rectified alcohol beforehand and placed in a nitric acid-washed quartz ampoule.
To determine contents of the elements by comparison with a known standard, biological synthetic standards (BSS) prepared from phenol–formaldehyde resins and aliquots of commercial, chemically pure compounds were used.Corrected certified values of BSS element contents were reported by us before.35 Ten certified reference material (CRM) IAEA H-5 (Animal Bone) sub-samples and ten standard reference material (SRM) NIST 1486 (Bone Meal) sub-samples weighing about 100 mg were analyzed in the same conditions as bone and tumor samples to estimate the precision and accuracy of the results.
A vertical channel of the WWR-c research nuclear reactor was applied to determine the mass fraction of Ag, Co, Cr, Fe, Hg, Rb, Sb, Se, and Zn by INAA-LLR. The quartz ampoule with bone samples, tumor samples, standards, CRM, and SRM was soldered, positioned in a transport aluminum container and exposed to a 100-hour neutron irradiation in a vertical channel with a thermal neutron flux about 1013 n×cm-2×s-1. Two months after irradiation the samples were reweighed and repacked. The duration of each measurement was from 1 to 10 hours. To reduce the high intensity of32 P b-particles (T1/2=14.3 d) background, a berillium filter was used. A coaxial 98 cm3 Ge (Li) detector and a spectrometric unit (NUC 8100), including a PC-coupled multichannel analyzer, were used for measurements. The spectrometric unit provided 2.9 keV resolution at the 60Co 1332 keV line. The information of used nuclear reactions, radionuclides, gamma-energies, and other details of the analysis including the quality control of results were reported by us before.22, 24, 25, 26
A dedicated computer program of INAA mode optimization was used37. Using the Microsoft Office Excel programs, the summary of statistics, arithmetic mean, standard deviation, standard error of mean, minimum and maximum values, median, percentiles with 0.025 and 0.975 levels were calculated for different trace element mass fractions and their selected combinations. The reliability of difference in the results between intact bone and chondrosarcoma tissue was evaluated by Student’s t-test. For the estimation of the Pearson correlation coefficient between different pairs of the trace element mass fractions in intact bone and chondrosarcoma tissue the Microsoft Office Excel program was also used.
Results
Figure 1. shows individual data sets for Ag, Co, Cr, Fe, Hg, Rb, Sb, Se, and Zn mass fractions (mg/kg, dry mass basis) in all samples of intact bone (1) and chondrosarcoma (2) Tissue type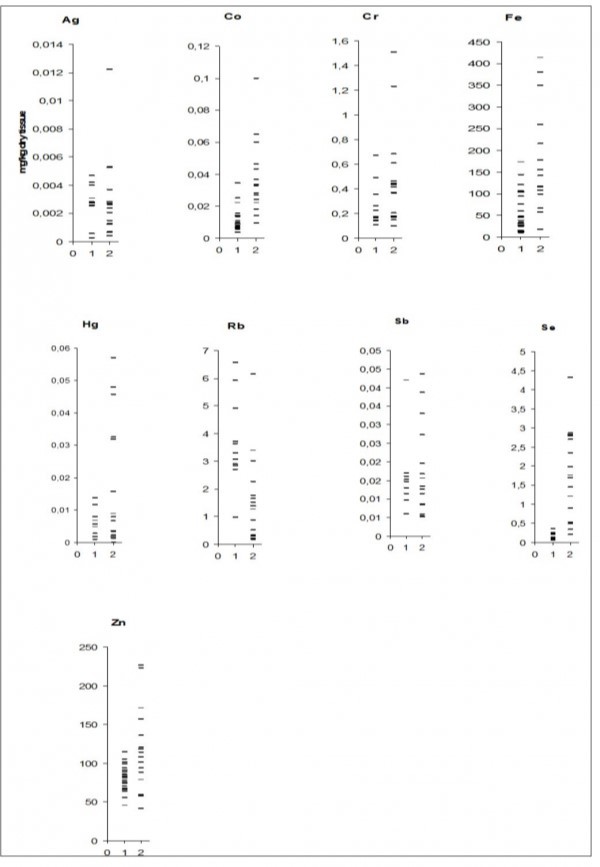
Table 1 depicts the basic statistical parameters (arithmetic mean, standard deviation, standard error of mean, minimal and maximal values, median, percentiles with 0.025 and 0.975 levels) for the Ag, Co, Cr, Fe, Hg, Rb, Sb, Se, and Zn mass fraction in intact bone and chondrosarcoma tissue.
Table 1. Basic statistical parameters for Al, Co, Cr, Fe, Hg, Rb, Sb, Se, and Zn mass fractions (mg/kg, dry mass basis) in tissue of intact bone and chondrosarcoma| E | M | SD | SEM | Min | Max | Med | P0.025 | P0.975 |
| Intact bone, n=27 | ||||||||
| Ag | 0.0027 | 0.0015 | 0.0005 | 0.00026 | 0.0047 | 0.0028 | 0.00032 | 0.0046 |
| Co | 0.0107 | 0.0070 | 0.0014 | 0.00370 | 0.0345 | 0.0079 | 0.00464 | 0.0288 |
| Cr | 0.274 | 0.182 | 0.057 | 0.110 | 0.669 | 0.202 | 0.117 | 0.629 |
| Fe | 51.2 | 46.3 | 9.3 | 9.20 | 173 | 30.2 | 9.68 | 155 |
| Hg | 0.0057 | 0.0044 | 0.0014 | 0.00100 | 0.0138 | 0.0052 | 0.0010 | 0.0133 |
| Rb | 3.68 | 1.58 | 0.48 | 0.970 | 6.57 | 3.30 | 1.40 | 6.41 |
| Sb | 0.0151 | 0.0102 | 0.0032 | 0.00600 | 0.0420 | 0.0139 | 0.00600 | 0.0364 |
| Se | 0.176 | 0.092 | 0.029 | 0.0550 | 0.358 | 0.169 | 0.0633 | 0.336 |
| Zn | 80.6 | 15.4 | 3.0 | 45.4 | 115 | 82.1 | 51.7 | 109 |
| Chondrosarcoma, n=16 | ||||||||
| Ag | 0.0030 | 0.0029 | 0.00072 | 0.00043 | 0.0122 | 0.0025 | 0.00051 | 0.0096 |
| Co | 0.0365 | 0.0236 | 0.0061 | 0.00950 | 0.0998 | 0.0282 | 0.0111 | 0.0876 |
| Cr | 0.483 | 0.386 | 0.097 | 0.0980 | 1.51 | 0.416 | 0.116 | 1.41 |
| Fe | 178 | 126 | 34 | 16.5 | 413 | 129 | 29.8 | 402 |
| Hg | 0.0172 | 0.0192 | 0.0048 | 0.00007 | 0.0571 | 0.0080 | 0.00051 | 0.0537 |
| Rb | 1.56 | 1.58 | 0.40 | 0.170 | 6.15 | 1.33 | 0.170 | 5.11 |
| Sb | 0.0171 | 0.0122 | 0.0031 | 0.00510 | 0.0437 | 0.0130 | 0.00518 | 0.0418 |
| Se | 1.78 | 1.19 | 0.31 | 0.203 | 4.32 | 1.70 | 0.251 | 3.81 |
| Zn | 118 | 56 | 14 | 41.7 | 226 | 108 | 47.4 | 225 |
The ratio of means and the reliability of difference between mean values of Al, Co, Cr, Fe, Hg, Rb, Sb, Se, and Zn mass fractions in tissue of intact bone and chondrosarcoma are presented in Table 2.
Table 2. Means (M±SEM, mg/kg, dry mass basis), ratio of means and the reliability of difference between mean values of Al, Co, Cr, Fe, Hg, Rb, Sb, Se, and Zn mass fractions in tissue of intact bone and chondrosarcoma| Element | Intact boneM1 | Chondrosarcoma M2 | M2 / M1Ratio | Student’s t-test |
| Ag | 0.0027±0.0005 | 0.0030±0.0007 | 1.08 | p ≤ 0.85 |
| Co | 0.0107±0.0014 | 0.0365±0.0061 | 3.41 | p ≤ 0.0022 |
| Cr | 0.274±0.057 | 0.483±0.097 | 1.76 | p ≤ 0.155 |
| Fe | 51.2±9.3 | 178±34 | 3.48 | p ≤ 0.0055 |
| Hg | 0.0057±0.0014 | 0.0172±0.0048 | 3.02 | p ≤ 0.128 |
| Rb | 3.68±0.48 | 1.56±0.40 | 0.42 | p ≤ 0.00076 |
| Sb | 0.0151±0.0032 | 0.0171±0.0031 | 1.13 | p ≤ 0.575 |
| Se | 0.176±0.029 | 1.78±0.31 | 10.1 | p ≤ 0.00069 |
| Zn | 80.6±3.0 | 118±14 | 1.46 | p ≤ 0.0775 |
Table 3 represents the basic statistical parameters for Co/Zn, Cr/Zn, Fe/Zn, Hg/Zn, Sb/Zn, Co/Rb, Cr/Rb, Fe/Rb, Hg/Rb, Sb/Rb, and Se/Rb mass fractions ratios in the samples of intact bone and chondrosarcoma.
Table 3. Basic statistical parameters for Co/Zn, Cr/Zn, Fe/Zn, Hg/Zn, Sb/Zn, Co/Rb, Cr/Rb, Fe/Rb, Hg/Rb, Sb/Rb, and Se/Rb mass fractions ratios in tissue of intact bone and chondrosarcoma| Mass fractions ratio | M | SD | SEM | Min | Max | Med | P0.025 | P0.975 |
| Intact bone, n=27 | ||||||||
| (Co/Zn)×103 | 0.14 | 0.088 | 0.017 | 0.053 | 0.40 | 0.10 | 0.0593 | 0.364 |
| (Cr/Zn)×103 | 2.94 | 1.78 | 0.56 | 1.57 | 6.37 | 2.07 | 1.59 | 6.27 |
| Fe/Zn | 0.69 | 0.74 | 0.15 | 0.098 | 3.15 | 0.33 | 0.120 | 2.48 |
| (Hg/Zn)×104 | 0.65 | 0.48 | 0.15 | 0.099 | 1.37 | 0.59 | 0.0995 | 1.36 |
| (Sb/Zn)×103 | 0.17 | 0.11 | 0.034 | 0.072 | 0.45 | 0.13 | 0.0753 | 0.393 |
| (Co/Rb)×102 | 0.61 | 0.99 | 0.30 | 0.13 | 3.56 | 0.25 | 0.144 | 2.87 |
| (Cr/Rb)×101 | 0.79 | 0.41 | 0.13 | 0.24 | 1.47 | 0.74 | 0.269 | 1.45 |
| Fe/Rb | 29 | 51 | 15 | 2.49 | 178 | 10.8 | 2.75 | 142 |
| (Hg/Rb)×103 | 2.3 | 3.5 | 1.1 | 0.30 | 12.1 | 1.23 | 0.308 | 9.84 |
| (Sb/Rb)×103 | 5.2 | 4.9 | 1.6 | 1.48 | 16.6 | 3.52 | 1.52 | 15.4 |
| (Se/Rb)×102 | 7.2 | 10.6 | 3.3 | 2.04 | 36.9 | 3.45 | 2.28 | 30.4 |
| Chondrosarcoma, n=16 | ||||||||
| (Co/Zn)×103 | 0.35 | 0.30 | 0.077 | 0.080 | 1.04 | 0.28 | 0.0960 | 1.03 |
| (Cr/Zn)×103 | 4.61 | 3.65 | 0.91 | 0.85 | 13.2 | 3.22 | 0.927 | 12.2 |
| Fe/Zn | 1.79 | 1.66 | 0.41 | 0.28 | 6.42 | 1.31 | 0.372 | 5.76 |
| (Hg/Zn)×104 | 1.35 | 1.53 | 0.38 | 0.008 | 6.08 | 0.87 | 0.0689 | 4.81 |
| (Sb/Zn)×103 | 0.18 | 0.19 | 0.046 | 0.043 | 0.79 | 0.09 | 0.0474 | 0.614 |
| (Co/Rb)×102 | 5.3 | 5.6 | 1.4 | 0.46 | 21.5 | 3.24 | 0.553 | 18.3 |
| (Cr/Rb)×101 | 10.0 | 21.6 | 5.4 | 0.61 | 88.8 | 3.42 | 0.645 | 63.5 |
| Fe/Rb | 266 | 293 | 73 | 22.9 | 1047 | 149 | 25.2 | 952 |
| (Hg/Rb)×103 | 16.2 | 26.4 | 6.6 | 0.22 | 112 | 10.5 | 0.753 | 79.5 |
| (Sb/Rb)×103 | 26.3 | 29.1 | 7.3 | 2.73 | 115 | 18.9 | 2.79 | 92.2 |
| (Se/Rb)×102 | 314 | 484 | 121 | 8.57 | 1588 | 148 | 13.1 | 1549 |
The ratio of means and the reliability of difference between mean values of Co/Zn, Cr/Zn, Fe/Zn, Hg/Zn, Sb/Zn, Co/Rb, Cr/Rb, Fe/Rb, Hg/Rb, Sb/Rb, and Se/Rb mass fractions ratios in tissue of intact bone and chondrosarcoma are presented in Table 4.
Table 4. Means (M±SEM), ratio of means and the reliability of difference between mean values of Co/Zn, Cr/Zn, Fe/Zn, Hg/Zn, Sb/Zn, Co/Rb, Cr/Rb, Fe/Rb, Hg/Rb, Sb/Rb, and Se/Rb mass fractions ratios in tissue of intact bone and chondrosarcoma| Mass fractionsratio | Intact boneM1 | Chondrosarcoma M2 | M2 / M1Ratio | Student’s t-test |
| (Co/Zn)×103 | 0.140±0.017 | 0.350±0.077 | 2.57 | p ≤ 0.0224 |
| (Cr/Zn)×103 | 2.94±0.56 | 4.61±0.91 | 1.57 | p ≤ 0.140 |
| Fe/Zn | 0.69±0.15 | 1.79±0.41 | 2.59 | p ≤ 0.0488 |
| (Hg/Zn)×104 | 0.65±0.15 | 1.35±0.38 | 2.08 | p ≤ 0.174 |
| (Sb/Zn)×103 | 0.170±0.034 | 0.180±0.046 | 1.08 | p ≤ 0.568 |
| (Co/Rb)×102 | 0.61±0.30 | 5.3±1.4 | 8.69 | p ≤ 0.00292 |
| (Cr/Rb)×101 | 0.79±0.13 | 10.0±5.4 | 12.7 | p ≤ 0.0141 |
| Fe/Rb | 29±15 | 266±73 | 9.17 | p ≤ 0.00253 |
| (Hg/Rb)×103 | 2.3±1.1 | 16.2±6.6 | 7.04 | p ≤ 0.160 |
| (Sb/Rb)×103 | 5.2±1.6 | 26.3±7.3 | 5.06 | p ≤ 0.00615 |
| (Se/Rb)×102 | 7.2±3.3 | 314±121 | 43.6 | p ≤ 0.0497 |
The data of inter-correlation calculations (values of r – coefficient of correlation) including all pairs of the chemical elements identified by us in the intact bone and the chondrosarcoma.tissue are shown in Table 5.
Table 5. Intercorrelations of pairs of the trace element mass fractions in tissue of intact bone and chondrosarcoma| Tissue | E | Co | Cr | Fe | Hg | Rb | Sb | Se | Zn |
| Intact bone | Ag | -0.23 | 0.51 | -0.80b | -0.02 | 0.62a | 0.31 | -0.45 | 0.38 |
| n=27 | Co | - | 0.16 | 0.55b | 0.79b | -0.10 | 0.08 | 0.52 | 0.17 |
| Cr | 0.16 | - | -0.48 | 0.51 | 0.56a | -0.31 | -0.08 | 0.46 | |
| Fe | 0.55b | -0.48 | - | 0.09 | -0.54 | -0.25 | 0.60a | -0.17 | |
| Hg | 0.79b | 0.51 | 0.09 | - | 0.18 | -0.13 | 0.35 | -0.14 | |
| Rb | -0.10 | 0.56a | -0.54 | 0.18 | - | -0.05 | -0.06 | 0.34 | |
| Sb | 0.08 | -0.31 | -0.25 | -0.13 | -0.05 | - | 0.04 | 0.22 | |
| Se | 0.52 | -0.08 | 0.60a | 0.35 | -0.06 | 0.04 | - | 0.24 | |
| Zn | 0.46 | 0.46 | -0.17 | -0.14 | 0.34 | 0.22 | 0.24 | - | |
| Chondrosarcoma | Ag | 0.14 | 0.08 | 0.13 | 0.12 | 0.38 | -0.24 | -0.36 | 0.20 |
| n=16 | Co | - | 0.61a | 0.38 | 0.04 | 0.23 | 0.34 | 0.28 | -0.08 |
| Cr | 0.61a | - | 0.11 | -0.03 | 0.06 | 0.26 | 0.12 | 0.11 | |
| Fe | 0.38 | 0.11 | - | -0.16 | -0.01 | 0.16 | 0.07 | -0.10 | |
| Hg | 0.04 | -0.03 | -0.16 | - | 0.75b | -0.11 | 0.19 | 0.64b | |
| Rb | 0.23 | 0.06 | -0.01 | 0.75b | - | 0.01 | -0.09 | 0.39 | |
| Sb | 0.34 | 0.26 | 0.16 | -0.11 | 0.01 | - | 0.34 | 0.07 | |
| Se | 0.28 | 0.12 | 0.07 | 0.19 | -0.09 | 0.34 | - | -0.10 | |
| Zn | -0.08 | 0.11 | -0.10 | 0.64b | 0.39 | 0.07 | -0.10 | - |
Discussions
The non-destructive INAA-LLR was used in this research study because this method has many definite advantages over other analytical methods, particularly, in the clinical chemistry. For example, after non-destructive INAA-LLR there is a possibility to check the results for some trace elements and to receive additional information about other trace element contents by destructive analytical methods such as atomic absorption spectrometry, inductively coupled plasma atomic emissionspectrometry, inductively coupled plasma massspectrometry and so on, using the same bone samples. Moreover, if a deep-cooled channel of nuclear reactor is available, the non-destructive INAA-LLR allows determining trace element contents in the fresh bone/tumor samples and combining trace element study with histological investigation. It is also necessary to keep in mind that the non-destructive methods are the current gold-standard solution to control destructive analytical techniques.2 The destructive analytical methods are based on measurements of processed tissue. In such studies tissue samples are ashed and/or acid digested before analysis. There is evidence that certain quantities of chemical elements are lost as a result of such treatment.2, 34, 38 There is no doubt that every method available for the measurement of trace element contents in bone and tumor samples can be used. However, when using destructive analytical methods it is necessary to control for the losses of trace elements, for complete acid digestion of the sample, and for the contaminations by trace elements during sample decomposition, which needs adding some chemicals.
In our previous study it was shown that the results of mean values for all representative elements of CRM IAEA H-5 (Animal Bone) and SRM NIST1486 (Bone Meal) were in the range of 95% confidence interval (M±2SD) of the certificates’ values.22, 24, 25, 36 Good agreement with the certified data of CRM and SRM indicate an acceptable accuracy for the trace element mass fractions obtained in the study of intact bone and chondrosarcoma tissue presented in Tables 1-5.
In the control group the mass fractions of Co, Fe and Zn were measured in all samples, but the mass fraction of Rb – in 11 samples and mass fractions of Ag, Cr, Hg, Sb, and Se – in 10 samples Figure 1. In the chondrosarcoma group the mass fraction of all nine trace elements were determined in all samples Figure 1.
Table 2 shows that in chondrosarcoma tissue the mean mass fraction of Ag, Co, Cr, Fe, Hg, Sb, Se, and Zn is higher while the mean mass fraction of Rb is lower than in the normal bone tissues. However, in chondrosarcoma only the mean mass fractions of Co (p ≤ 0.0022), Fe (p ≤ 0.0055), and Se (p ≤ 0.0055) are significantly increased and the mean mass fraction of Rb (p ≤ 0.00076) is significantly decreased when compared with those in normal bone. Different directions of mass fraction changes suggest potential use of mass fraction ratios of these trace elements as chondrosarcoma markers. A simple ratio of two trace element mass fractions, which change in two direction, can improve the difference between such characteristics of intact bone and chondrosarcoma tissues. These conclusion was the main reason for calculating Co/Zn, Cr/Zn, Fe/Zn, Hg/Zn, Sb/Zn, Co/Rb, Cr/Rb, Fe/Rb, Hg/Rb, Sb/Rb, and Se/Rb mass fractions ratios (Table 3). It was found that higher mean values of all selected mass fraction ratios were typical of chondrosarcoma tissue compared with intact bone (Table 4). However, in chondrosarcoma only the mean mass fractions ratio of Co/Zn (p ≤ 0.0224), Fe/Zn (p ≤ 0.0488), Co/Rb (p ≤ 0.00292), Cr/Rb (p ≤ 0.0141), Fe/Rb (p ≤ 0.00253), Sb/Rb (p ≤ 0.00615), and Se/Rb (p ≤ 0.0497) are significantly increased when compared with those in normal bone.
In the control group a statistically significant direct correlation was found, for example, between the Fe and Se (r = 0.60, p ≤0.05), Fe and Co (r = 0.55, p ≤0.01), Co and Hg (r = 0.79, p ≤0.01), Rb and Ag (r = 0.62, p ≤0.05), and between Rb and Cr (r = 0.56, p ≤0.05) mass fractions (Table 5). In the same group a pronounced (p ≤ 0.01) inverse correlation was observed between the Fe and Ag (r = - 0.80, p ≤0.05). If some positive correlations between the trace elements were predictable (e.g., Fe–Co), the interpretation of other observed relationships requires further study for a more complete understanding.
In the chondrosarcoma tissue many significant correlations between trace elements found in the control group are no longer evident, for example, direct correlation between Fe and Se, etc. (Table 5). However, direct correlations between Co and Cr (r = 0.61, p ≤0.05), Hg and Rb (r = 0.75, p ≤0.01) and Hg and Zn (r = 0.64, p ≤0.01) were observed (Table 5). Thus, if we accept the levels and relationships of trace element mass fraction in the intact bone samples of control group as a norm, we have to conclude that with a chondrosarcoma transformation the levels and relationships of trace elements in bone significantly change. No published data referring to correlations between trace elements mass fractions in chondrosarcoma tissue were found.
The changes in trace element contents of cancerous tissues in comparison with non-cancerous tissues may be attributed to a cause or effect of malignant transformation. Bone is a mineralized connective tissue. It is formed by osteoblast, that deposit collage and release Ca, Mg, and phosphate ions that combine chemically within the collagenous matrix into a crystalline mineral, known as bon hydroxyapatite. On average, bone tissue contains about 10-25% water, 25% protein fibers like collagen, and 50% hydroxyapatit Ca10(PO4)6(OH)2. Many trace elements are bone-seeking elements and they are closely associated with hydroxyapatit.24, 25, 26, 27, 28 Chondrosarcoma is classified as a bone tumor. Our previous findings showed that the means of the Ca and P mass fraction in the chondrosarcoma tissue are lower than in normal bone, but the mean of Ca/P ratio is similar.6 It suggested that chondrosarcoma continues to form bon hydroxyapatit but to a lesser degree than normal bone. Our findings show that the mean of the Fe mass fraction in chondrosarcoma tissue samples was 3.48 times greater than in normal bone tissues (Table 2). It is well known that Fe mass fraction in sample depends mainly from the blood volumes in tissues. Chondrosarcoma at least in grades II and III show increased microvascularity.39 Thus, it is possible to speculate that chondrosarcoma is characterized by an increase of the mean value of the Fe mass fraction because the level of tumor vascularization is higher than that in normal bone. As we found, there is a direct correlation between Fe and Co mass fractions (Table 5). Therefore an increased level of Co in the chondrosarcoma may be closely connected with a high Fe content in tumor tissue (Table 2).
In the chondrosarcoma tissue the mean Se mass fractions is 10.1 times higher (p ≤ 0.00069) than in normal bone (Table 2). The high Se level was reported in malignant tumors of ovary,40 lung,41 prostate,42 breast43, 44 intestine,45 and in gastric cancer tissue.46 The role played by Se in those tumors remains unknown, but in general it is accepted that certain proteins containing Se can mediate the protective effects against oxidative stress. The literature-based analysis found the association of malignant tissue transformation with local oxidative stress. Studies have shown that oxidative stress conditions play an important role in both the initiation and the progression of cancer by regulating molecules such as DNA, enhancers, transcription factors, and cell cycle regulators.47 However the cause of increased Se in cancerous tissue and particularly in the chondrosarcoma is not completely understood and requires further studies.
Conclusions
INAA-LLR is a satisfactory analytical tool to determine non-destructively the elemental content of Ag, Co, Cr, Fe, Hg, Rb, Sb, Se, and Zn in human bone samples and samples of intraosseous lesions weighing about 100 mg. In the chondrosarcoma tissue the mass fractions of Co, Fe, and Se are significantly higher while the mass fraction of Rb is lower than in normal bone tissues. Moreover, significantly higher Co/Zn, Fe/Zn, Co/Rb, Cr/Rb, Fe/Rb, Sb/Rb, and Se/Rb mass fraction ratios are typical of the chondrosarcoma tissue compared to intact bone. In the chondrosarcoma tissue many correlations between trace elements found in the control group are no longer evident. Thus, if we accept the levels and relationships of trace element mass fraction in the intact bone as a norm, we have to conclude that in chondrosarcoma transformed bone tissues the trace element homeostasis is significantly disturbed.
Ethical Approval
The study was approved by the Ethical Committee of the Medical Radiological Research Center, Obninsk.
Acknowledgements
The authors are grateful to the late Prof. V.A. Bizer, Medical Radiological Research Center, Obninsk, for supplying the chondrosarcoma samples.