Abstract
Background
Docosahexaenoic acid (DHA) and eicosapentaenoic acid (EPA) are categorized as omega-3 poly unsaturated fatty acids (PUFAs) that are present in fish oil, etc. DHA and EPA omega-3 PUFAs have a well-established fasting serum triglycerides (TG) lowering effect that may result in normal lipidemia in hyperlipidemic patients. In general, omega-3 PUFAs, such as DHA and EPA, can be ingested easily, and because they are highly safe, they are assumed to be suitable for controlling fasting serum TG in the serum of those who do not require drug treatment. To the best of our knowledge, however, almost all systematic reviews on the effects of omega-3 PUFAs on lowering fasting serum TG are directed at patients fulfilling the diagnostic criteria of dyslipidemia.
Objectives
To review and confirm the preventive effect of omega-3 PUFAs against hypertriglyceridemia or the effect on nondrug treatment in patients with a mild disease, a systematic review was conducted to determine whether there was a fasting serum TG-lowering effect in subjects without disease and those with a slightly higher triglyceride level who consumed DHA and/or EPA orally compared to those with placebo or no intake of DHA and/or EPA.
Search Methods
We evaluated articles from searches of PubMed (1946-February 2016), Ichushi-Web (1977-February 2016), and J Dream III (JST Plus, 1981-February 2016; JMED Plus, 1981-February 2016). The keywords were set as follows: “DHA” or “docosahexaenoic acid” or “EPA” or “eicosapentaenoic acid” and “TG” or “triglyceride” or “triglycerol” or “triacylglycerol” or “neutral lipid.”. In addition to the literature group obtained by the database search, we included participants not suffering from any disease (i.e., excluding mild hypertriglyceridemia).
Eligibility Criteria
Before the test selection process, the following inclusion criteria were defined. Participants were healthy men and women including those with mild hypertriglyceridemia (fasting serum TG level, 150-199 mg/dL [1.69-2.25 mmol/L)). Intervention was defined as orally ingested DHA and/or EPA. Comparison was made to placebo intake or no intake of DHA and/or EPA. Results were measured for the fasting serum TG level. The test design was RCT, and quasi-RCT.
Data Abstraction
Various characteristics were extracted from original reports using a standardized data extraction form, including the author of the study, research year, research design, subject characteristics (sex, age, sample size), period, dose of DHA and/or EPA (mg/day), and comparison group.
Main Results
We identified 37 documents for review. Among the 37 reports used to integrate literature results, 25 revealed a decrease in fasting serum TG level due to the oral ingestion of DHA and/or EPA. Sixteen studies on subjects without disease and 21 on subjects with slightly higher fasting serum TG levels were separated and stratified analysis was conducted. Ten of the 16 (normal TG participant) and 15 of the 21 studies (slightly higher TG participant) respectively, indicated that at least 133 mg/day of DHA and/or EPA intervention provided a statistically significant decrease in the fasting serum TG level between an intervention group versus a placebo group.
Author Contributions
Academic Editor: Gaetan Drouin, Laboratory of Biochemistry and Human Nutrition, France.
Checked for plagiarism: Yes
Review by: Single-blind
Copyright © 2019 Yohei Kawasaki, et al.
 This is an open-access article distributed under the terms of the Creative Commons Attribution License, which permits unrestricted use, distribution, and reproduction in any medium, provided the original author and source are credited.
Competing interests
This work was funded by Maruha Nichiro Corporation. YC, HM and YT are employees of Maruha Nichiro Corporation. None of the other authors declare no conflict of interest.
Citation:
Introduction
Cardiovascular disease (CVD) is the leading cause of death worldwide and acts as a major barrier to sustainable human development. To address this major global health concern, in 2011, the United Nations officially recognized several noncommunicable diseases, including CVD, and set up an ambitious plan to dramatically reduce the impact of these diseases in all areas 1.
Hypertriglyceridemia is a type of dyslipidemia characterized by an elevated serum triglycerides (TG] level and has been reported by several prospective studies and randomized controlled trials (RCTs) to be a risk factor for CVD. An increased level of circulating TG is an independent risk factor for the onset of CVD. Hokanson and Austin reported that a fasting serum TG level of 88 mg/dL or more increases the risk of CVD development by 14% and 37% in men and women, respectively2. Therefore, lowering or maintaining a low level of fasting serum TG level reduces the risk of CVD.
Fatty acids are comprised of lipids, which are present in almost all parts of the human body. Fatty acids are divided broadly into two categories, saturated and unsaturated fatty acids. Unsaturated fatty acids are further classified into two categories: monounsaturated and poly unsaturated fatty acids (PUFAs). The PUFAs are further divided into two categories: the omega-3 series (metabolic cascade starts with α-linoleic acid (ALA)) and omega-6 series (metabolic cascade starts with linoleic acid (LA)). Docosahexaenoic acid (DHA) and Eicosapentaenoic acid (EPA) are categorized as omega-3 fatty acids 3.
Certain fatty acids, such as ALA and LA, cannot be synthesized in humans, and thus must be obtained in the diet. ALA, a type of omega-3 fatty acid, is converted into DHA and EPA in the body. DHA and EPA also exist naturally in some foods. LA, which is a type of omega-6 fatty acid, is converted to arachidonic acid (AA). DHA and EPA are derived from ALA by a similar biochemical pathway as AA. Omega-3 fatty acids generally lower fasting serum TG levels and very low-density lipoprotein (VLDL) levels in serum among hyperlipidemic patients. In regard to low-density lipoprotein (LDL) level, omega-3 fatty acids increase it or had no influence among the subjects.
EPA is a carbon number 20, omega-3 PUFA with five double bonds, also abbreviated as 20:5 omega-3. Since it has five cis-type double bonds, the molecule is not a linear structure; hence, its melting point is low and it is easily oxidized. It is almost odorless just after purification, but it undergoes auto-oxidation quickly in air and begins to smell. Peroxide is also unstable, and the volatile component is comprised mainly of the carbonyl compound of the secondary product due to the polymerization and decomposition that causes a fishy odor. It is widely distributed as a major constituent of the fatty acids in marine organisms, such as fish, mollusks, crustaceans, seaweed, and microorganisms. In particular, various sardines, mackerels, saury, and so forth which are blue-backed fish.
DHA is also a PUFA and has 22 carbon atoms and six double bonds, and is abbreviated as 22:6 omega-3. It is the final metabolite of omega-3 PUFA, with the first double bond on the third carbon counted from the methyl group end and starting from ALA (18:3 omega-3). Since it has six cis double bonds, it has a large curved molecular structure; hence, the melting point of a DHA-containing lipid is low, such as is the case for EPA. Moreover, it is extremely easy to oxidize, and readily generates a fishy odor that is mainly composed of a carbonyl compound. DHA is present in various marine animals and microorganisms, including fish, crustaceans, mollusks, microorganisms, etc. Fish with high DHA content include sardines, sauries, skipjack tunas, amberjacks, tunas, and mackerel, and in particular, DHA is present in squid liver oil and fat near the eyeballs of tuna.
In recent years, it has become clear that DHA and EPA have various physiological activities. DHA is the major PUFA present in the brain and is important for brain development and function. The synapses contain abundant DHA, suggesting that DHA is involved in neuron signaling. DHA also is required for the production of a group of compounds called resolvin, which are involved in the body’s reaction to inflammation in the brain. Resolvin synthesized specifically from DHA and EPA helps to relieve inflammation caused by ischemic stroke (reduction of blood flow). EPA also suppresses the production of inflammatory compounds, such as cytokines and alleviates inflammatory reactions.
Omega-6 fatty acids account for more than 10 times the omega-3 fatty acids in most American meals. At present, there is well-known scientific agreement that omega-3 fatty acids intake should be increased and omega-6 fatty acid intake should be decreased to promote health; however, it is unknown whether the desired ratio of omega-6 and omega-3 fatty acids exists in meals, and how much omega-6 fatty acid ingestion is necessary to inhibit omega-3 production when large amounts of omega-6 are ingested.
Researchers at the Tufts Educational Policy Committee reviewed the database of the Third National Health and Nutrition Examination Survey (NHANES III; 1988–1994) and investigated the intake of omega-3 fatty acids in the United States. ALA intake was significantly lower in males than in females, and greater in adults than in children. It became clear that there were fewer subjects with CVD than without a history of CVD. Only 25% of the population ingested DHA and EPA in a given day. The average daily intake was 14 g for LA, 1.33 g for ALA, 0.04 g for EPA, and 0.07 g for DHA.
ALA is present in green leafy yellow vegetables, nuts, vegetable oils (such as canola and soybean oils), and especially linseed or linseed oil. Good sources of DHA and EPA include seafoods (fish, crustaceans, mollusks, seaweeds and their oils and fish eggs). LA is present in several foods consumed by Americans, such as meat and vegetable oils (safflowers, sunflowers, corns, soybeans, and so forth), as well as processed foods using these oils. Daily consumption of ALA recommended by the Institute of Medicine was set at 1.1–1.6 g and LA at 11–17 g for adults, but the daily adequate intake of DHA and EPA were not set 4.
Omega-3 PUFAs have a well-established fasting serum TG lowering effect that may result in normal lipidemia in hyperlipidemic patients 5, 6, 7, 8, 9, 10, 11, 12, 13. In general, omega-3 PUFAs, such as DHA and EPA, can be ingested easily, and because they are highly safe, they are assumed to be suitable for controlling fasting serum TG in the serum of those who do not require drug treatment. To the best of our knowledge, however, almost all systematic reviews on the effects of omega-3 PUFAs on lowering fasting serum TG are directed at patients fulfilling the diagnostic criteria of dyslipidemia. Therefore, our aim was to review and confirm the preventive effect of omega-3 PUFAs against hypertriglyceridemia or positive effects for nondrug treatment in patients with a mild disease. A systematic review was conducted to determine whether there was a fasting serum TG-lowering effect in subjects without disease and those with a slightly higher TG level who consumed DHA and/or EPA orally compared to those with placebo or no intake of DHA and/or EPA.
Method
Identification of Relevant Research
PubMed (1946–February 2016), Ichushi-Web (1977–February 2016), and J Dream III (JSTPlus, 1981–February 2016; JMEDPlus, 1981–February 2016) were independently searched by two reviewers (Y. C, and Y. T). The keywords were set as follows: “DHA” or “docosahexaenoic acid” or “EPA” or “eicosapentaenoic acid” and “TG” or “triglyceride” or “triglycerol” or “triacylglycerol” or “neutral lipid.”. In addition to the literature group obtained by the database search, we included participants without any disease (i.e., excluding mild hypertriglyceridemia). Our systematic literature search utilized Preferred Reporting Items for Systematic Reviews and Meta-Analyses (PRISMA) guidelines.
Eligibility Criteria
The following inclusion criteria were defined prior to the test selection process:
Participants were healthy adult men and women including those with mild hypertriglyceridemia (fasting serum TG level, 150–199 mg/dL (1.69–2.25 mmol/L)). 2 Intervention was defined as orally ingested DHA and/or EPA. 3 A comparison was made for placebo intake or no intake of DHA and/or EPA. 4 Results were measured according to the fasting serum TG level. 5 The test design was RCT, and quasi-RCT. Based on these requirements, two reviewers (Y. T and H. M) independently selected studies and extracted data regarding the study characteristics and outcomes from the selected studies.
Data Abstraction
Various characteristics were extracted from original reports using a standardized data extraction form, including author of the study, research year, research design, subject characteristics (sex, age, sample size), period, dose of DHA and/or EPA (mg/day), and comparison group.
Risk of Bias Assessment
Using the Cochrane Collaboration tool to evaluate the risk of bias42; low, ambiguous, or highly biased risks for five categories (random sequence generation, assignment hiding, blinded participants and personnel, incomplete outcome data, and selective outcome report) were evaluated in each study. Quality assessments for each included study were also conducted using the Cochrane Collaboration’s tool for assessing risk of bias. Disagreements at any step were resolved through discussion.
Result
We found 812 reports from the database retrieval, collections, and other cited references. A total of 53 duplicated studies were excluded. We selected 193 of 759 reports that were at the primary (title and summary) screening stage. Finally, 37 reports meeting the eligibility criteria were extracted at second (full text) screening stage. Figure 1 summarizes the selection process steps. Characteristics of the 37 documents selected are listed in Table 1 together with bibliographic information. Fasting serum TG levels of control and intervention groups of the 37 reports are listed in Table 25, 6, 7, 8, 9, 10, 11, 12, 13, 14, 15, 16, 17, 18, 19, 20, 21, 22, 23, 24, 25, 26, 27, 28, 29, 30, 31, 32, 33, 34, 35, 36, 37, 38, 39, 40, 41. For the total risk of bias, both studies were assessed as having an “overall low risk of bias” (data not show).
Figure 1. Flow diagram of study selection process.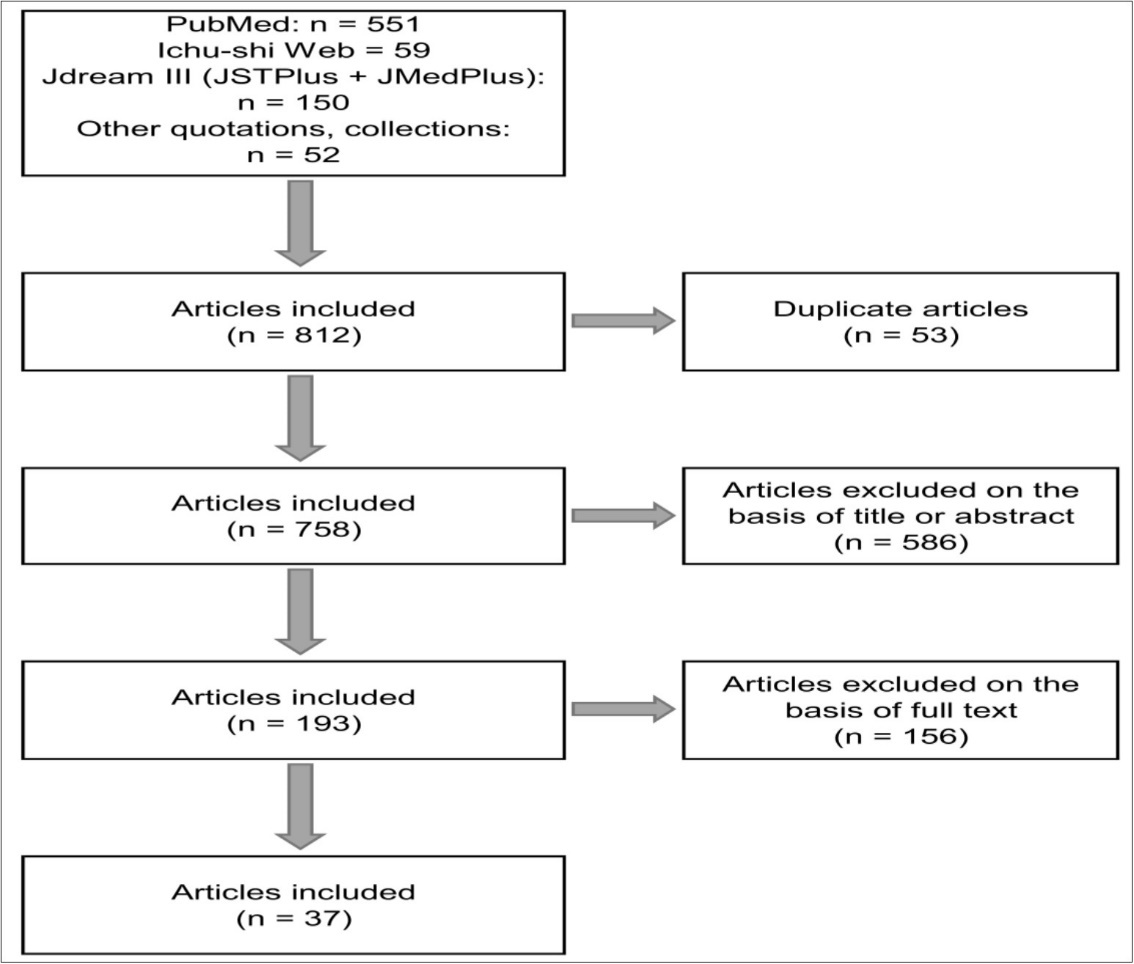
| No. | Author | Reference | PICO | Participants | Dose | Study term |
| 54 | Burns-Whitmore B, et al.14 | Nutr J, 13: 29 (2014) | P:healthy adult male and female | [Placebo group] | DHA 429 mg, | 8 weeks |
| I:DHA / EPA | [Intervention group] | EPA 34 mg | ||||
| C:placebo | N=20, 38±3 years old | |||||
| O:TG level, Cardiovascular risk | ||||||
| 74 | O'Sullivan A, et al. 15 | J Nutr, 144(2): 123–131 (2013) | P:healthy adult male and female | [Placebo group] | DHA 1,000 mg, | 6 weeks |
| I:DHA/EPA | N=42, 34.1±12.0 years old | EPA 2,000 mg | ||||
| C:placebo | [Intervention group] | |||||
| O:TG level, lipid metabolism | ・HR group | |||||
| N=28, 37.2±12.0 years old | ||||||
| ・LR group | ||||||
| N=13, 38.0±9.6 years old | ||||||
| 138 | Signori C, et al. 16 | Eur J Clin Nutr, 66(8): 878–884 (2012) | P:healthy adult female | [Placebo group] | DHA 1,500 mg, | 12 months |
| I:DHA/EPA, etc. | N=8, 35-75 years old | EPA 1,860 mg | ||||
| C:no intervention | [Intervention group] | |||||
| O:Breast cancer risk, lipid-profile including TG level | N=11, 35-75 years old | |||||
| 165 | García-Alonso FJ, et al. 17 | Eur J Nutr, 51(4): 415–424 (2012) | P:healthy adult female | [Placebo group] | DHA 125 mg, | 2 weeks |
| I:DHA / EPA | N=7, 35-55 years old | EPA 125 mg | ||||
| C:placebo | [Intervention group] | |||||
| O:TG level, lipid metabolism | N=11, 35-55 years old | |||||
| 172 | Bragt MCE, et al. 18 | Nutr Metab Cardiovasc Dis, 22(11): 966–973 (2012) | P:adult male and female | [Placebo group] | DHA 1,200 mg, | 6 weeks |
| I:DHA/EPA | [Intervention group] | EPA 1,700 mg | ||||
| C:placebo | N=20, 52±12 years old | |||||
| O:TG level, lipid metabolism | ||||||
| 181 | Ulven SM, et al. 19 | Lipids, 46(1): 37–46 (2011) | P:healthy adult male and female | [Placebo group] | ・FO group | 7 weeks |
| I:DHA/EPA | N=42, 40.5±12.1 years old | DHA 414 mg, | ||||
| C:no intervention | [Intervention group] | EPA 450 mg | ||||
| O:TG level, lipid metabolism | ・FO group | ・KO group | ||||
| N=43, 38.7±11.1 years old | DHA 195 mg, | |||||
| ・KO group | EPA 348 mg | |||||
| N=44, 40.3±14.8 years old | ||||||
| 188 | Mann NJ, et al. 5 | Lipids, 45(8): 669–681 (2010) | P:healthy adult male and female | [Placebo group] | ・FO group | 14 days |
| I:DHA/EPA | N=7, 29±5 years old | DHA 810 mg, | ||||
| C:placebo | [Intervention group] | EPA 210 mg | ||||
| O:TG level, lipid metabolism | ・FO group | ・SO group | ||||
| N=10, 30±8 years old | DHA 450 mg, | |||||
| ・SO group | EPA 340 mg | |||||
| N=10, 31±6 years old | ||||||
| 225 | Watanabe N, et al. 6 | Int J Food Sci Nutr, 60(S5): 136–142 (2009) | P:healthy adult male | [Placebo group] | DHA 540 mg, | 4 weeks |
| I:DHA / EPA | [Intervention group] | EPA 1,260 mg | ||||
| C:placebo | N=17, 50.1±9.2 years old | |||||
| O:TG level, lipid metabolism | ||||||
| 236 | Caslake MJ, et al. 7 | Am J Clin Nutr, 88(3): 618–629 (2008) | P:healthy adult male and female | [Placebo group] | ・LD group | 8 weeks |
| I:DHA/EPA | [Intervention group] | DHA 407 mg, | ||||
| C:placebo | N=312, 45.0±0.7 years old | EPA 293 mg | ||||
| O:TG level, lipid metabolism | ・HD group | |||||
| DHA 1,047 mg, | ||||||
| EPA 753 mg | ||||||
| 245 | Buckley JD, et al. 8 | J Sci Med Sport, 12(4): 503–507 (2009) | P:adult male | [Placebo group] | DHA 1,560 mg, | 5 weeks |
| I:DHA/EPA | N=13, 23.2±1.1 years old | |||||
| C:placebo | [Intervention group] | EPA 360 mg | ||||
| O:TG level, lipid metabolism | N=12, 21.7±1.0 years old | |||||
| 248 | Gunnarsdottir I, et al. 9 | Int J Obes (Lond), 32(7): 1105–1112 (2008) | P:healthy adult male and female | [Placebo group] | ・CD group | 8 weeks |
| I:DHA / EPA | N=76, 32.1±5.3 years old | DHA 207 mg, | ||||
| C:placebo | [Intervention group] | EPA 54 mg | ||||
| O:TG level, lipid metabolism | ・CD group | ・SD group | ||||
| N=79, 31.3±5.7 years old | DHA 1,370 mg, | |||||
| ・SD group | EPA 774 mg | |||||
| N=80, 31.3±5.3 years old | ・FO group | |||||
| ・FO group | DHA 430 mg, | |||||
| N=79, 31.0±5.3 years old | EPA 633 mg | |||||
| 257 | Plat J, et al. 10 | J Nutr, 137(12): 2635–2640 (2007) | P:healthy adult male | [Placebo group] | DHA 500 mg, | 6 weeks |
| I:DHA/EPA | [Intervention group] | EPA 600 mg | ||||
| C:placebo | N=11, 59±9 years old | |||||
| O:TG level, lipid metabolism | ||||||
| 262 | Kobayashi K, et al. 11 | Asia Pac J Clin Nutr, 16(3): 429–434 (2007) | P:healthy adult male and female | [Placebo group] | DHA 280 mg, | 8 weeks |
| I:DHA/EPA | N=18, 48.4±7.7 years old | EPA 660 mg | ||||
| C:placebo | [Intervention group] | |||||
| O:TG level | N=20, 48.5±7.8 years old | |||||
| 282 | Bovet P, et al. 12 | Nutr Metab Cardiovasc Dis, 17(4): 280–287 (2007) | P:healthy adult male and female | [Placebo group] | DHA 124 mg, | 3 weeks |
| I:DHA/ EPA | [Intervention group] | EPA 9 mg | ||||
| C:placebo | N=25, 34.8±7.9 years old | |||||
| O:TG level, lipid metabolism | ||||||
| 305 | Wu WH, et al. 13 | Eur J Clin Nutr, 60(3): 386–392 (2006) | P:adult female | [Placebo group] | DHA 2,140 mg | 6 weeks |
| I:DHA | N=11, 52.3±5.1 years old | |||||
| C:placebo | [Intervention group] | |||||
| O:TG level, lipid metabolism | N=1452.6±4.4 years old | |||||
| 325 | Buckley R, et al. 20 | Br J Nutr, 92(3): 477–483 (2004) | P:healthy adult male and female | [Placebo group] | ・EH group | 4 weeks |
| I:DHA/EPA | N=15, 48±4 years old | DHA 729 mg, | ||||
| C:placebo | [Intervention group] | EPA 4,752 mg | ||||
| O:TG level, lipid metabolism | ・EH group | ・DH group | ||||
| N=15, 46±3 years old | ||||||
| ・DH group | DHA 4,914 mg, | |||||
| N=12, 45±4 years old | EPA 846 mg | |||||
| 334 | Theobald HE, et al. 21 | Am J Clin Nutr, 79(4): 558–563 (2004) | P:healthy adult male and female | [Placebo group] | DHA 680 mg | 3 months |
| I:DHA/EPA | N=38, 40-65 years old | |||||
| C:placebo | [Intervention group] | |||||
| O:TG level, lipid metabolism | ||||||
| 419 | Grimsgaard S, et al. 22 | Am J Clin Nutr, 66(3): 649–659 (1997) | P:healthy adult male and female | [Placebo group] | ・EH group | 7 weeks |
| I:DHA/EPA | N=77, 45±6years old | DHA 48 mg, | ||||
| C:placebo | [Intervention group] | EPA 3,764 mg | ||||
| O:TG level, lipid metabolism | ・EH group | ・DH group | ||||
| N=75, 44±5years old | DHA 3,556 mg, | |||||
| ・DH group | EPA 72 mg | |||||
| N=72, 43±5years old | ||||||
| 420 | Lovegrove JA, et al. 23 | Br J Nutr, 78(2): 223–236 (1997) | P:healthy adult male | [Placebo group] | DHA 500 mg, | 22days |
| I:DHA/EPA | [Intervention group] | EPA 860 mg | ||||
| C:placebo | N=9, 50±7.2 years old | |||||
| O:TG level, lipid metabolism | ||||||
| 421 | Harris WS, et al. 24 | Am J Clin Nutr, 66(2): 254–260 (1997) | P:healthy adult male and female etc. | [Placebo group] | DHA 1,145 mg, | 3 weeks |
| I:DHA/EPA | [Intervention group] | EPA 2,055 mg | ||||
| C:placebo | N=20, 31±9years old | |||||
| O:TG level, lipid metabolism | ||||||
| 433 | Conquer JA, et al. 25 | J Nutr, 126(12): 3032–3039 (1996) | P:healthy adult male and female | [Placebo group] | DHA 1,620 mg | 6 weeks |
| I:DHA | ||||||
| C:placebo | [Intervention group] | |||||
| O:TG level, lipid metabolism | N=12, 29.6±1.7 years old | |||||
| 434 | Ågren JJ, et al. 26 | Eur J Clin Nutr, 50(11): 765–771 (1996) | P:healthy adult male | [Placebo group] | ・FD group | 14 weeks |
| I:DHA / EPA | DHA 670 mg, | |||||
| C:no intervention | [Intervention group] | EPA 380 mg | ||||
| O:TG level, lipid metabolism | ・FD group | ・FO group | ||||
| N=13, 23±2 years old | DHA 952 mg, | |||||
| ・FO group | EPA 1,328 mg | |||||
| N=14, 23±2 years old | ・DH group | |||||
| ・DH group | DHA 1,680 mg | |||||
| N=14, 24±4 years old | ||||||
| 435 | Hamazaki T, et al. 11 | J Nutr, 126(11): 2784–2789 (1996) | P:healthy adult male and female | [Placebo group] | DHA 1,775 mg, | 13 weeks |
| I:DHA / EPA | [Intervention group] | EPA 241 mg | ||||
| C:placebo | N=18,21-30 years old | |||||
| O:TG level, lipid metabolism | ||||||
| 468 | Hansen JB, et al. 22 | Eur J Clin Nutr, 47(7): 497–507 (1993) | P:healthy adult male | [Placebo group] | TG group | 7 weeks |
| I:DHA/EPA | N=10, 21-47 years old | DHA 1,400 mg, | ||||
| C:placebo | [Intervention group] | EPA 2,200 mg | ||||
| O:TG level, lipid metabolism | ・TG group | ・EE group | ||||
| N=11, 21-47 years old | DHA 1,200 mg, | |||||
| ・EE group | EPA 2,200 mg | |||||
| N=10, 21-47 years old | ||||||
| 490 | Luley C, et al. 29 | Arzneimittelforschung, 42(1): 77–80 (1992) | P:healthy adult male and female | [Placebo group] | DHA 1,440 mg, | 4 weeks |
| I:DHA/EPA | [Intervention group] | EPA 2,040 mg | ||||
| C:no intervention | Study DI | |||||
| O:lipid-profile including TG level | N=16, 21-55 years old | |||||
| P:healthy adult male and female | [Placebo group] | DHA 4,320 mg, EPA 6,120 mg | 4 weeks | |||
| I:DHA/EPA | [Intervention group] | |||||
| C:no intervention | Study DIII | |||||
| O:lipid-profile including TG level | N=15, 21-55 years old | |||||
| 505 | Childs MT, et al. 30 | Am J Clin Nutr, 52(4): 632–639 (1990) | P:healthy adult male | [Placebo group][Intervention group] | ・PO group | 3 weeks |
| I:DHA/EPA | N=8, 29±2 years old | DHA 681 mg, | ||||
| C:placebo | EPA 2,560 mg | |||||
| O:lipid-profile including TG level | ・TU group | |||||
| DHA 4,514 mg, | ||||||
| EPA 1,568 mg | ||||||
| ・SA group | ||||||
| DHA 1,380 mg, | ||||||
| EPA 1,104 mg | ||||||
| 510 | Blonk MC, et al. 31 | Am J Clin Nutr, 52(1): 120–127 (1990) | P:healthy adult male | [Placebo group] | ・LD group | 12 weeks |
| I:DHA / EPA | [Intervention group] | DHA 600 mg, | ||||
| C:no intervention | ・LD group | EPA 900 mg | ||||
| O:lipid-profile including TG level | N=11, 33.7±6.2 years old | ・MD group | ||||
| ・MD group | DHA 1,200 mg, | |||||
| N=10, 33.7±6.2 years old | EPA 1,800 mg | |||||
| ・HD group | ・HD group | |||||
| N=14, 33.7±6.2 years old | DHA 2,400 mg, | |||||
| EPA 3,600 mg | ||||||
| 529 | Zucker ML, et al. 32 | Atherosclerosis, 73(1): 13–22 (1988) | P:healthy adult male and female, et al | [Placebo group] | DHA 2,160 mg, | 6 weeks |
| I:DHA/EPA | [Intervention group] | EPA 3,240 mg | ||||
| C:placebo | N=9, 36-60 years old | |||||
| O:lipid-profile including TG level | ||||||
| 567 | Fujimoto, et al. 33 | Journal of Japanese society of Clinical Nutritioomega-33(3): 120–135 (2011) | P:adult male and female | [Placebo group] | DHA 260 mg, | 12 weeks |
| I:DHA/EPA | N=52, 47.9±9.2 years old | EPA 600 mg | ||||
| C:placebo | [Intervention group] | |||||
| O:TG level | N=49, 46.1±10.1 years old | |||||
| 583 | Tamai,et al. 34 | Pharmacology and Therap, 36(4): 333–345 (2008) | P:adult male and female | [Placebo group] | DHA 910 mg, | 12 weeks |
| I:DHA / EPA | N=36, 49.8±9.0 years old | EPA 200 mg | ||||
| C:placebo | [Intervention group] | |||||
| O:TG level | N=39, 48.9±8.9 years old | |||||
| 707 | Dyerberg J, et al. 35 | Eur J Clin Nutr, 58(7): 1062–1070 (2004) | P:healthy adult male | [Placebo group] | DHA 949 mg, | 8 weeks |
| I:DHA/EPA, et al | N=27, 37.6±10.6 years old | EPA 1,492 mg | ||||
| C:placebo | [Intervention group] | |||||
| O:risk for Cardiovascular related including TG level | N=24, 39.2±10.5 years old | |||||
| 709 | Prisco D, et al. 36 | Thromb Res, 76(3): 237–244 (1994) | P:healthy adult male | [Placebo group] | DHA 1,400 mg, | 4months |
| I:DHA/EPA | N=10, 32±4y ears old | EPA 2,040 mg | ||||
| C:placebo | [Intervention group] | |||||
| O:lipid-profile including TG level | N=10, 32±4 years old | |||||
| 712 | Rizza S, et al. 37 | Atherosclerosis, 206(2): 569–574 (2009) | P:healthy adult male and female | [Placebo group] | 12 weeks | |
| I:DHA/EPA | N=24, 29.9±6.2 years old | DHA/EPA 1,700 mg | ||||
| C:placebo | [Intervention group] | |||||
| O:lipid-profile including TG level | N=26, 29.9±6.2 years old | |||||
| 715 | Logan SL, et al. 38 | Plos One, 10(12): e0144828 (2015) | P:healthy adult female | [Placebo group] | DHA 1,000 mg, | 12 weeks |
| N=12, 66±1years old | EPA 2,000 mg | |||||
| I:DHA/EPA | [Intervention group] | |||||
| C:placebo | N=12, 66±1 years old | |||||
| O:lipid-profile including TG level | ||||||
| 755 | Matsumoto39 | Pharmacology and Therapy, 44(2): 235–246 (2016) | P:healthy adult male and female | [Placebo group] | DHA 544 mg, | 12 weeks |
| I:DHA/EPA | N=26, 59.1±5.3 years old | EPA 59.2 mg | ||||
| C:placebo | [Intervention group] | |||||
| O:TG level | N=28, 57.4±5.8 years old | |||||
| 757 | Rajkumar H, et al. 40 | Mediators Inflamm, Article ID 348959 (2014) | P:healthy adult male and female | [Placebo group] | DHA 120 mg, | 6 weeks |
| I:DHA/EPA, et al. | N=15, 40-60 years old | EPA 180 mg | ||||
| C:placebo | ||||||
| O:lipid-profile including TG level. | ||||||
| 758 | Marckmann P, et al. 41 | Arterioscler Thromb Vasc Biol, 17(12): 3384–3391 (1997) | P:healthy adult male | [Placebo group] | DHA 508 mg, | 4 weeks |
| I:DHA/EPA | N=24, 41±9 years old | EPA 355 mg | ||||
| C:placebo | [Intervention group] | |||||
| O:lipid-related including TG level. | N=23, 41±9 years old | |||||
| No. | Intervention group (pre) | Intervention group(post) | Intervention group(mean difference) | Intervention group vs. placebo group (mean difference) | Vs. baseline(p value) | Between groups(p value) | |||
| 54 | 1.13 (1.07_1.18) | 0.97 (0.87_1.08) | NA | NA | NA | NS | |||
| 74 | HR group | 81.7±58 | 58.1±35 | NA | NA | NA | <0.05 | ||
| LR group | 84.6±32 | 73.1±26 | NA | NA | NA | NS | |||
| 138 | 119±15.1 | 101±14.0 | NA | NA | <0.05 | NS | |||
| 165 | 65.91±8.51 | 65.45±7.93 | NA | NA | NS | NS | |||
| 172 | 1.63±0.59 | NA | NA | −0.34 | NA | 0.048 | |||
| 181 | FO group | 0.95±0.541 | 0.94±0.542 | −0.01±0.462 | NA | NS | NS | ||
| KO group | 1.10±0.638 | 1.01±0.649 | −0.09±0.417 | NA | NS | NS | |||
| 188 | FO group | 1.25±0.65 | 0.99±0.45 | −0.26 | NA | NS | NS | ||
| SO group | 1.58±0.52 | 1.18±0.37 | −0.40 | NA | <0.05 | NS | |||
| 225 | 98.3±52.4 | 106.7±70.9 | NA | NA | NS | NS | |||
| 236 | LD group | 1.25±0.04 | 1.17±0.03 | NA | NA | NA | <0.017 | ||
| HD group | 1.28±0.04 | 1.13±0.03 | NA | NA | NA | <0.017 | |||
| 245 | 1.14±0.13 | NA | −0.32±0.09 | NA | NA | <0.001 | |||
| 248 | CD group | 1.31±0.73 | NA | −0.28±0.51 | NA | NA | 0.038 | ||
| SD group | 1.18±0.52 | NA | −0.26±0.44 | NA | NA | 0.001 | |||
| FO group | 1.15±0.73 | NA | −0.20±0.61 | NA | NA | 0.035 | |||
| 257 | 1.53±0.60 | 1.11±0.47 | NA | NA | NA | NS | |||
| 262 | 4 weeks | 1.05±0.63 | 0.91±0.34 | NA | NA | NA | NS | ||
| 8 weeks | 0.88±0.34 | NA | NA | NA | <0.05 | ||||
| 282 | GA group | 0.68±0.23 | 0.54±0.15 | NA | NA | 0.013 | NA | ||
| GB group | 0.68±0.42 | 0.61±0.25 | NA | NA | NS | NA | |||
| (total) | 0.68 | 0.57 | (−15.6%) | (−18.3%) | <0.01 | <0.01 | |||
| 305 | 1.40±0.62 | 1.16±0.46 | −0.25±0.59 | NA | NA | NS | |||
| 325 | EH group | 1.18±0.19 | 0.92±0.15 | NA | NA | 0.003 | NS | ||
| DH group | 1.16±0.19 | 0.72±0.07 | NA | NA | 0.006 | 0.032 | |||
| 334 | 1.03±0.094 | 1.01±0.089 | NA | −0.18 (−0.37_0.05) | NS | NS | |||
| 419 | EH group | 1.23±0.57 | NA | −0.15±0.40 | NA | <0.01 | 0.0001 | ||
| DH group | 1.24±0.58 | NA | −0.22±0.31 | NA | <0.001 | 0.0001 | |||
| 420 | 1.54±0.54 | 1.49±0.37 | NA | NA | NS | NS | |||
| 421 | 1.44±0.34 | 1.05±0.29 | NA | NA | NA | <0.001 | |||
| 433 | 3 weeks | 0.96±0.11 | 0.75±0.09 | NA | NA | <0.05 | NS | ||
| 6 weeks | 0.80±0.11 | NA | NA | <0.05 | NS | ||||
| 434 | FDgroup | 4 weeks | 1.36±0.47 | 1.27±0.45 | NA | NA | NS | NS | |
| 9 weeks | 0.99±0.31 | NA | NA | <0.05 | <0.05 | ||||
| 14 weeks | 1.16±0.40 | NA | NA | <0.05 | <0.05 | ||||
| FOgroup | 4 weeks | 1.21±0.35 | 1.11±0.24 | NA | NA | NS | NS | ||
| 9 weeks | 0.95±0.18 | NA | NA | <0.05 | NS | ||||
| 14 weeks | 0.89±0.13 | NA | NA | <0.05 | <0.05 | ||||
| DHgroup | 4 weeks | 1.17±0.38 | 1.03±0.27 | NA | NA | NS | NS | ||
| 9 weeks | 1.00±0.33 | NA | NA | <0.05 | NS | ||||
| 14 weeks | 0.97±0.21 | NA | NA | <0.05 | <0.05 | ||||
| 435 | 0.82±0.55 | 0.81±0.58 | −0.01±0.34 | NA | NS | NS | |||
| 468 | TG group | 0.83±0.13 | NA | −0.19±0.09 | NA | NA | NS | ||
| EE group | 0.82±0.14 | NA | −0.05±0.10 | NA | NA | NS | |||
| 490 | DⅠ | NA | NA | NA | −15 (−52_3) | NA | 0.0008 | ||
| DⅢ | NA | NA | NA | −34 (−55_−4) | NA | 0.0008 | |||
| 505 | PO group | NA | NA | NA | (−34%±6%) | NA | <0.01 | ||
| TU group | NA | NA | NA | (−44%±7%) | NA | <0.05 | |||
| SA group | NA | NA | NA | (−45%±10%) | NA | NS | |||
| 510 | LD group | 1.01±0.14 | 0.87±0.12 | NA | NA | NA | <0.05 | ||
| MD group | 0.93±0.07 | 0.70±0.07 | NA | NA | NA | <0.05 | |||
| HD group | 1.00±0.09 | 0.78±0.06 | NA | NA | NA | <0.05 | |||
| 529 | 0.87±0.07 | 0.87±0.07 | 0.67±0.05 | NA | NA | NS | NS | ||
| 567 | NA | NA | NA | −24.1 | NA | NA | <0.05 | ||
| 583 | 4 weeks | 172±6 | 140±9 | NA | NA | <0.05 | NS | ||
| 8 weeks | 120±8 | NA | NA | <0.05 | <0.05 | ||||
| 10 weeks | 126±10 | NA | NA | <0.05 | NS | ||||
| 12 weeks | 129±7 | NA | NA | <0.05 | <0.05 | ||||
| 707 | 1.34±0.11 | 0.99±0.07 | NA | NA | NA | <0.05 | |||
| 709 | 2 months | 1.2±0.3 | 0.9±0.1 | NA | NA | NS | NA | ||
| 4 months | 0.9±0.2 | NA | NA | NS | NA | ||||
| 712 | 116.8±72.6 | 86.2±43.6 | −30.6±40.0 | NA | <0.01 | <0.01 | |||
| 715 | 1.30±0.14 | 1.01±0.14 | NA | NA | <0.05 | NS | |||
| 755 | 4 weeks | 140.5±11.0 | 133.7±12.6 | −6.8±8.8 | NA | NA | NS | ||
| 8 weeks | 132.0±8.8 | −8.5±9.6 | NA | NA | 0.028 | ||||
| 12 weeks | 132.8±10.0 | −7.8±6.8 | NA | NA | 0.040 | ||||
| 757 | 105.90±6.53 | 102.62±6.44 | NA | NA | <0.05 | NS | |||
| 758 | 1.06±0.09 | 0.93±0.09 | NA | NA | <0.01 | NS | |||
Among the 37 reports used to qualitatively the results, 25 revealed a decrease in fasting serum TG level due to oral ingestion of DHA and/or EPA. Sixteen studies on subjects without disease and 21 on subjects with slightly higher fasting serum TG levels were separated and subjected to stratified analysis. Ten of the 16 (normal TG participant) and 15 of the 21 studies (slightly higher TG participant), respectively, intake of an at least 133 mg/day of DHA and/or EPA intervention revealed a statistically significant decrease in the fasting serum TG level between the intervention group and placebo group. Clinical trials were conducted around the world, and subjects varied in terms of age, sex and race. Moreover, there were several methods for ingesting DHA and/or EPA in foods. Due to the clinical heterogeneity, the results were not quantitatively integrated, but qualitatively integrated and evaluated. Regardless of the diversity of these subjects and the type of intake, there were lower fasting serum TG levels. In this study, DHA and/or EPA intake ranged from 133–10,440 mg and fasting serum TG levels lowered during a 2-week to 12-month DHA and/or EPA oral intake period. Furthermore, there was no evidence of harmful effects due to the intake of DHA and/or EPA.
Discussion
The aim of this study was to confirm the preventive effect of DHA and/or EPA on hypertriglyceridemia or the effect on nondrug treatment for people with a slightly higher fasting serum TG level. A systematic review examined whether oral DHA and/or EPA compared to placebo or no DHA and/or EPA would lower serum TG levels in participants without disease and for those with a slightly higher fasting serum TG level. Among the 37 RCTs, there were 16 healthy subjects and the remaining 21 subjects had slightly higher fasting serum TG levels. Among the former 16 RCTs, significant differences were found in the five double-blind RCTs with a high evidence level, and four studies suggested a lowering effect, although there were no significant differences. Considering that a ceiling effect exists for healthy subjects, this result might suggest the magnitude of the preventive effect of DHA and/or EPA. Among the 21 RCTs targeting people with somewhat higher fasting serum TG levels, several reported reduced fasting serum TG levels after oral ingestion of DHA and/or EPA, suggesting that oral intake of DHA and/or EPA suppresses the progression to hypertriglyceridemia. Thus, DHA and/or EPA dietary intake could contribute to decreasing the number of persons who require medicine to control their fasting serum TG level.
Although several previous studies have reported the fasting serum TG lowering effect of DHA and/or EPA in subjects with hyperlipidemia, our study strongly suggests that the effect is maintained among the subjects with borderline hyperlipidemia and normal lipidemia. Overall, the studies involving dietary interventions assessed in our review revealed that consuming 133–10,440 mg of DHA and EPA produces fasting serum TG lowering effects in healthy or slightly higher fasting serum TG level individuals.
EPA is already used as an ethical drug, and thus, its effect can be considered to be well established; however, the mechanism of omega-3 fatty acids, such as DHA and EPA, to lower the fasting serum TG level, remains unclear. There are some hypothetical mechanisms, including inhibition of diacylglycerol acyltransferase, increase in plasma lipoprotein lipase activity, decrease in liver lipid production, and increase in liver beta oxidation 43.
Based on the results of the preclinical and clinical trials, omega-3 fatty acids have been proposed as exerting a decreasing action on fasting serum TG via numerous mechanisms. For example, it is believed to reduce lipid production in the liver by suppressing the expression of sterol regulatory element binding protein-1c. This is due to the downregulation of expression of cholesterol, fatty acids, and TG synthase 44, 45. It also is presumed to increase beta-oxidation of fatty acids, and consequently, the TG are suppressed by decreasing the substrate necessary for the synthesis of TG 46. Furthermore, omega-3 fatty acids are assumed to inhibit TG synthesis in the liver by inhibiting important enzymes involved in hepatic TG synthesis, such as phosphatidic acid phosphatase and diacylglycerol acyltransferase 47. Moreover, it has been reported to increase the removal of fasting serum TG from circulating VLDL and chylomicron particles 48, 49.
DHA and EPA, the major omega-3 fatty acids, have been reported to lower fasting serum TG levels; however, they are known to have different effects on LDL and high density lipoprotein (HDL) 50, 51, 52. In a direct comparative study, in a meta-analysis comparing the effects of DHA and EPA, DHA was associated with a greater decrease in fasting serum TG and a greater increase in LDL than EPA. DHA also increased HDL compared to placebo, but EPA did not 51. Further studies are needed to clarify the mechanisms and significance of these differences 50, 51, 52.
Research on most omega-3 fatty acids is directed toward DHA and EPA; however, recently omega-3 docosapentaenoic acid (DPA) also has been drawing attention. The level of DPA in serum has is individually associated with a reduction in the risk of myocardial infarction and coronary heart disease 53, 54. When the DPA level in the serum decreases, the risk of peripheral arterial disease such as vascular plaque formation increases 55, 56. DPA has a stronger inhibitory action on platelet aggregation than DHA and EPA 57. Like DHA and EPA, DPA has been reported to decrease the expression of inflammatory genes 58. As the fasting serum TG-lowering mechanism of action of long-chain omega-3 fatty acids differs from that of other lipid-lowering drugs, such as statins, they can potentially provide complementary benefits on the lipid profile when administered in combination 35. This is supported by a study examining the synergistic effect of the lowering action of fasting serum TG by omega-3 fatty acids in addition to statin therapy 59, 60, 61, 62.
This research had certain limitations. There was a possibility that sampling bias existed in the studies used and there was language bias due to the database search using only English and Japanese keywords; however, all reports adopted in this study were peer-reviewed RCTs, the quality of each research was thought to be high, the bias risk was roughly not a problem, and the quality of scientific evidence could be sufficiently judged. In this systematic review, meta-analysis could not be performed due to several reasons, mainly clinical heterogeneity; however, the evidence level of an individual RCT is considered to be sufficiently high, that is, it can be said that DHA and/or EPA intake can reduce and maintain a suitable level of fasting serum TG.
In modern society, the importance of functional foods is increasing in terms of medical economics; however, it will be necessary to accumulate evidence from interventional studies targeting healthy people and perform meta-analysis.
Authors' Conclusions
The studies involving dietary interventions assessed in our review and results from healthy participants revealed that consuming 133-10,440 mg of DHA and/or EPA produces fasting serum TG lowering effects in healthy or slightly higher fasting serum TG level individuals.
Abbreviations
AA:Arachidonic acid
ALA: α-linoleic acid
CVD: Cardiovascular disease
DHA: Docosahexaenoic acid
DPA: Docosapentaenoic acid
EPA: Eicosapentaenoic acid
HDL: High density lipoprotein
LA: Linoleic acid
LDL: Low density lipoprotein
LTs: Leukotrienes
PUFAs: Polyunsaturated fatty acids
RCTs: Randomized controlled trials
TG: Triglycerides
VLDL: Very low-density lipoprotein