The Raw pH in Plants: A Multifaceted Parameter
Abstract
The measurement of the in vivo raw pH of vegetative organs is a unusual way obtaining plant knowledge. The authenticity of the pH parameter of the leaf and its independence from soil pH has already been highlighted. In the present work we observe how and to what extent water-temperature mechanisms as well as bio-fertilizers inocula can affect the raw pH and how great the biodiversity is in plants. A trial with Arabidopsis thaliana in a phytotrone has shown that, in the dark, the raw pH did not change from +18 to +35 °C (b = -0.0027 N.S.), while in the light, the regression coefficients were significant and negative, and the acidification in the leaves progressed from high (-0.0097) to normal (-0.0127) and then to low (-0.0370) water level. We have confirmed that warming induces a decrease of raw petiole pH of -0.070 pH C°-1 in grapevine leaves. In accordance with water-temperature mechanisms, the raw pH in grapevines has been found to be significantly higher in well-watered plants (pH = 4.29) than in stressed ones (4.12), with a pH decay of -3.9%. On the other hand, an average reduction of 0.10 units of raw pH would signal an increase in water stress of about -0.59 Mpa. Among the phenomena that can influence the raw pH, we have outlined three biotic factors: i) acidification as a result of a symbiotic farming fertilization i.e through the use of mycorrhizal and microbial fertilizers, with an average decay of around -3%, as a probable signature of symbiosis; ii) an “acida plantarum natura” scenario over 49 species, ranging from pH 3.06 to 6.38 ; iii) a strong (R2= 0.9) inverse polynomial pseudo-relationship of the number of fungicide sprays on the raw pH in a set of 15 species. It is suggested that this simple new multifaceted parameter can deserve interest.
Article Information
- Received
- Accepted
- Published
Academic Editor: Abubaker Haroun Mohamed Adam, Department of Crop Science (Agronomy), College of Agriculture, Bahri University, Alkadaru, Khartoum, Sudan.
Checked for plagiarism: Yes
Review by: Single-blind
Copyright © 2018 Giorgio Masoero, et al.
 This is an open-access article distributed under the terms of the Creative Commons Attribution License, which permits unrestricted use, distribution, and reproduction in any medium, provided the original author and source are credited.
Corresponding author: Giorgio Masoero, Accademia di, Agricoltura, di Torino; Torino, Italy —
Competing Interests
The authors have declared that no competing interests exist.
Funding
No specific funding statement was provided by the authors.
Data Availability
No data-availability statement was provided by the authors.
Acknowledgements
The authors wish to thank: Francesca Secchi, Chiara Pagliarani, Claudio Lovisolo and Vittorino Novello of DISAFA-Grugliasco for their moral support and practical help with the structures; Gian Luca Malvicini (ILLY-Caffè) for the scientific and practical interest in the raw pH tool, and especially for the reerences on fungicide treatments in the pear and coffee; Marguerite Jones and Marco Nuti for the linguistic revision; Giusto Giovannetti for the impulse towards a “Symbiotic Agriculture”. Thanks are also due to the “Fondazione CRT, Torino” for the financial support to the scientific activities of the Accademia di Agricoltura di Torino.
Citation:
Introduction
The in vivo raw pH of vegetative organs is a unusual measurement in plant knowledge, that almost sounds like a paradox when compared to the resonant importance of soil pH1or pH and Eh2and moreover of pH and Eh in hydroponics systems3,4. In fact the raw mass pH was an historic pivotal keystone, since AI Virtanen, NP in 1945, and still it is worldwide, everywhere silage fodder is adopted: in truth the present study is intended to deep inside the in vivo raw pH in crops and in orchards, that is pre- and not post-mortem phase. It must be pointed out that in the most studied vegetal species, Arabidopsis thaliana, the pH has been deeply discerned among intracellular components 5 but the raw foliar pH, intended as the raw matrix of leaf tissues, remains neglected. In the framework of a study on mycorrhizal and microbial effects on maize6 a systematic significant response emerged in the in vivo raw pH of maize stems, showing an acidification de-gradient from roots (pH -7% in mychorrized corn) to stem pH at ears height (-4%). After this first results, preliminary surveys in grapevine ascertained that the Flavescencedorée, a phytoplasma diffused in Latin EU-area7 attack determined an elevation of the pH in unhealthy sub-branch and petioles8. Raw pH fall-out in Sorghum sudanensis leaves has been recently recognised as a sign of mycorrhizal inoculation11. So far, a relevant result was the appearance of acidic nature in the raw tissues of corn and grapevine that were lower than the previous leaf pH values determinated in 92 species from the Cornelissen team9,10.
Experimental Procedure
The aims of the present study were to pursuit the investigation of this paradox multifaceted parameter with address for either: i) a multi-species variation, and ii) a dependency on the aerial temperature and on the plant water status that, iii) a different susceptibility to fungal and or bacterial diseases. Four bodies of data were considered for the setup of the present work. Further comparative elaborations and suggested hypothesis are reported in the discussion.
Materials and Methods
Measuring Raw pH
The in-vivo raw pH measurements were conducted using a BORMAC “XS pH 70” pH meter (www.giorgiobormac.com), range pH 0÷14, two decimals, provided with a combined plastic-glass electrode Hamilton Peek Double-PoreF, / Knick, dimensions (LxØ) mm 35×6, terminating with a very small and sensible tip sensor; other types were unstable and unreliable. The insertion of the tip in the petiole was facilitated by a small drill fitted with a 2 mm bit. In total 4181 leaves were examined for raw pH in the petiole axis, basal side. When the petiole was too thin for a tip insertion (olive, grape) then an axial cut by a lancet was executed, and the sensitive tip was wrapped by the two wings of petiole fork. For the Arabidopsis thaliana examination, several small packages of leaf blades were pierced with the tip. The maize pH was measured in the stem at the middle of 2nd internode 6 and not in a part of the leaf.
Multispecies Variability
As a total forty-nine species (Table 1, Table 2) were sampled from twenty-nine botanic families, relevant to several orchards, trees, vegetables and ornamental species. The grapevine was the most represented species (No. 2190) suited by the maize (792). Geographic origins were Piedmont (vine, vorn and several other), Emilia (hazelnut, blueberry, cherry and kiwi) and Puglia (olive). The pH values were analysed according the species, by a one-way ANOVA, using PROC GLM, Tukey’s HSD, by SAS V. 9 software (SAS Institute, Cary, NC, USA).
Temperature Timeline Effects
Four Barbera grapevines were grown in-pot outdoor at the DISAFA experimental implant (45°03'58.6"N 7°35'23.8"E). The pH was measured on fifty-six leaves, without automatic correction for temperature, and sampled at three different timepoints (8-9; 12-13 and 19-20) during October 2016. In this part of the study were comprised other raw pH measurements recorded on Barbera grapevines from the same implant and sampled in July on the late morning. The external temperature was considered as the independent variable in a regression study of pH. The hour of the day was also plotted to consider the daily timeline effect.
Water Stress Effects
The pH was measured on 176 leaves from 15 Grenache variety grapevines grown in pot at 25±2 °C in a greenhouse at the same implant as above. The leaves belonged from a control well watered and from a water-stresses thesis, monitored by Ψstem. The pH and the hydronium [H+] were related with the stress condition by a mixed model considering the plant random within stress group, and fixed the watering factor. Further regression analyses considered the pH and [H+] individual values on the Ψstem of the plant, established on some protected leaves at the moment when the plant was cut for the sap extraction.
Water-Thermo-Light Combined Effects
Sixteen pots of Arabidopsis thaliana forty-days old were conditioned for thermo-light in a small phytotrone set at +18°C and + 30°C with 12 h day-night photoperiod. A first run was conducted at high level of watering where half of the pots were kept in dark for 24 h before the raw pH measurements, at the end of the daylight period. A following run was developed at normal watering, without dark period and a third run interested the residual plants, that were inducted in water stress at the two temperature levels in a normal daylight period. An IR pyrometer established the leaf temperature, while the pH-meter was disconnected for the thermal compensation. A total of 104 measurements were developed in the three runs.
Symbiotic (Mycorrhizal and Microbial) Effects
In a framework of symbiotic biofertilization on fields experiments, a complex commercial consortium mycorrhizal-based (Micosat F ®, by CCS Aosta s.r.l.)11(S) was used and compared to internal control not inoculated (C). Different systems were adopted for root inoculation. In adult vineyards and other orchards was practiced a cut depth 30 cm at a distance of 50 cm from the row, distributing 20 kg ha-1of bio-fertilizer. In a very minor cases, with young orchards, the plants have been pudding-treated. As a total seven species, were collected from four farms in 2014 (corn) and from nineteen orchards in 2015 (vine, hazelnut, blueberry, cherry, kiwi and olive); geographic origins were Piemonte (vine and corn), Emilia (hazelnut, blueberry, cherry and kiwi) and Puglia (olive). A two way ANOVA with interaction was used for statistical analysis. The model included the species and symbiotic factors
Pseudo-Relationship with the Fungicide Sprays.
In the report published from the EFSA EU-ERA network12, in the original Table 1712 were exposed the frequencies of the fungicide and insecticide sprays for 13 orchards and crops. Because no data were available for pear, a key species for pH involvement, and coffee, some specialist colleagues were asked about. These mean values were colligated with the mean pH of the species by using polynomial models. A special study concerned the differential outbreaks of the fire blight (Erwinia amylovora) in apple and pear, as meticulously monitored in the Bolzano Province13 from 1999 to 2016 in some 8.185 farms; the relative incidence and odds ratio referred to farms and hectares.
Results
Multispecies Variability
The raw pH appeared as a very wide-distributed parameter across the species (Figure 1)
Figure 1. Histogram of the raw pH from the 49 species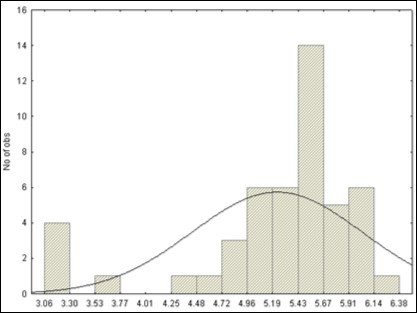
Download figure
An apparent scenario of acidity, (Table 1, Table 2) spaced from Vitis riparia (pH = 3.06) to pumpkin (Sechium edule, 6.38) with a wide range of 974 to 1 in term not in potenz but in hydronium H+ concentration, respectively. The grapevine, Vitis vinifera, appeared as the most acidic species (3.68), followed by the maize (4.84), oak (4.87), apple (4.99), apricot (5.03), peach (5.09), plum (5.17), cherry (5.24), olive (5.26), pepper (5.32), coffea (5.31), tomato (5.46), aubergine (5.48), poplar (5.50), pear (5.52), potato (5.77), lettuce (5.97), basil (6.08), cauliflower (6.10), and pumpkin (6.38).
Table 1. Raw pH values in the 1-30th (49) species, ordered by values| Species | Botanic Family | No. | Mean | Rank | SD |
|---|---|---|---|---|---|
| _01_Vitis_riparia | Vitaceae | 23 | 3.06 | a | 0.22 |
| _02_Vitis_rupestris | Vitaceae | 18 | 3.1 | a | 0.22 |
| _03_Vitis_berlandieri | Vitaceae | 16 | 3.21 | a | 0.28 |
| _04_Vitis_riparia_183G×Vitis_cinerea | Vitaceae | 12 | 3.27 | a | 0.18 |
| _05_grape-Vitis_vinifera | Vitaceae | 2190 | 3.69 | b | 0.37 |
| _06_Ginkgo_biloba | Ginkgoaceae | 10 | 4.41 | c | 0.13 |
| _07_Platanus_acerifolia | Platanaceae | 10 | 4.66 | d | 0.14 |
| _08_maize-Zea_mais | Graminacee | 792 | 4.84 | d | 0.39 |
| _09_oak-Quercus_Robur | Fagaceae | 10 | 4.87 | d | 0.10 |
| _10_maple-Acer_Platanoides | Sapindaceae | 13 | 4.89 | de | 0.13 |
| _11_apple-Malus_Domestica | Rosaceae | 76 | 5.04 | e | 0.27 |
| _12_orange-Citrus_Sinensis | Rutaceae | 12 | 4.99 | ef | 0.17 |
| _13_apricot-Prunus_Armeniaca. | Rosaceae | 17 | 5.03 | ef | 0.27 |
| _14_raspberry-Rubus_Spp. | Rosaceae | 11 | 5.25 | ef | 0.34 |
| _15_peach-Prunus_Persica | Rosaceae | 19 | 5.09 | fg | 0.2 |
| _16_plum-Prunus_Insititia | Rosaceae | 19 | 5.17 | efgh | 0.26 |
| _17_cherry-Prunus_Avium | Rosaceae | 31 | 5.24 | fghi | 0.24 |
| _18_olive-Olea_Europaea | Oleaceae | 121 | 5.26 | gi | 0.26 |
| _19_pepper-Capsicum_Annuum | Solanacee | 14 | 5.32 | gi | 0.16 |
| _20_coffee-Coffea_Arabica | Rubiaceae | 121 | 5.31 | gij | 0.12 |
| _21_Ailanthus_altissima | Simaroubaceae | 30 | 5.35 | gijk | 0.19 |
| _22_Hoya_carnosa. | Apocinaceae | 10 | 5.41 | gijkl | 0.10 |
| _23_Magnolia_grandiflora | Magnoliaceae | 13 | 5.44 | gjkl | 0.05 |
| _24_tomato-Lycopersicon_esculentum | Solanacee | 16 | 5.46 | gjkl | 0.19 |
| _25_Tilia_platyphyllos | Malvacee | 11 | 5.46 | gjkl | 0.11 |
| _26_aubergine-Solanum_melongena | Solanacee | 10 | 5.48 | gjklm | 0.07 |
| _27_kiwi-Actinidia_chinensis | Actinidiaceae | 30 | 5.49 | jklm | 0.12 |
| _28_lemon-Citrus_limon | Rutaceae | 14 | 5.49 | jklmn | 0.09 |
| _29_poplar-Populus_nigra | Salicaceae | 21 | 5.5 | jlmn | 0.24 |
| _30_Sage-Salvia_pratensis_ | Lamiaceae | 10 | 5.51 | jlmn | 0.15 |
| Species | Botanic Family | No. | Mean | Rank | SD |
|---|---|---|---|---|---|
| _31_thistle-Cynara_cardunculus_L._altili | Asteracee | 14 | 5.51 | jlmn | 0.22 |
| _32_pear-Pyrus_communis_L. | Rosaceae | 23 | 5.52 | jlmn | 0.11 |
| _33_artichoke-Cynara_cardunculus_L._scolymus | Asteracee | 12 | 5.69 | mn | 0.49 |
| _34_onion-Allium_cepa. | Amaryllidaceae | 46 | 5.58 | mno | 0.13 |
| _35_beet-Beta_vulgaris_L._var._cruenta | Amaranthaceae | 10 | 5.73 | mnop | 0.16 |
| _36_curcuma-Curcuma_longa | Zingiberaceae | 10 | 5.66 | mnopq | 0.18 |
| _37_celery_Apium_graveolens | Apiaceae | 16 | 5.71 | mopq | 0.10 |
| _38_leek-Allium_porrum | Amaryllidaceae | 25 | 5.77 | oq | 0.23 |
| _39_potato-Solanum_tuberosum. | Solanacee | 58 | 5.77 | oq | 0.23 |
| _40_chicory-Cichorium_intybus | Asteracee | 33 | 5.81 | oq | 0.11 |
| _41_fig-Ficus_carica | Moraceae | 14 | 5.87 | oq | 0.28 |
| _42_Arabidopsis_thaliana | Crucifere | 24 | 5.96 | r | 0.09 |
| _43_lettuce-Lactuca_sativa | Asteracee | 43 | 5.97 | r | 0.14 |
| _44_carrot-Daucus_carota | Apiacee | 31 | 5.99 | rs | 0.21 |
| _45_Zamioculcas_zamiifolia | Araceae | 11 | 6.05 | rs | 0.22 |
| _46_basil-Ocimum_basilicum | Labiate | 21 | 6.08 | rs | 0.28 |
| _47_fennel-Foeniculum_vulgare | Apiacee | 26 | 6.08 | rs | 0.15 |
| _48_cauliflower-Brassica_oleracea. | Crucifere | 33 | 6.1 | s | 0.21 |
| _49_pumpkin-Sechium_edule | Cucurbitaceae | 31 | 6.38 | t | 0.34 |
| R2 = 0.86 | 4181 | 4.39 | 0.34 |
Temperature and Water-Stress Effects
In the experiment with grapevine aimed to an assessment of the pH to the aerial temperature, it was observed a saddle trend from morning to evening (Figure 2). The value was stable overnight and it depended on the combination between sunlight and aerial temperature. Otherwise during the dark period the pH remained stable. Such rise of acidity in the middle day can be ascribed both to a thermal factor or to a sun irradiance available abundance.
Figure 2. Plot of the raw pH at Petiole in different hours of the day.
Download figure
Where regressing the pH and the aerial temperature (Figure 3) the two variables appeared as inversely and closely related with a linear regression coefficient of -0.073±0.003 pH °C-1 (Eq. A, P<0.0001 in Table 3).
Figure 3. Regression of the raw pH in petiole of grapevines on the aerial temperature.
Download figure
| Equations | R 2 | Intercept | b(°C) | SE | Prob | b(°C 2 ) | SE | Prob |
| A | 0.797 | 5.31 | -0.073 | 0.003 | <.0001 | . | . | . |
| B | 0.800 | 4.80 | . | . | . | -0.00219 | 0.00009 | <.0001 |
| C | 0.800 | 4.99 | -0.027 | 0.023 | 0.24 | -0.00139 | 0.00069 | 0.045 |
The raw petiole pH was also sensible to divergent conditions in the soil moisture. In the pot experiment, with grapevines from Grenache vineyard (Table 4 and Figure 4) the pH was significantly different in the well watered (pH = 4.29) and in the stressed conditions (4.12). The pH decay was 3.9%, but in terms of H+ the increase was 47%.
Table 4. LSmeans of the raw pH in control and water stressed vines (No. 175)| Variable | Control well watered | Stressed | Prob | |||
| LSMean | SE | LSMean | SE | |||
| Raw pH | 4.29 | 0.03 | 4.12 | 0.03 | 0.0002 | |
| Hydronium [H+] | 58.05 | 5.61 | 84.81 | 5.37 | 0.0007 | |
Figure 4. Petiole raw pH regressed on the Well vatered (1) or Stressed (2) conditions.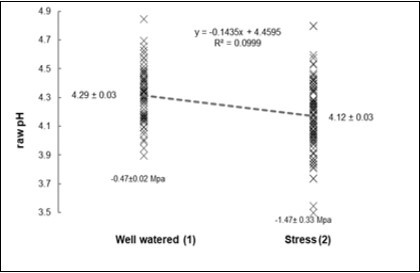
Download figure
Where looking at the individual values (Table 5) the relationships direct and inverse appeared significant but veak (P = 0.04): in the direct sense the pH regressed on the Ψstem as +0.05 Mpa-1, but on averages the increase would be +0.17 Mpa-1. In the reverse sense, an average reduction of 0.10 unit of pH would signal an increase in water stress about -0.59 Mpa.
Table 5. Regression of the raw petiole ph on the ψstem and the inverse relationship among the ∆w and ph in control and water stressed vines (No. 175)| Variable | R 2 | b(∆W) | SE | Prob(b) |
| pH | 0.024 | 0.05 | 0.024 | 0.0416 |
The experiment with Arabidopsis thaliana in a phytotrone raised highly significant level (Table 6) showing that in the dark the raw pH did not change in the interval from +18 to +35 °C (b = -0.0027 N.S.; Figure 5; Table 7) while under the light, the regression coefficients were significant and negative, progressing in acidification from a water levels high (-0.0097), to a normal (-0.0127), and to a low (-0.0370) .
Table 6. Effects of the water level, and light regimen, and the aerial temperature on the raw pH in Arabidopsis thaliana leaves (No. 104)| Factor | R 2 | CV% | RMSE | Mean | Prob. |
|---|---|---|---|---|---|
| Model | 0.84 | 2.70 | 0.16 | 6.07 | <.0001 |
| Water level High \ Normal \ Low | 0.0563 | ||||
| Light regimen Light \ Dark | 0.4894 | ||||
| Temperature (Water * Light) | <.0001 |
| Water | Light | b | sb | Prob. |
|---|---|---|---|---|
| High | Dark | -0.0027 | 0.0037 | 0.4698 |
| High | Light | -0.0097 | 0.0035 | 0.0069 |
| Normal | Light | -0.0127 | 0.0039 | 0.0015 |
| Low | Light | -0.0370 | 0.0035 | <.0001 |
Figure 5. Regression of raw pH of leaves in Arabidopsis thaliana (Y Axis) on the aerial temperature (Y Axis) for three water availability levels (High, Normal, Low) and in the Dark (in Water High).
Download figure
Symbiotic (Mycorrhizal and Microbial) Effects
The main factors were significant, with the two factor interaction near significant (Table 8). With reference to Table 9 the symbiotic factor was highly significant in all species except kiwi, with maximum effect in cherry (-7%), high effect in olive and hazelnut (-4%), medium effect in corn and blueberry (-3%), minor effect in vine (-2%).
Table 8. Two way ANOVA with species factor, combined with symbiotic factor and their interaction for in-vivo raw pH (No. 2133)| RMSE | P Species | P Symbiotic | P Interaction |
|---|---|---|---|
| 0.35 | <.0001 | 0.0004 | 0.0523 |
| Species | Raw pH .. | [H + ] | |||||
| No. | rank | C | S | Prob | S/C | Mean | |
| Vine | 1083 | a | 3.64 | 3.57 | 0.008 | -2% | 229 |
| Corn | 807 | b | 4.9 | 4.75 | <.0001 | -3% | 13 |
| Hazelnut | 56 | c | 5.16 | 4.94 | <.0001 | -4% | 7 |
| Blueberry | 46 | cd | 5.17 | 5 | 0.004 | -3% | 7 |
| Cherry | 40 | de | 5.43 | 5.05 | 0.014 | -7% | 4 |
| Kiwi | 29 | e | 5.44 | 5.54 | 0.474 | 2% | 4 |
| Olive | 72 | f | 5.78 | 5.57 | <.0001 | -4% | 2 |
| Total/Means | 2133 | 5.07 | 4.92 | -3% | 38 | ||
Pseudo-Relationship with the Fungicide Sprays
According to the EFSA Report on Collection of Pesticide Application Data in EU12 in 2013 the average number of active ingredients, formulations, products and sprays (spray rounds/spray passes) applied to each of the environmental field crops was very variable among crops. As far as apple, grapes and carrots crops are concerned in Italy, Poland, UK, and Spain the number of fungicides sprays applied were on average 16.67, 12.03 and 2.25 respectively (Table 10).
Table 10. Tabulated values from EFSA 12 of the Number of Fungicide Sprays (NFS) and raw pH for selected fifteen species.| Species | No. | pH | pH 2 | pH 3 |
|---|---|---|---|---|
| Fungicide | ||||
| Sprays | ||||
| Grape | 12.0 | 3.63 | 13.18 | 47.83 |
| Apple | 13.8 | 4.99 | 24.9 | 124.25 |
| Coffee | 4.0 | 5.33 | 28.41 | 151.42 |
| Tomato | 6.5 | 5.34 | 28.52 | 152.27 |
| Pear | 4.0 | 5.52 | 30.47 | 168.2 |
| Artichoke | 2.5 | 5.54 | 30.69 | 170.03 |
| Leek | 3.0 | 5.55 | 30.8 | 170.95 |
| Onion | 3.0 | 5.57 | 31.02 | 172.81 |
| Beet | 1.1 | 5.65 | 31.92 | 180.36 |
| Celery | 2.0 | 5.71 | 32.6 | 186.17 |
| Potato | 2.0 | 5.77 | 33.29 | 192.1 |
| Chicory roots | 1.0 | 5.81 | 33.76 | 196.12 |
| Carrot | 2.2 | 5.99 | 35.88 | 214.92 |
| Cavolfiore | 2.0 | 6.00 | 36.00 | 216.00 |
| Pumpkins | 2.1 | 6.38 | 40.72 | 259.81 |
When looking at the fungal pest occurrences a strong inverse polynomial relationship (R2 = 0.9) was interpolated among the mean pH of 15 species and the number of fungicide sprays (Table 11 and Figure 6).
Table 11. Polynomial regressions of the Number of Fungicide Sprays (NFS) on the raw pH in 15 species, or 14 species, grape excluded.| Equation | Terms | No. | R 2 | RMSE | Mean | Coeff . | SE | Prob |
| D | Intercept | 15 | 0.636 | 2.41 | 4.08 | 31.53 | 5.79 | 0.0001 |
| pH | -4.97 | 1.0432 | 0.0004 | |||||
| E | Intercept | 15 | 0.877 | 1.35 | 4.08 | -847.83 | 159.48 | 0.0002 |
| pH | 539.37 | 98.77 | 0.0002 | |||||
| pH2 | -109.29 | 19.86 | 0.0002 | |||||
| pH3 | 7.16 | 1.3 | 0.0002 | |||||
| F | Intercept | 14 | 0.52 | 2.36 | 3.51 | 42.92 | 10.94 | 0.002 |
| pH | -6.97 | 1.93 | 0.0036 | |||||
| G | Intercept | 14 | 0.9 | 1.04 | 3.51 | 437.31 | 55.27 | <.0001 |
| pH | -146 | 19.43 | <.0001 | |||||
| pH2 | 12.21 | 1.7 | <.0001 |
Figure 6. Relationships between the Number of o Fungicide Sprays and the mean Raw pH of the 15 species considered in Tab. 10. Equations parameters reported in Tab. 11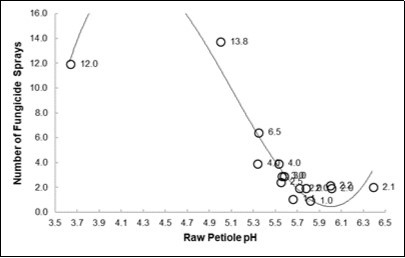
Download figure
The apple (pH = 4.99,Table 10) appeared as highly inclined to fungal attacks (NFS = 13.8) while the pear (5.52) was much less damaged by fungal diseases (NFS = 4). As opposite, for a bacterial disease (Table 12) the propensity of the farms to fire blight was 11.3% in pear vs. 0.89% in apple (P<0.0001), but when calculated per hectare the incidence were 22.48% vs. 0.35%, respectively. If one want to express the degree of relative risk, in the two species, we refer to the Odds Ratio (OR) method, then we see that a farm of pear will have and OR of 13 to be concerned with fire blight than a farm of apples. But according to the small size of the two kind of farms (0.45 vs. 2.55 ha for pear and apple, respectively) the OR will grow to 65 when considering a single plant of fruit, apple or pear.
Table 12. Outbreaks of the Fire Blight (Erwinia amylovora) in apple and pear, in the Bolzano Province (1999 to 2016), and relative incidence referred to farms and hectares| Species | Mean y -1 | SD | No. Farms | Incidence | Ha | Ha Incidence |
| Pear | 19 | 53 | 171 | 11.31% | 86 | 22.48% |
| Apple | 72 | 158 | 8014 | 0.89% | 20598 | 0.35% |
| Odds Ratio (Pear/Apple) | 13 | 65 | ||||
| z test | 9.34 | 30.4 | ||||
| Prob. | <0.0001 | <0.0001 | ||||
Discussion
“De acidula plantarum natura” subtitle could have shaped this paper, when looking at the low pH in leading crops and orchards. The model species Arabidopsis thaliana appeared as a low acidic one: the average raw pH value of the leaves at 25°C was 5.96. This value is near the vacuole pH (5.2) and the Golgi apparatus (6.3-6.8) but quite below the nucleus, plastid stroma and cytoplasm (7.2-7.3) and far below the mitochondria matrix (8.1)5. The first measurement results of pH on finely cut leaves of avocado were published long ago: Haas14 stated that no significant change in the pH of finely cut leaves or juice was noted over a wide pH range in the soil of avocado cultures; however, he did not consider the water status of the avocado trees. The mean observed value in avocado was 5.53 ±0.13, thus it could have been be placed at the 33th 50-1 position, just after pear in the ranking shown in Table 1. When regarding the literature, the raw pH has been ignored, except in the work of the proponents of the “Acid Growth Theory”15. A rare observation16 of leaves along a highway regarded the surface pH, which was found to be lower than that of the leaves at a distance from the road, but the pH level was found to increase when dust was deposited on the leaves. In fact, the acidic status of the plant depends on the sugars circulating in the phloem. An increasing level of sugars in sap extracted from non-functional poplars vessels was correlated to a decrease in the pH to around 5.5, while values of 6÷7 were registered in the functional vessels, which only contained traces of sugar17.
In an acidic environment, around 4.9 pH values, young barley leaves equipped by microprobes for [H+] and infected by powdery mildew fungus, apoplastic pH showed a rapid increase towards 5.4, then a more stable decrease around 4.8 at 2 h after infection, but at longer-term pH increased at 5.2 values (+6%)18. According the Authors, alkalization process seems to have the general goal to minimize and obstruct fungal growth biochemically.
In a broad scenario of plants the pH of phloem exudate is characteristically alkaline (pH 8.0 to 8.5) and belong from non-reducing sugars (sucrose), amides (glutamine and asparagine), amino acids (glutamate and aspartate) and organic acids19. Acidity of the whole green tissues has longely been utilized in silage operations; methods adopted to improve silage feeding value include rapid wilting and acidification, either by acids products or use of anaerobic inoculants20; however the pH of the raw material is not considered, at most the buffering power is taken into account.
The team of Cornelissen9,10elicited the leaf pH as a new plant trait and explored it as featuring in the carbon or nutrient cycling context in the framework of 92 species (Table 11) which quintile distribution appears quite similar to that of the present 49 species but discarded towards less acidic values (Figure 7).
Figure 7. Distribution in quintiles of the pH in the 49 Species of the present work compared with the 92 Species described by the Cornelissen team9.10.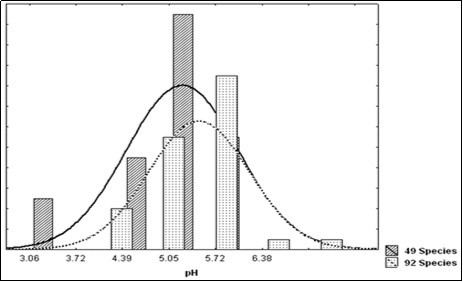
Download figure
The authenticity of the pH parameter has been highlighted10, upsetting the myth of the soil pH: as shown in Figure 8 in fresh leaves the leaf pH will rise only of 0.036 pHsoil-1 (about 0.7%) but in pre-dried herbages the inverse occurred (-0.4%). Important to note the differences in pHs: after pre-drying at 60°C for 48 h and reidratatying, the increase of pH was about 4.3%. This confirm the sense of the relationships pH-temperature-humidity (Table 13).
Table 13. Leaf pH Values in 92 species examined by Cornelissen team, ordered by values| Cornelissen et al. 10 Species | pH | Cornelissen et al. 9 Groups | pH |
| Ra, Rumex acetosella | 3.85 | Gymnosperm | 4.10 |
| Am, Achillea millefolium | 5.20 | Ericoid Myc | 4.10 |
| Ga, Galium aparine | 5.20 | Moss | 4.50 |
| Ca, Chamerion angustifolium | 5.25 | Ecto Myc | 4.65 |
| To, Taraxacum officinale | 5.30 | Carnivourus | 4.90 |
| Tc, Tanacetum vulgare | 5.40 | Fern allies | 5.10 |
| Eh, Epilobium hirsutum | 5.50 | Sedges and rushes | 5.18 |
| Pr, Papaver rhoea | 5.50 | Graminoids | 5.25 |
| Cs, Centaurea scabiosa | 5.55 | Dicot NMyc | 5.30 |
| Pl, Plantago lanceolata | 5.55 | Hemiparasite | 5.35 |
| Km, Koeleria macrantha | 5.85 | Nitrogen fixers | 5.49 |
| Fo, Festuca ovina | 5.90 | ||
| Lp, Lolium perenne | 5.93 | ||
| Bp, Brachypodium pinnatum | 5.95 | ||
| Ae, Arrhenatherum elatius | 6.00 | ||
| Pa, Poa annua | 6.00 | ||
| Dp, Digitalis purpurea | 6.01 | ||
| Ev, Eriophorum vaginatum | 6.02 | ||
| Ac, Agrostis capillaris | 6.05 | ||
| Dg, Dactylis glomera | 6.05 | ||
| Lc, Lotus corniculatus | 6.05 | ||
| Lh, Leodonton hispidus | 6.27 | ||
| Ao, Anthoxanthum odoratum | 7.60 |
Figure 8. Regression of the average Leaf pH of fresh or pre-dried herbages on the soil pH (data elaborated from Cornelissen et al.10).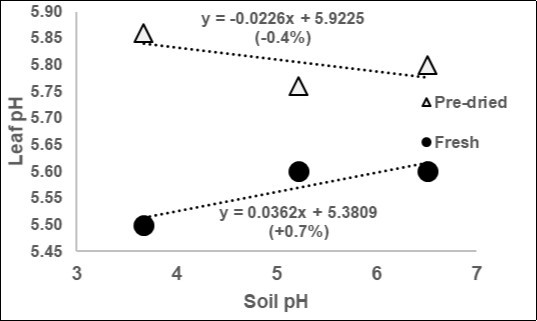
Download figure
As to the positive relationships between the pH and the water availability a primary apparent sign of stress is the rise in leaf temperature, an infrared sensed measurement basic for plant-water relations, and specifically for stomatal conductancemonitoring21. In the present work we have commensurate the drop in petiole raw pH to a water stress condition, but chiefly the linear drop was accounted for by the increase of aerial temperature (-0.07 pH °C-1); in fact in the equations C (Table 3) when the quadratic term was considered, the fit did not improve. It is well known that when the temperature roses over 25°C, the pH declines in force of the normal autoprotolysis - autoionization of the water. But it should be pointed out that the acidic solutions are affected less by this phenomenon than the alkaline ones, and especially when natural buffers are present. In eighteen selected deep eupeptic green solvents (DES, i.e. glycerol, ethylen glycol, lactic acid, malic acid .. etc.) the regression of the pH on the temperature over a range +25 ÷ +60°C was -0.018 ± 0.00622. These values are near our data from Arabidopsis thaliana in normal watering, but in high watering the value was reduced to -0.093 and, especially, in the dark the value was grown to zero, a null autoprotolysis – autoionization mechanism. Our findings highlight that the pH adjustment of the plant to a water-thermal-light environment is an active dynamic and not a passive process, which demand the presence of the light and may be different according the species. Lindenthal et al.23 showed in cucumber that downy mildew initial development shifted down -0.8°C the leaf temperature and this cooling was due to a correlated increase of transpiration rate (r = – 0.762).
An objective reason for the lack of studies is that measurement of the in vivo raw pH of green vegetable organs is not easy and, essentially, this measurement cannot be automated by chemical or (till now) spectroscopy. Instead, several attempts have been made in the liquid background to optimize the ingredients of the nutritive solution. Ferentinos and Albright3 in a hydroponic system, modelled the pH and the electrical conductivity in deeptrough devices by mean of a neural network. Domingues et al.4 developed an automated system to control the pH and concentration of nutrient solution in hydroponic crops. However, no monitoring or responsible feed-back from the plant was considered in terms of pH response. Yu et al.24 made several attempts to predict the so-called “apoplastic pH”, using agar or bead indicators, measurements of juices, weak acid influxes, ion-selective electrodes and optical probes, but no reliable method was found. Ten years later, Mc Millan et al.25, made new attempts to conduct inferential measurements, solution temperature correction, efficient calibration, noise minimization, location optimization, and predictive maintenance, by taking advantage of smart features and wireless communication. As published in New Frontiers in Plant Science26 the development and properties of genetically encoded pH sensors is a progredient research theme.
Faced with a multifaceted nature of the raw pH acidic wide range, it is possible to ask which lowest common denominator (a large entity) or which greatest common divisor (a small entity) should be considered? In the authors’ opinion, assuming the pH as a common divisor, in the pseudo-relationships NFS / pH (Figure 6) a common denominator is the propensity towards fungal attack when the pH is more acidic, with vinegrape and apple as driving species, but also the propensity towards bacterial attack when the pH is less acidic, where a clear demonstration outcomes from a balance among the apple vs. pear diseases (Table 12). Maize is a very acidic species; in Table 1 it is positioned as 8th /49, but it is excluded from the Table 10 because the number of fungicide treatments is very variable according the insecticide necessities; in fact, the resistance to fungal attacks is normally higher than what is actually recognized in the intensively cropped orchards and no one or few fungicide treatments are necessary; nevertheless, mycotoxin in cereals is a historical problem, but also an emergency in exceptionally warm and dry summers. Otherwise the occurrence of bacterial diseases in plants is much less frequent than in animals, and one reason could be exactly the acidic nature of the green matrices. Severe cases of bacterial Pseudomonas in Italy concerned the kiwifruit27. Note that the kiwi has a 5.49 pH, ranked as 27th /49, a not highly acidic band. On the other hand the Xylella fastidiosa rouinous attacks28 on Salento olive trees thrive in a intermediate raw pH band (olive is 13 / 49) and moreover the Flavescence dorèe of grapevine7 is an incursion of phytoplasmas in a very acid environment.
In perspective, the warming from climate change scenarios, could affect a rise in raw acidity of plants, fearing that fungicide sprays could be increased by one per C° degree rise. In the Figure 9 we have hypothesized a very high increase of +1.8°C in the average temperature; the major incidences as percentage of NFS increase, reside in the median 5.5 ÷ 5.9 pH range.
Figure 9. Hypothetical co-evolution of the raw pH (X axis) and the number of fungicide sprays after a very strong climatic change. A rebound of +1.8°C in aerial temperature decrease (-0.13) the pH and this shift of the Number of Fungicide Sprays (NFS) in absolute (▲, left Y axis) or relative % (∆, right Y axis) from the base relationship NFS * pH (○).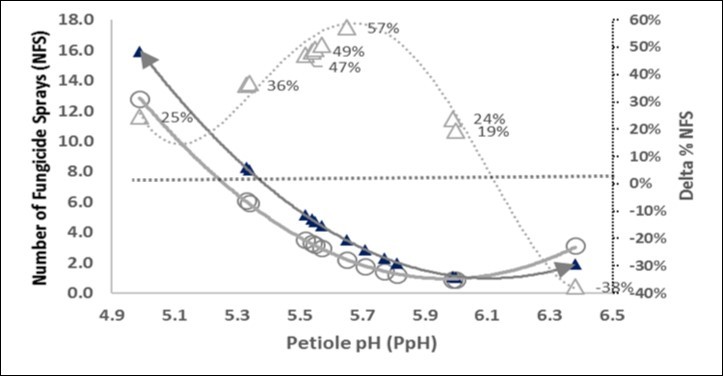
Download figure
The rise in aerial temperature will grew fungal as well as bacterial disease pressure. In a grapevine district Salinari et al.29have calculated that two more fungicide sprays were necessary under the most negative climate scenario, compared with present management regimes. The increase of presumed 1.8 C° will correspond in the present paper (Table 3, eq. A) at about -0.13 units of raw petiole pH and consequently the elevation in fungicide treatments could be estimated by Eq. D (Table 7) as 13.8 when the actual reference was 12.0. This means that in spite of the the external events regarding the life of the fungi and bacteria out of the crops, it could be introduced an internal category of biological mechanism, leading to increase the acidity circulating in the petiole and leaves, and - unfortunately - this event is favourable to a further increase of fungal diseases. Indeed already now vinegrape are being subjected to an ever increasing problem from fungi. A notable increasing trend of fungicide treatments in France30 is apparent, as the national vineyard district showed 12.4 ± 3.3 NFS in 2013 vs 9.7 ± 2.7 in 2010, which means a rise of +10% per year.
Conclusion
At precision farming operational plan, the raw pH could be considered as metabolic signal of water stress; moreover, vibrational spectroscopy in NIR range could be correlated with it beyond the thermal infra-red (IR) signature.
Symbiotic farming is a sustainable and resilient ausilium to preserve and improve soil fertility, where the raw pH could be a response sign of efficiency for microbial biota evolution in the rhizosphere.
In perspective, the warming of plants from climate change scenarios, could push a rise in plant acidity, fearing that fungicide sprays could be increased in future, moreover when considering the consequences from a strong negative impact of the water stress on the raw pH.
A suggestive paradoxal challenge is given by the acidifying reaction of arbuscular mycorrhizae which instead of favouring the conditions for development of fungus damages, apparently trigger defensive mechanisms against the mycotoxins31.
The raw pH is candidate to became a multifaceted parameter in front of a dilemma: if the atmosphere, the oceans and the soils are acidifying why not the plants?
References
- 1.Mulder C, F S Ahrestani, Bahn M, Bohan D A, Bonkowski M et al.Connecting the green and brown worlds: allometric and stoichiometric predictability of above- and below-ground network. , Advanced Ecology Research 49, 69-175.
- 2.Husson O. (2013) Redox potential (Eh) and pH as drivers of soil/plant/microorganism systems: a transdisciplinary overview pointing to integrative opportunities for agronomy. Plant and Soil,362:. 389-417.
- 3.Ferentinos K P, Albright L D. (2002) Predictive neural network modeling of pH and electrical conductivity in deep–trough hydroponics. , Transactions of the ASAE American Society of Agricultural Engineers 45, 2007-2015.
- 4.Domingues D S, Takahashi H W, Camara CAP, Nixdorf S L. (2012) Automated system developed to control pH and concentration of nutrient solution evaluated in hydroponic lettuce production. , Computers and Electronics in Agriculture: 84, 53-61.
- 5.Shen J, Zeng Y, Zhuang X, Sun L, Yao X et al. (2013) Organelle pH in theArabidopsisendomembrane system. , Mol. Plant 6, 1419-1437.
- 6.Masoero G, Giovannetti G. (2015) pH testify the acidification of the maize treated by mycorrhizal and microbial consortium. , Journal of Environmental and Agricultural Sciences 3, 23-30.
- 7. (2014) EFSA PLH Panel (EFSA Panel on Plant Health). Scientific Opinion on pest categorization of Grapevine Flavescence Dorée. , EFSA Journal 12, pp..
- 8.Masoero G, Cugnetto A, Giovannetti G. (2017) Consorzi microbici, riduttori del pH in vivo, contro la Flavescenza Dorata: primi risultati in Piemonte: L’enologo. 3, 79-82.
- 9.Cornelissen JHC, Quested H M, RSP Van Logtestijn, Pe´rez-Harguinde-guy N, Gwynn-Jones D et al. (2006) Foliar pH as a new plant trait: can it explain variation in foliar chemistry and carbon cycling processes among subarctic plant species and types?. , Oecologia 147, 315-326.
- 10.Cornelissen JGC, Sibma F, RSP Van Logtestijn, Broekman R A, Thompson K. (2011) Leaf pH as a plant trait: species-driven rather than soil-driven variation. , Functional Ecology 25, 449-455.
- 11.Masoero G, Peiretti P G, Cugnetto A, Giovannetti G. (2018) Raw pH fall-out as a sign of a mycorrhizal modifier ofSorghumsudanensis. , Journal of Agronomy Research 1(2), 1-11.
- 12.Garthwaite D, Sinclair C J, Glass R, Pote A, Trevisan M et al. (2015) Collection of Pesticide Application Data in View of Performing Environmental Risk Assessments for Pesticides. EFSA supporting publication 2015:EN-846:. 246.
- 13.IPA-BZ. (2016) FB Faelle nach Pflanzenart,1999-2016. Retrieved from:http://www.provincia.bz.it/agricoltura/download/FB-Faelle_nach_Pflanzenart_09.11.2016.pdf.
- 15.Rayle D L, Cleland R E. (1992) The acid growth theory of auxin-induced cell elongation is alive and well. , Plant Physiol 99, 1271-1274.
- 16.Keller H F, Flucliger W, Oertli J J. (2005) Changed pH – values on the vegetation along a motorway. , J. of Chemical Ecology,11: 153 – 157.
- 17.Secchi F, Zwieniecki M A. (2012) Analysis of Xylem Sap from Functional (Nonembolized) and Nonfunctional (Embolized) Vessels ofPopulusnigra: Chemistry of Refilling. , Plant Physiology 160, 955-964.
- 18.Felle H H, Herrmann A, Hanstein S, Hückelhoven R, Kogel K H. (2004) Apoplastic pH signaling in barley leaves attacked by the powdery mildew fungusBlumeriagraminisf. sp.Hordei. Molecular Plant-Microbe Interactions. , MPMI 17, 118-123.
- 19.Milburn J A, Baker D A. (1989) Physico-chemical aspects of phloem sap. In Baker, DA Milburn JA eds, Transport of Assimilates , Longman, Harlow 345-359.
- 21.Jones H G, Serraj R, Loveys B R, Xiong L, Wheaton A et al. (2009) Thermal infrared imaging of crop canopies for the remote diagnosis and quantification of plant responses to water stress in the field. , Functional Plant Biology 36, 978-989.
- 22.Skulcova A, Russ A, Jablonsky M, Sima J. (2018) . The pH Behavior of Seventeen Deep Eutectic Solvents.BioResources 13, 5042-5051.
- 23.Lindenthal M, Steiner U, Dehne H W, Oerke E C. (2005) Effect of downy mildew development on transpiration of cucumber leaves visualized by digital infrared thermography. , Phytopathology 95, 233-240.
- 24.Yu Q, Tang C, Kuo J. (2000) A critical review on methods to measure apoplastic pH in plants. , Plant and Soil 219, 29-40.
- 25.Millan Mc, Montgomery G, R, Wang T. (2010) Opportunities for smart wireless pH, conductivity measurements. Retrieved from:www.isa.org/standards-and-publications/isa-publications/intech-magazine/2010/february/web-exclusive-opportunities-for-smart-wireless-pH-conductivity-measurements/
- 26.Martinière A, Desbrosses G, Sentenac H, Paris N. (2013) Development and properties of genetically encoded pH sensors in plants. , Front. Plant Sci 4, 523-1.
- 27.Scortichini M. (1994) Occurrence ofPseudomonas syringepv.actinidiaeon kiwifruit in Italy. , Plant Pathology 43, 1035-1038.
- 28. (2015) EFSA PLH Panel (EFSA Panel on Plant Health). Scientific Opinion on the risks to plant health posed byXylellafastidiosain the EU territory, with the identification and evaluation of risk reduction options. , EFSA Journal 13, 3989-262.
- 29.Salinari F, Giosuè S, Tubiello F, Rettori A, Rossi V et al. (2006) Downy mildew (Plasmoparaviticola) epidemics on grapevine under climate change. , Global Change Biology 12, 1299-1307.
Cited by (18)
This article has been cited by 18 scholarly works according to:
Citing Articles:
MethodsX (2026) Crossref
Journal of Applied Microbiology (2025) Crossref
S. Matić, Giorgio Masoero, Andrea Egidi, C. Francese, Pier Paolo Capra et al. - Computers and Electronics in Agriculture (2025) Semantic Scholar
Computers and Electronics in Agriculture (2025) Crossref OpenAlex
R. Sutulienė, A. Brazaitytė, M. Urbutis, S. Tučkutė, P. Duchovskis - Plants (2024) Semantic Scholar Crossref OpenAlex
Giorgio Masoero, G. Sarasso, M. Delmastro, Renato Delmastro, Massimiliano Antonini et al. - Journal of Agronomy Research (2023) Semantic Scholar Crossref OpenAlex
Journal of Plant Ecology (2022) Crossref OpenAlex
Forests (2022) Crossref OpenAlex
Magdalena Smoktunowicz, Joanna Jońca, Aneta Stachowska, M. May, M. Waleron et al. - Pathogens (2022) Semantic Scholar Crossref OpenAlex
Journal of Agronomy Research (2021) Crossref OpenAlex
O. Husson, J. Sarthou, L. Bousset, A. Ratnadass, H. Schmidt et al. - Plant and Soil (2021) Semantic Scholar Crossref OpenAlex
Journal of Agronomy Research (2020) Crossref OpenAlex
Journal of Agronomy Research (2020) Crossref OpenAlex
Journal of Agronomy Research (2020) Crossref OpenAlex
L. Pinheiro, C. Pereira, Carolina Frazão, V. Balcão, A. Almeida - Microorganisms (2019) Semantic Scholar Crossref OpenAlex
Journal of Agronomy Research (2019) Crossref Semantic Scholar OpenAlex
Journal of Agronomy Research (2019) OpenAlex
Journal of Agronomy Research (2019) Crossref OpenAlex