Colored Anti-Hail Nets Modify the Ripening Parameters of Nebbiolo and a Smart NIRS can Predict the Polyphenol Features
Abstract
In the cultivation of vines the risk of hail appears to be increasing with the ongoing climate change. The use of protective plastic nets is spreading, but there is little knowledge on the additional processing costs and on the phenological and qualitative consequences, moreover, as depending on different colors of the nets. Thus, a randomized trial was carried out in Nebbiolo, a wine of great aging, testing three plastic anti-hail nets colored in green, gray and black. Results showed that 24% more-time was necessary for the canopy management practices under the nets. The black nets advanced the ripening process, with a berry weight decrease of about 13%. A significant decrease in the seed number per berry was observed under the black nets (-45%), while a rise (+102%) was observed under the green and gray nets with a parallel increase in the pH of the juice (+13%) and in malic acid (+28%) under the green nets. The berry skin did not show any significant differences in polyphenol and anthocyanin profiles, while the plants that matured in the upper part of the vineyard showed higher level in the berry skin extractable flavan-reactive to vanillin, and total polyphenol. On the other hand, in the seeds grown under green nets an increase in the extractable polyphenol compounds was observed, sign of a delay in seed ripening, with a higher tannin polymerization ratio, preserving the malic acid, and decreasing the acidity of the berry. In conclusion, the use of colored green may be a useful tool against excessive microclimatic warming and / or irradiation. The field internal variability affects much more the ripening dynamics than the nets used.
A second aim was to develop a smart NIR SCiOTM model for polyphenols and the results were in line with the favorable expectations, providing R2 predictions of about 0.74 from the skin and 0.81 from the seeds.
Article Information
- Received
- Accepted
- Published
Academic Editor: Abubaker Haroun Mohamed Adam, Department of Crop Science (Agronomy), College of Agriculture, Bahri University- Alkadaru- Khartoum -Sudan.
Checked for plagiarism: Yes
Review by: Single-blind
Copyright © 2021 Alberto Cugnetto, et al.
 This is an open-access article distributed under the terms of the Creative Commons Attribution License, which permits unrestricted use, distribution, and reproduction in any medium, provided the original author and source are credited.
Corresponding author: Giorgio Masoero, Accademia di Agricoltura di Torino, Via A. Doria 10, 10123 Torino (Italy) —
Competing Interests
The authors have declared that no competing interests exist.
Funding
No specific funding statement was provided by the authors.
Data Availability
No data-availability statement was provided by the authors.
Acknowledgements
Warm thanks are due to Enrico Serafino SRL - Poderi Antonio Gentile SSA Monforte d’Alba (CN) having sponsored the research. Thanks to the Fondazione Cassa di Risparmio di Torino, for the financial support to the Accademia di Agricoltura di Torino and to the co-Academician Prof. Vittorino Novello, Vice-President of the International Organization of Vine and Wine Vineyard commission, for his valuable scientific contribution.
Citation:
Introduction
The climate change that is currently underway involves the most dangerous weather events, including hail events, becoming extreme. Hail can do considerable damage to grapevines by damaging their bark, leaves and fruit. Hail can also cause significant injury to young, thin-barked vines; falling hailstones create wounds that compromise the bark of the vine. A wound is considered as any break in the outer protective bark of a plant that exposes the xylem. After this occurs, new spaces and nutrients become available to several organisms, including insects and pathogens, thereby creating quantity and quality damage and sometimes injuries that can have consequences for more than one year after the event, or that may even lead to the death of plants. When hail damage of fruit occurs, the results can be devastating. Hail damage during the early development stages of fruit setting can cause scarring or berry losses. Hail at or after veraison leads to fruit rot. Defoliation may also occur as a result of hail and, in severe instances, it can lead to a delay in fruit maturation and an excess development of the lateral shoots. In rare instances, the retraining of vine parts may be necessary, if the damage is extensive.
One of the methods adopted to protect vines totally or partially from hail is to cover the canopy with plastic nets.
The application of such nets, apart from involving the cost connected to the purchasing of the material and the greater difficulties of carrying out manual operations on the canopy, could have significant secondary effects on the ripening dynamics of the grapes 1, 2, 3, 4. The induced artificial shade can reduce the photosynthetic potential of the leaves and change the microclimate conditions of the bunch.
According to Castellano et al. 5, this is important to various degrees, depending on the following factors: - the application period; - the color and type of the net material; - the % of leaf coverage (total or partial).
This kind of side effect may also prove positive on maturation, under certain conditions, especially in the years when an excessive early ripening is induced and when the temperatures and summer sun could cause an unbalanced maturation (see, for example, the 2003, 2015, 2020 vintages in Piedmont) or even grape burn.
The climate change that is occurring will probably lead to frequent very hot and dry years with a marked impact on the quality of the product 6. The evaluation of the application of anti-hail nets, which as yet have been studied very little in wine-growing areas, to induce a change in the physiology of the vine in order to counteract negative climatic effects, such as sun burn 7, could be an important innovation for viticulturists, if high-quality grape production is their aim.
In such a context, an experimental protocol was set up to scientifically evaluate the secondary ripening effects of nets, canopy management and the implications of the working operation timings.
Measuring the phenolic compounds by means of chemical techniques, such as chromatography and mass spectroscopy, enables very accurate results to be achieved, but is impractical when the workflow is accelerated. Physical Near InfraRed Spectroscopy (NIRS) techniques represent an emerging analytical procedure, which is enjoying increasing popularity in the industry as it is a non-destructive, environmentally friendly and rapid technique. Bench NIRS instruments have been used to determine various parameters in grapes, such as the total polyphenols, extractable anthocyanins8, and phenolic compounds 9, 10. Portable NIR devices have been implemented in the viticulture sector to assess and monitor the ripeness of grapes directly in the field. Phenol ripening parameters, such as the anthocyanin and polyphenol concentrations, have been evaluated 11, 12, 13. In the present experiment, the use of a portable, low-cost NIR instrument has been studied on trimmed skin and seeds to evaluate the possibility of predicting the polyphenol content in raw grapes and after hydro-alcoholic extraction.
Material and Methods
Plant Management
The trial was conducted at the Monforte “Mosconi” vineyard (Enrico Serafino SRL - Poderi Antonio Gentile SSA Monforte d’Alba (CN)). The vineyard has a complete southern exposure and is located at 450 m.s.l. The monitoringperiodlasted 5 months (from 15/05/2016 to 15/10/2016). Three types of colored plastic net (Caliber: 0.32 mm; Mesh: 3 x 7 mm; Weight: 52 g m-2, Height: 100 cm) were used for the experiment: “Carbon black”; “Gray” and “Black Green”.
The reduction in solar light transmittance is 14 % for the Gray, 15% for the Green and 17 % for the Black nets.
A total of 75 Nebbiolo vine plants were involved. The nets were placed before May 30th. The nets were placed at BBCH 57 phenological stage, when inflorescences were fully developed and flowers separating, and they were removed after the harvest. Five treatments were studied, and triple-randomized experimental blocks were set up, each with five adjacent plants. The three blocks were arranged at different elevations in the vineyard with an overall difference in height of about 18 m. Of the five experimental treatments, two were managed without nets and three with net coverage; one was managed by manually removing all the leaves and young shoots around the bunches just after flowering (A), and one was managed by keeping all the original leaves around the bunch but cutting the lateral shoots (B) (this is the traditional method used in the area). The other three treatments involved covering the vines with nets (C, D, E) and treating them as treatment A, that is, removing the leaves and shoots just after flowering (BBCH 71).
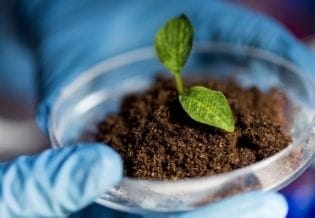
The C treatment involved covering the vines with a black net, while the D and E plots were covered with green and gray nets, respectively. How the experimental blocks were prepared is shown in Figure 1.
Figure 1. Setup of the “Hail net” experiment. Leaf and shoot removal just after flowering (BBCH 71) can be observed in the lower picture
Download figure
Sampling from Flowering to Maturation
The phenological stages, the damage created by the sun or by hail and other parameters listed below were checked for each experimental plot.
Sampling at Harvest
Five plants were collected, in a randomized way, from each experimental block and 350 berries were cut with their pedicels. Of these 350 berries: 50 (10 berries/plant) were used to check the berry weight; 50 (10 berries/plant) were used to check the technological ripening parameters; 250 (50 berries/plant) were used to check the phenolic ripeness and phenol content. The main phenological stages were determined on the basis of: the number of canes/plant; the number of clusters/plant; the weight of the berries the % of sun burned berries; the % of berries damaged by hail; the green pruning operation timing (min/plant).
Phenolic Ripeness and Content, and the Anthocyanin Profile of the Berries
The technological ripening parameters of the juice were determined at harvesting:Sugars g/L (as the sum of glucose and fructose); titratable acidity as H2T g/L; pH; Free Nitrogen Available for yeast (FAN); Malic Acid g/L. The latter two parameters were measured, together with the sugars, with a FOSS infrared instrument. The berry samples obtained with the pedicels, were manually pressed in a plastic bag and before the analysis the juice was filtered up to 5 NTU turbidity.
The flavonoids were analyzed at the CREA-ENO laboratory (Asti, Italy) using some of the most widely used spectrophotometric methods 14under optimized conditions for red wine analysis 15. The polar compounds were loaded and washed at a low pH with diluted sulfuric acid, to improve the recovery of such acidic phenols as gallic acid. The total phenol content (TP) was assessed by considering the reduction of the phosphor tungstic-phosphomolybdi acids(Folin-Ciocalteu’s reagent) to blue pigments by phenols in an alkaline solution. Concentrations were determined by means of a calibration curve as (+)-catechin, mg/kg of grape. The proanthocyanidine index (PC) was evaluated by considering its transformation into cyanidin by means of the method of Di Stefano et al. 16, which uses iron salts as a catalyst, to increase the reproducibility of the cyanidin yield and replaces n-butanol with the optimal percentage of ethanol. Under such conditions, the average yield was estimated to be 20%, and the PC concentration (mg/kg of grape) was conventionally expressed as five times the amount of formed cyanidin, by means of a calibration curve with cyanidin chloride (ε = 34700). The catechins and proanthocyanidines reactive to the vanillin parameter (FRV) - were analyzed using the optimized and controlled vanillin-HCl method of Broadhurst and Jones 17, according to the conditions described by Di Stefano et al. 14 Concentrations were calculated as (+)-catechin (mg/kg of grape) by means of a calibration curve. An aliquot of 5 mL of red grape extract, diluted (5–20 times, to obtain a final reading in the 0.3–0.6 AU range) with 0.5M H2SO4 was loaded onto a conditioned Sep-Pak to establish the total anthocyanins index (TA). The column was washed with 2mL of 5mM H2SO4, and the red pigments were eluted with 3mL of MeOH into a 20mL calibrated flask. The extractable Anthocyanis (EA) were quantified directly based on their maximal absorbance in the visible range (536–542 nm), according to the methods described by Di Stefano et al. 14. The flavonoid index (F) was estimated spectrophotometrically based on their absorbance at 280 nm, according to the literature 14, and the data were presented as equivalents of (+)- catechin, mg/L.
Statistical Analyses
Univariate analyses were conducted with the SAS v.9.0 software. Significant differences between the five treatments were assessed by means of PROC GLM with the LSMeans / PDIFF command, adjusted according to Bonferroni. Multivariate analyses were performed on the whole dataset of 32 examined variables, with XLSTAT software 18 The aim of such analyses is that of associating some more important compounds and characteristics with the respective elevation order in the vineyard on the hill, coded as 1=Low (bottom row), 2=Medium, 3=High (top row) over a total range of 18 m of elevation.
NIRS Analyses
The reflectance spectra of the hand trimmed fresh skin and seeds aggregated in triple masses of 30 grains were acquired using an NIR SCiOTM v. 1.2 device, 19 (Figure 2) operating over the 740-1070 nm range, protected by a magnetic spacer capsule. Three independent spectra were scanned from each analytical sample. A Random Forest algorithm inherent to the Lab-SCiOTM software was used for the classification of the skin and seed of the five treatments; a probability vs. threshold of 20% was tested using the online version of Med-Calc for percentage comparisons. The NIR spectra were downloaded from the SCiOTM repository, and then imported in WinISI II v1.04 (FOSS NIRSystem/Tecator, Infrasoft International, LLC) software compatible format. A calibration-cross-validation modified partial least squares method of the first derived reflectance spectra was fitted for the group average of each laboratory variable. The outliers were discerned after one passage at t>2.0. No math pretreatment was adopted, so that the Partial Least Square (PLS) models with 331 coefficients plus a constant could be used in new vine skin and seed datasets from spectra recorded by a SCiOTM instrument and downloaded from a repository. To understand Whether any of the spectral positions in the five treatments overlapped, the average reflectance spectra were submitted to a principal coordinate analysis (PCoA) and subsequent agglomerative hierarchical clustering (CHA).
Figure 2. SCiOTM device being used to scan the 30 grape seeds.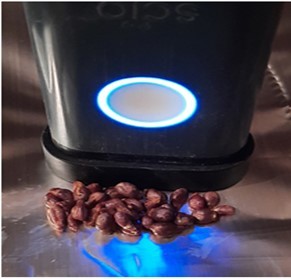
Download figure
Results
Green Pruning Operation Timings
The timings necessary to perform the “Green” pruning operations in the treatment, (complete leaf and lateral shoots removal around the cluster) with and without a hail net application, are reported in Table 1.
Table 1. Average timings measured for the manual green pruning operations. The hours/ha were calculated considering 5.500 plants/ha.| Treatments | Seconds/ Plant | St.dev | Hours/ha | Delta/ B % |
|---|---|---|---|---|
| B1- Shoots | 33.7 | 6.2 | 51 | |
| A2- Leaves+Shoots | 48.6 | 6.1 | 74 | +44 |
| C, D, E 3- Leaves+Shoot+nets | 60.1 | 8.2 | 92 | +24 |
As can be seen from the table, the average timing necessary to cut all the lateral shoots (B) on each plant is on average 33.7“(51 h/ha), where the timing necessary to cut the leaves around the bunches (A) is 48.6“(74 h/ha), which means a delta of 44 % compared to the previous case (B). The timing necessary to cut the leaves and shoots below the nets (C, D and E) is 60.1” (92 h/ha), which means an increase of 24 % compared to the same treatment managed without the nets (A).
Determination of the Main Phenological Stages, and Evaluation of the Sun Burn and Hail Damage
The main phenological stages were evaluated from flowering to harvest. No differences were observed between the treatments up to the start of veraison. Only at 10 d post veraison was the ripening process in the “black net” treatment clearly in advance, with the berry coloring being completed a few days before the others.
A slight difference was observed, regarding sun burn, between the net treatments (C, D and E) and the reference treatments (A and B), although the damage was acceptable (< 5 %). No differences were observed between the net treated treatments (C, D and E).
Only in one case did a weak hailstorm affect the vineyard during the summer. A large amount of mechanical damage was observed in the “non-treated” treatments (A, B), but with damage always below 5%.
Cluster/Cane rate
The cluster/cane rate of each plant was determined to verify whether the five treatments had the same production potential. The average cluster/cane results are reported in Table 2.
Table 2. Average cluster/cane rates for the five experimental treatments| Treatments | Cluster/Cane | St.dev |
|---|---|---|
| A- Leaves + Shoot removal | 0.77 | 0.38 |
| B- Shoot removal | 0.82 | 0.30 |
| C- Black net + Leaves + Shoot removal | 0.89 | 0.39 |
| D- Green net + Leaves + Shoot removal | 0.96 | 0.32 |
| E- Gray net + Leaves + Shoot removal | 0.85 | 0.26 |
As can be seen in the table above, no significant differences emerge for cluster/cane rate.
It is therefore possible to exclude that the results were affected by the different production potential of the treatments.
Berry Weight and Seed Number
The results pertaining to the average berry weight of the five treatments under study are reported in Table 3.
Table 3. Average berry weight and seed number of the five experimental treatments| Treatments | Berry weight (g) | St.dev | Seeds/Berry | St.dev |
|---|---|---|---|---|
| BW | S/B | |||
| A- Leaves + Shoot removal | 1.66 a | 0.16 | 1.60 b | 0.52 |
| B- Shoot removal | 1.78 a | 0.17 | 1.47 b | 0.52 |
| C- Black net + Leaves + Shoot removal | 1.48 b | 0.21 | 0.85 c | 0.59 |
| D- Green net + Leaves + Shoot removal | 1.70 a | 0.15 | 2.90 a | 0.57 |
| E- Gray net + Leaves + Shoot removal | 1.67 a | 0.37 | 3.30 a | 0.48 |
As can be seen in the table, only the black net (C) shows a significant difference (p<0,05) in the berry weight compared to the other treatments, with an average weight of 1.48 g/berry, while the others show an average of 1.70 g/berry (-13%). As far as the number of seeds in a berry is concerned, one result points out a high number under the “colored” nets (D, E), where an average increase of 102% (vs. A, B) was measured, while C decreases the seed number by 45%.
Technological Ripening Parameters
The only juice parameters that evidenced a significant difference between the treatments at ripening were the pH and the malic acid content (Table 4).
Table 4. Average values of the technological ripening parameters of the five experimental treatments| Sugars | pH | Total Acidity | Malic Acid | Free Available Nitrogen | |
| TA | MA | FAN | |||
| g/L | g/L | g/L | mg/L | ||
| A- Leaves + Shoot removal | 250.4 | 3.14 b | 6.89 | 0.93 b | 41.31 |
| St.dev | 10.1 | 0.07 | 0.5 | 0.3 | 25.52 |
| B- Shoot removal | 256.1 | 3.19 b | 6.77 | 1.16 ab | 49 |
| St.dev | 4.7 | 0.07 | 0.51 | 0.35 | 17.19 |
| C- Black net + Leaves + Shoot removal | 254.4 | 3.14 b | 6.98 | 1.08 b | 48.57 |
| St.dev | 7.8 | 0.08 | 0.27 | 0.25 | 16.08 |
| D- Green net + Leaves + Shoot removal | 254.6 | 3.21 a | 7.04 | 1.37 a | 42.15 |
| St.dev | 6.4 | 0.09 | 1.03 | 0.4 | 17.6 |
| E- Gray net + Leaves + Shoot removal | 254.9 | 3.21 a | 6.9 | 1.09 ab | 47.5 |
| St.dev | 5.4 | 0.09 | 0.39 | 0.41 | 19.33 |
Considering the pH of the juice, the D (green net treatment) and E (gray net treatment) treatments show a higher average level (3,21) than the other treatments (+13%), with the lowest content found in the A (leaves and shoots removal) and C samples. This is partially consistent with the malic acid content, which shows a similar trend for the pH, for the D treatment, and shows the highest content (1.37 g/L= +28%) and for the A treatment, which shows the lowest content (0.93 g/L).
Phenolic Ripening Parameters and Skin Anthocyanin Profile
The berry skin did not show any significant differences in the polyphenol profiles of the raw or of the extracted matrices (Table 5).
Table 5. Average values of the phenolic ripening parameters of the skin for the five experimental treatments.| Treatments | Skin - Total | Skin - Extractable | ||||||||
| Total Phenol | Anthocyans | Flavnoid | Total Phenol | Anthocyan | Flavnoid | Proanthocyanidines | Flavan Reactive to Vanillin | Anthocyans% | FRV/PC rate | |
| SkT_TP | SkT_A | SkT_F | SkE_TP | SkE_A | SkE_F | SkE_PC | SkE_FRV | SkE_A% | SkE_ FRV/PC | |
| mg/kg | mg/kg | mg/kg | mg/kg | mg/kg | mg/kg | mg/kg | mg/kg | % | n | |
| A- Leaves + Shoot removal | 1773 | 645 | 1943 | 1141 | 343 | 1277 | 1958 | 980 | 53 | 0.50 |
| St.dev | 235 | 58 | 155 | 62 | 48 | 61 | 96 | 96 | 4 | 0.03 |
| B- Shoot removal | 1638 | 613 | 1877 | 1026 | 310 | 1227 | 1839 | 934 | 51 | 0.51 |
| St.dev | 154 | 67 | 160 | 76 | 49 | 130 | 204 | 59 | 6 | 0.05 |
| C- Black net + Leaves + Shoot removal | 1776 | 625 | 2009 | 1075 | 345 | 1332 | 1895 | 1063 | 54 | 0.56 |
| St.dev | 231 | 74 | 88 | 93 | 92 | 181 | 249 | 141 | 1 | 0.05 |
| D- Green net + Leaves + Shoot removal | 1832 | 586 | 1969 | 1094 | 300 | 1270 | 2034 | 1059 | 51 | 0.53 |
| St.dev | 122 | 34 | 172 | 103 | 22 | 140 | 330 | 134 | 5 | 0.08 |
| E- Gray net + Leaves + Shoot removal | 1776 | 621 | 1993 | 1034 | 357 | 1266 | 1818 | 1043 | 57 | 0.58 |
| St.dev | 266 | 66 | 302 | 69 | 47 | 131 | 156 | 170 | 3 | 0.1 |
Moreover, the anthocyanin profile of the skin extracts of the experimental berry samples was uniform (Table 6).
Table 6. Average % values of the phenolic ripening parameters of the berries for the five experimental treatments| Delfinidine | Cianidine | Petunidine | Peonidine | Malvidine | Anthocyans acetate | Anthocyans cinnamates | |
| A- Leaves + Shoot removal | 2.5 | 15 | 3.1 | 54.9 | 15 | 3.4 | 6.2 |
| St.dev | 0.5 | 2.7 | 0.4 | 1.6 | 3 | 0.2 | 0.2 |
| B- Shoot removal | 3.1 | 14.8 | 3.5 | 53.2 | 16.2 | 3.3 | 5.9 |
| St.dev | 0.6 | 1.5 | 0.6 | 4.3 | 3.4 | 0.4 | 0.2 |
| C- Black net + Leaves + Shoot removal | 3.0 | 14.2 | 3.5 | 52.9 | 16.6 | 3.4 | 6.3 |
| St.dev | 0.3 | 1.4 | 0.3 | 2.7 | 2.6 | 0.2 | 0.4 |
| D- Green net + Leaves + Shoot removal | 2.9 | 15.4 | 3.3 | 54.4 | 14.5 | 3.4 | 6.1 |
| St.dev | 0.1 | 2.0 | 0.2 | 1.6 | 0.9 | 0.3 | 0.2 |
| E- Gray net + Leaves + Shoot removal | 2.9 | 14.2 | 3.6 | 53.4 | 16.6 | 3.3 | 6 |
| St.dev | 0.1 | 1.2 | 0.2 | 1.5 | 2.6 | 0.3 | 0.4 |
Phenolic Ripening Parameters of the Seeds
However, the net treatments showed significantly different effects for the extractable phenolic composition of the seeds (Table 7).
Table 7. Average values of the phenolic ripening parameters of the seeds for the five experimental treatments| Treatments | Seeds - Total | Seeds - Extractable | |||
| Total Phenol | Total Phenol | Proantho cyanidines | Flavans Reactive to Vanillin | FRV / PC ratio | |
| SeT_TP | SeE_ TP | SeE_ PC | SeE_FRV | SeE_FRV/PC | |
| mg/kg | mg/kg | mg/kg | mg/kg | n | |
| A- Leaves + Shoot removal | 1758 | 419 ab | 441 b | 367 | 0.84 ab |
| St.dev | 56 | 56 | 66 | 58 | 0.1 |
| B- Shoot removal | 1745 | 524 a | 462 b | 411 | 0.89 a |
| St.dev | 197 | 115 | 86 | 93 | 0.06 |
| C- Black net + Leaves + Shoot removal | 1858 | 422 ab | 375 b | 298 | 0.80 ab |
| St.dev | 272 | 86 | 74 | 67 | 0.13 |
| D- Green net + Leaves + Shoot removal | 1908 | 419 ab | 638 a | 413 | 0.68 b |
| St.dev | 103 | 99 | 153 | 104 | 0.11 |
| E- Gray net + Leaves + Shoot removal | 1703 | 369 b | 557 a | 397 | 0.73 ab |
| St.dev | 169 | 100 | 172 | 104 | 0.07 |
As can be seen above, the total extractable phenols (TP) are minimum (369 mg/kg) in treatment E (gray), while the level reaches a maximum in group B (+53% vs. E). On the other hand, the extractable proanthocyanidines (PC) of the seeds in the treatments with the green and gray nets are 33% greater than the others. The vanillin reactive flavans (FRV) appear uniform between treatments, but when related to the PC, the FRV/PC ratio results to be significantly reduced in treatment D (Black) and 30 % elevated in treatment B.
The Influence of the within-Vineyard Elevation
The effect of the elevation in three strata within the vineyard was globally considered through an overall set of 29 variables (Table 8). Increases in the flavans and extractable polyphenols can be noted for the higher elevation, especially those of the skins, and then in the polyphenols extractable from the seeds, probably in response to the greater temperature range at the top of the vineyard. On the other hand, in the valley part of the vineyard, the skin has been modified by an accumulation of flavonoids (the most negative PLS coefficient), total polyphenols and extractable proanthocyanidines. Figure 3
Table 8. Standardized Partial Least Squares coefficients of the three-stratum elevation in the vineyard (1= Low-Bottom 2=Medium, 3=High-Upper for 32 examined variables. Only the extreme variables are displayed| Akr | Organ | Compound | PLS std.coeff. |
|---|---|---|---|
| SkE_FRV | Skin - Extractable | Flavans Reactive to Vanillin | 0.0067 |
| SkE_TP | Skin - Extractable | Total Phenol | 0.0053 |
| SeE_FRV | Seed - Extractable | Flavans Reactive to Vanillin | 0.0025 |
| SeE_TP | Seed - Extractable | Total Phenols | 0.0025 |
| Sugars | Juice | Sugars | 0.0021 |
| N | Juice | N ready utilizable | 0.0020 |
| SkE_PC | Skin - Extractable | Proanthocyanidines | -0.0022 |
| SkT_TP | Skin - Total | Total Phenol | -0.0025 |
| SkE_F | Skin - Extractable | Flavonoids | -0.0048 |
NIR Spectroscopy Prediction of the Polyphenols in the Skin and Seeds
The average spectra of the skin and seeds are reported in Figure 4 and Figure 5. The reflectance of the green nets appear the lower in the skin and the higher in the seeds.
As far as the NIRS performances are concerned (Table 9), the result was elevated both for the skin, with an average RSQ of 0.74±0.11 and average RPD values of 2.1±0.46 as well as for the seeds, whose average values reach an RSQ of 0.81±0.07 and an RPD of 2.4±0.46. The highest RPD (3.0) was for the skin total flavonids (SkT_F). In the figure 6, figure 7, figure 8 are reported the scatterplots for: the skin extractable anthocyans percentage; the skin extractable total polyphenols and the seed extractable flavans reactive to vanillin to proanthocyanidines ratio.
Table 9. Performances of the NIR-SCiOTM spectra of the skin for the prediction of the phenolic ripening parameters, in the skin and seeds| Constituent 1 | No. | Mean | SD | CV% | SEC | RSQ | SECV | R 2 CV | RPD | No. of Terms |
| Skin | ||||||||||
| SkT_TP | 39 | 1751 | 63 | 4 | 25 | 0.84 | 27 | 0.82 | 2.4 | 7 |
| SkT_A | 39 | 622 | 16 | 3 | 8 | 0.78 | 9 | 0.67 | 1.8 | 2 |
| SkT_F | 38 | 1967 | 54 | 3 | 15 | 0.93 | 18 | 0.89 | 3.0 | 7 |
| SkE_TP | 39 | 1078 | 41 | 4 | 17 | 0.83 | 17 | 0.82 | 2.4 | 3 |
| SkE_A | 39 | 330 | 22 | 7 | 13 | 0.68 | 13 | 0.66 | 1.7 | 7 |
| SkE_F | 41 | 1277 | 36 | 3 | 12 | 0.89 | 18 | 0.75 | 2.0 | 7 |
| SkE_PC | 41 | 1908 | 71 | 4 | 43 | 0.63 | 48 | 0.54 | 1.5 | 6 |
| SkE_FRV | 40 | 1035 | 59 | 6 | 18 | 0.91 | 23 | 0.84 | 2.5 | 7 |
| SkE_A% | 36 | 54.04 | 2.92 | 5 | 1.1 | 0.85 | 1.33 | 0.79 | 2.2 | 6 |
| SkE_FRV/PC ratio | 42 | 0.54 | 0.03 | 7 | 0.03 | 0.71 | 0.02 | 0.66 | 1.7 | 7 |
| Seeds | ||||||||||
| SeT_TP | 39 | 1795 | 82 | 5 | 21 | 0.93 | 29 | 0.88 | 2.9 | 7 |
| SeE_TP | 40 | 423 | 56 | 13 | 23 | 0.84 | 26 | 0.79 | 2.2 | 7 |
| SeE_PC | 38 | 485 | 72 | 15 | 31 | 0.81 | 33 | 0.79 | 2.2 | 3 |
| SeE_FRV | 39 | 371 | 38 | 10 | 18 | 0.78 | 20 | 0.73 | 1.9 | 7 |
| SeE_ FRV/PC ratio | 41 | 0.789 | 0.07 | 9 | 0.02 | 0.90 | 0.024 | 0.88 | 2.9 | 5 |
Figure 3. Plot of the Predicted \ Measured elevation within the vineyard as obtained from the Partial Least Squares model based on 29 variables (N= 15). Code values: 1= Low altitude block, 2= Medium altitude block, 3=High altitude block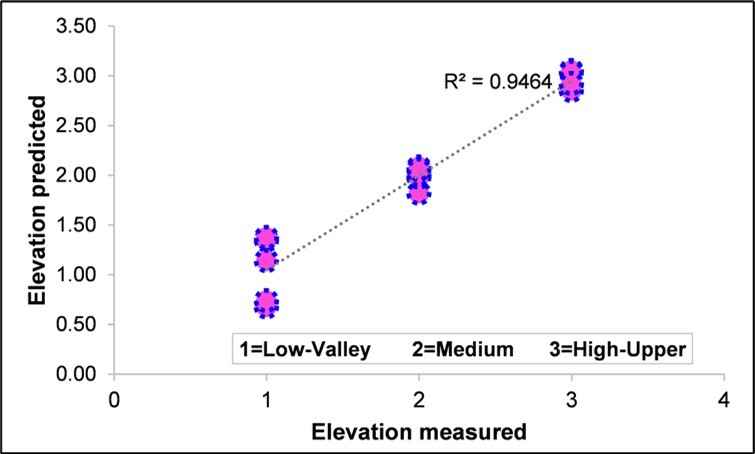
Download figure
Figure 4. Average NIR reflectance spectra of the skins for the five treatments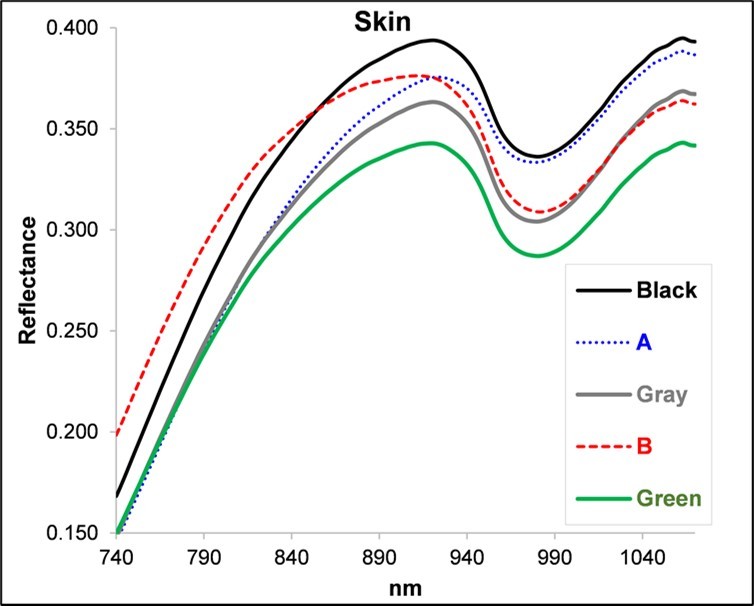
Download figure
Figure 5. Average NIR reflectance spectra of the seeds for the five treatments
Download figure
Figure 6. Scatterplot of the predicted vs. measured skin extractable anthocyans contents 
Download figure
Figure 7. Scatterplot of the predicted vs. measured skin extractable total polyphenols
Download figure
Figure 8. Scatterplot of the predicted vs. measured seed extractable flavans reactive to vanillin FRV / PC ratio
Download figure
Clustering the NIR Spectra of the Skin and of the Seeds in the Five Treatments
Based on the NIR spectra the dissimilarities between the five these appear quite different in the two studied matrices. In the skin (Figure 9) one cluster associate the treatments B and C-black opposed to A, D-green and E-gray.
Figure 9. Principal coordinate analysis and dendrogram of the five treatments based on the average NIR spectra of the berry skin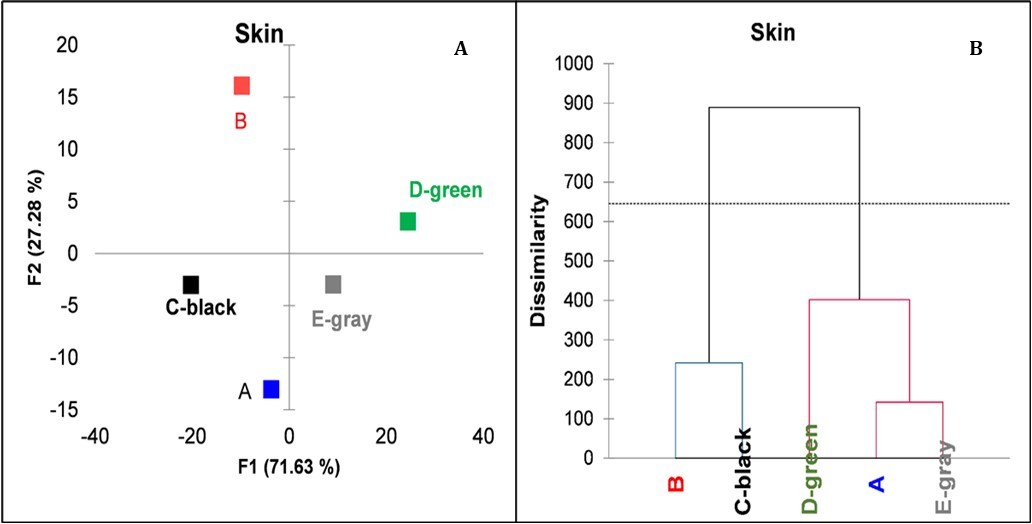
Download figure
In the seeds (Figure 10) the treatment A looks quite original, while B is paired with C-black and are opposed to D-green clustered with E-gray
Figure 10. Principal coordinate analysis and dendrogram of the five treatments based on the average NIR spectra of the berry seeds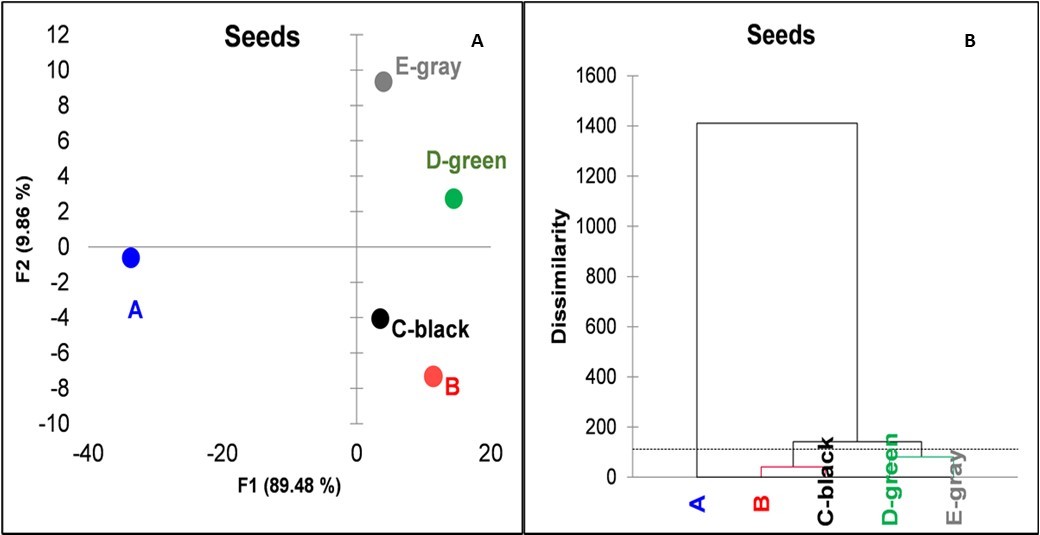
Download figure
Discussion
Vineyard Management
A slight difference was observed, regarding sun burn, between the net treatments (C, D and E) and the reference treatments (A and B), although the damage was considered acceptable (< 5 %). No differences were observed between the net treated treatments (C, D and E).
This result confirms those of other studies in literature, performed with the same variety of grapes (Nebbiolo) or other varieties, when berries are exposed to the sun very early in the season, just after flowering (pea size), which stimulates the berry skin to produce several substances (mainly Carotenoids) that are useful to protect the berry itself from the sunlight, even against strong UV exposure 20, 21, 22, 23.
The berry weight is an important parameter for the modern viticulture, because the production of red wines is mainly related to the phenols in the skin and the aroma precursor extraction potential 24.
When the berry weight is reduced, there is a corresponding reduction in the berry volume. As a result, there is an increase in the skin/juice ratio (more skins per juice unit), which is positive from a quality perspective. The black net test (C) showed a reduction in the berry weight of about 13%. The reduction may be related to the reduced amount of light that the black net had on the new berries during the first phase of the growing period (from fruit setting to veraison) in which the final size of the berries is related to the photosynthetic performances of the berries. In fact, at this moment, the berry behaves like a leaf that is full of chlorophyll, and the increase in berry volume may decrease if a part of the total available sunlight is absorbed by C-black plastic. The other colored nets (green and gray) probably did not have a significant depressive effect on the photosynthetic activity of the berries. However, different colored nets, when applied early in the season, may affect the final number of seeds, with a significant rise (102%), while in our experiment the black nets contrasted flower fecundation by 45%. We can explain the reduction of the seed number and berry weight in the black net from a local warming up in flowering time according to Kliever 25 and to Leolini et al 26, nevertheless the cause of the seeds rises in the green and gray nets of the seed number, but not the berry weight, is an original result. The green colored net consistently increased the berry pH and keeps up the malic acid content. The malic acid content of berries is positively correlated with the pH of the juice and is generally preserved when the berries are not subjected to high temperatures during the ripening process. The green net (D) seems more able to prevent high temperatures in the berries, while the black net (C), consistently with the material type that absorb the higher solar energy amount, affecting the cluster microclimate and the experimental conditions (A), where all the solar UV rays are not filtered, promoted the berry temperature increase being in that case related to an increased malic acid catabolism, generally associated with a faster ripening process 27, 28.
Polyphenols
The anthocyanin profile of the skin extracts was uniform between the treatments. This is an important parameter to consider because the anthocyanin profile of Nebbiolo, which is directly responsible for the wine color 29, 30, does not ensure the same technological stability or intensity as other famous grape varieties, and already needs to be protected in the field. However, the colored nets seem have a neutral effect on the synthesis and extractability of anthocyanins from the skin.Anthocyanins are the main compounds responsible for the color of red wines, and their interactions with other phenolic compounds, called co-pigments, allow the color stabilization of aged wines to be improved through co-pigmentation or stabilization reactions 31, 32.
As far as the anthocyanin profile is concerned, it is important to try to synchronize the technological ripening (sugar accumulation and fixed acid reduction) with the phenolic ripening (high skin color extraction and low tannin release from the seeds) as much as possible under warm environmental conditions 33, 34. In such a context, coverage with nets can help to reach this goal.
A limited reduction only occurred in the polyphenols extractable from the seeds in treatment E (gray), while the colored net favored a rise in the extractable proanthocyanidines (PC).
The fact that the net color can affect the seed physiology even by increasing their mass but not the skin phenolic composition, is a remarkably interesting result, which was certainly not expected. An increased amount of extractable polyphenol compounds from the seeds means the seed ripening is less advanced, and thus the seeds can release more tannins. The result of the seed extractable FRV/PC ratio, which showed a higher tannin polymerization ratio in the D (0.68) and E (0.73) treatments, is also interesting. High values of the FRV/PC ratio, close to 1, mean the tannins are on average less polymerized, and thus more reactive with proteins and probably more astringent. In short, the D (green net) and E (gray net) treatments showed more extractable tannins from the seeds, but which were more polymerized, than the other treatments.
Despite the limited range of variation in the dataset, where the CV ranged from 3 to 17%, the vibrational spectroscopy results were in line with the expectations. In a framework of highly variable (average CV 58%) woody vinery materials, Baca-Bocanegra et al 35, using a portable Micro-NIRS (VIAVI), observed an average RPD of 3.9±0.8 for six polyphenol compounds.
Two aspects need to be considered to explain the dissimilarities of the treatments in the NIR spectra. First, the NIR spectrum of the skin only partially represents the polyphenols, which, moreover, have varied very little thanks to standardized management conditions. Second, in the spectrum of the skins are contained the vibrations of many other organic substances present in the plant cell-walls 36 which could explain the spectral diversity observed between the treatments B and C-black compared to the other three groups. In the seeds, the chemical differentiation on the polyphenols caused by the colored nets has assumed a greater dimension, significantly expressed also by the laboratory analyzes and the NIR spectra have been modified as evidenced by the high predictability of the compounds analyzed. This does not mean that other undetermined substances may have modified consequently the dendrograms representative of the spectral associations between the groups, charged to the treatment A, then in suborder to B and C-black, and then to the D-green and E-gray nets. Notice that B paired to C-lack and D-green paired to E-gray even in the skins looked very similar.
Conclusions
An experiment was performed in the summer of 2016 in a Nebbiolo vineyard site that grows grapes to produce Barolo wine in the “Mosconi” geographic region (Monforte d’ Alba), with the aim of verifying the effect of a partial coverage of the plant canopy and clusters with 3 different colored plastic nets on several viticulture parameters.
The reference treatments (no-net coverage) were treated by partially (A) or completely (B) cutting the leaves and young shoots around the clusters. The net treatments, which involved covering the vines with either black, green, or gray plastic nets, encoded as C, D and E, respectively, were treated, just after flowering (BBCH 71), as in the experimental treatment (A). The following results, which were not influenced by the production potential, were obtained:
Canopy Management
1. h/ha: the average timing necessary to cut all the lateral shoots (B) was on average 51 h/ha, where the timing necessary to cut the leaves around the bunches (A) was 74 h/ha, which means a delta of 44.4 % compared to the previous case (B). The timing necessary to cut the leaves and shoots below the nets (C, D and E) was 92 h/ha, which means an increase of 24.0 % hours compared to the same canopy treatment without the nets (A).
2. Determination of the main phenological stages, and evaluation of the sun burn and hail damage: no differences were observed between the treatments until the start of veraison. Only at 10 d post veraison was the ripening process in the black net treatment clearly in advance, and berry coloring was completed a few days before the other treatments. As far as sun burn is concerned, a slight difference was observed between the net treatments (C, D and E), although none of them showed signs of damage, and the non-treated treatments (A, B), which instead showed signs of a slight sun burn of < 5 %, albeit only in the B treatment. No sun burn was observed in the A treatments. Hail damage was observed on 5% of the berries in the A and B treatments. Few berries (<1%) were affected by hail in the C, D and E treatments.
3. Berry weight: the black net test (C) showed a significant difference (p<0,05) in the berry weight from the other treatments, with an average weight of 1.48 g/berry compared to the other treatments, which showed an average of 1.70 g/berry. This effect may be related to the light reduction effect that the black net had on the new berries during the first growing period phase.
4. Technological ripening parameters: the pH and malic acid content evidenced significant differences (P<0,05 ANOVA test) between the treatments. The green and gray net treatments (D, E) showed an increased pH of the juice, whereas the green net (D) treatment showed an increased Malic acid content. The higher malic acid content is related to a reduced malic acid catabolism, which is consistent with a lower average temperature around the cluster. On the other hand, the A treatment, in which the sun exposure was maximum, had the lowest malic content.
5. Phenolic ripening parameters: significant differences emerged (for the seed extractable proanthocyanidines (PC) and for the extractable FRV/PC ratio. The D and E treatments had more seed extractable PC and a lower seed extractable FRV/PC ratio (higher polymerization of the average tannin ratio). Regarding the color profile, the treatments were not able to significantly change the anthocyanin profile or extractability.
6. Multivariate PLS analysis of the in-vineyard elevation: the variability of a vineyard slope can affect the ripening of the grapes to a great extent, and this shows how it is possible to observe different ripening dynamics within the same vineyard according to the position of the vine, that is, a high, exposed and dry site or a wetter base part that is less exposed to solar radiation. The position of a plant in a vineyard has a more important effect on the entire ripening process than the net canopy coverage.
7. Smart NIR spectroscopy of trimmed skin and seeds can constitute a useful tool to optimize the harvesting timing. This technology is versatile and very economic if compared to other spectroscopic methods. By scanning the seeds and skins of the grapes previously sampled in the vineyard, thanks to the acquisition of the NIR spectra with the Smart SCiOTM device and by downloading the dataset in EXCEL formats this technology at present allows a good estimation of the main phenolic ripening parameters, improving the Nebbiolo wine makers and viticulturist decision process. An expansion of the analytical base to other grape varieties observed in different agronomic, environmental, and biotic conditions is desirable to set up smart applications aimed at the description and use of a “ripening maturity trend” like that described for lipids 37.
In short, it has emerged that hail nets, apart from their primary utilization purpose, can be used to modulate the ripening process (green nets slow down the ripening process) and the final berry weight (black nets induce a reduction in weight). Different colors can affect the cluster and canopy microclimate and sunlight transmission; this can be useful toprotect the cluster from sun burns in the case of high temperatures in the summer period. When a canopy is covered by nets (C, D and E) more time is necessary to manage the canopy (+24% of the h/ha) than a similar non-covered treatment (A). The phenolic profile of the treated vines mainly changes because of the composition of the seeds, which in turn is mainly related to the tannin content and the average polymerization rate (seed FRV/PC). The other phenolic parameters did not change to any great extent.
The color of the anti-hail nets could be part of the processes and techniques that should be reconsidered because of the climate change that is underway and of the new market needs, as pointed out by Palliotti et al.38.
References
- 1.Chorti E, Guidoni S, Ferrandino A, Novello V. (2010) . Effect of Different Cluster Sunlight Exposure Levels on Ripening and Anthocyanin Accumulation in Nebbiolo Grapes.AJEV61 23-29.
- 2.Dokoozlian N K, Kliewer W M. (1996) Influence of light on grape berry growth and composition varies during fruit development.J. , Amer. Soc. Hort. Sci.121 869-874.
- 3.Downey M O, Harvey J S, Robinson S P. (2004) The effect of bunch shading on berry development and flavonoid accumulation on Shiraz grapes.Australian. Journal of Grape and Wine Research10 55-73.
- 4.Morrison J C, Noble A C. (1990) The effects of leaf and cluster shading on the composition of Cabernet Sauvignon grapes and on fruit and wine sensory properties.AJEV41. 193-200.
- 5.Castellano S, Mugnozza G S, Russo G, Briassoulis D, Mistriotis A.Hemming S,et al.(2008). Plastic nets in agriculture: a general review of types and applications.ASABE24. 799-808.
- 6.Novello V, L De Palma. (2019) Climate change effects on table grape phenology and quality. In 8thOENOVITI International Symposium. What changes in varietal wines quality, typicality, chemical and sensorial characters in the frame of climate change? Consequences on vines management, wine market and tourism economy, possible solutions and innovations.Copymedia (Canéjan. , France) 65-68.
- 7.Gambetta J M, Holzapfel B P, Stoll M, Friedel M. (2021) . Sunburn in Grapes: A Review.Frontiers in Plant Science11 21-23.
- 8.Cozzolino D, Dambergs R G, Janik L, Cynkar W U, Gishen M. (2006) Analysis of grapes and wine by near infrared spectroscopy.JNIRS14. 279-89.
- 9.Ferrer-Gallego R, J M Hernández-Hierro, Rivas-Gonzalo J C, Escribano-Bailón M T. (2010) Feasibility study on the use of near infrared spectroscopy to determine flavanols in grape seeds.Talanta82. 1778-83.
- 10.Ferrer-Gallego R, J M Hernández-Hierro, Rivas-Gonzalo J C, Escribano-Bailón M T. (2011) Determination of phenolic compounds of grape skins during ripening by. NIR spectroscopy.LWT-Food Science and Technology44 847-53.
- 11.Larrain M, Guesalaga A R, Agosin E. (2008) A multipurpose portable instrument for determining ripeness in wine grapes using. NIR spectroscopy.IEEE Transactions on Instrumentation and Measurement5 294-302.
- 12.González-Caballero V, Sánchez M T, Fernández-Novales J, López M I, Pérez-Marín D. (2012) On-vine monitoring of grape ripening using near-infrared spectroscopy.Food Anal. Methods5 1377-1385.
- 13.Guidetti R, Beghi R, Bodria L. (2010) Evaluation of grape quality parameters by a simple. , VIS/NIR system.Transactions of the ASABE 53, 477-484.
- 14.R Di Stefano, Cravero M C, Gentilini N. (1989) Methods for the study of wine polyphenols.L’Enotecnico. 83-89.
- 15.Rigo A, Vianello F, Clementi G, Rossetto M, Scarpa M et al. (2000) Contribution of proanthocyanidins to the peroxy radical scavenging capacity of some Italian red wines. , J. Agric. Food Chem 48, 1996-2002.
- 16.R Di Stefano, Guidoni S. (1989) The analysis of total polyphenols in musts and wines.Vignevini. 47-52.
- 17.Broadhurst R B, Jones W T. (1978) Analysis of condensed tannins using acidified vanillin.J. , Sci. Food Agric 28, 788-794.
- 18.Addinsoft. (2021) XLSTAT statistical and data analysis solution. , New York, USA.https://www.xlstat.com
- 19.Goldring D, Sharon D. (2016) Low-cost spectrometry system for end-user food analysis.United States Patent 009377396. 2.
- 20.Joubert C, Young P R, Eyéghé-Bickong H A, Vivier M A. (2016) Field-grown grapevine berries use carotenoids and the associated xanthophyll cycles to acclimate to UV exposure differentially in high and low light (shade) conditions.Front. , Plant Sci 7, 786.
- 21.Asproudi A, Petrozziello M, Cavalletto S, Ferrandino A, Mania E et al. (2020) Bunch Microclimate Affects Carotenoids Evolution in cv. Nebbiolo (V. vinifera L.).Applied Sciences,10. 3846.
- 22.Hickey C C, Kwasniewski M T, Wolf T K. (2018) Leaf removal effects on cabernet franc and petit verdot: II. Grape carotenoids, phenolics, and wine sensory analysis.AIEV69. 231-246.
- 23.Gambetta J M, Romat V, Holzapfel B P, Schmidtke L. (2019) Assessment of sunburn damage in Chardonnay grapes in relation to leaf removal timing. InAustralian Wine Industry Technical Conference, Adelaide 26-29.
- 24.Holt H E, Francis I L, Field J, M J Herderich, Iland P G. (2008) Relationships between berry size, berry phenolic composition and wine quality scores for Cabernet Sauvignon (Vitis vinifera L.) from different pruning treatments and different vintages.Australian. Journal of Grape and Wine Research14 191-202.
- 25.Kliewer W M. (1977) Effect of high temperatures during the bloom-set period on fruit-set, ovule fertility, and berry growth of several grape cultivars. , AJEV 28, 215-22.
- 26.Leolini L, Moriondo M, Romboli Y, Gardiman M, Costafreda-Aumedes S et al. (2019) Modelling sugar and acid content in Sangiovese grapes under future climates: An Italian case study.Clim. Res.78 211-224.
- 27.Lakso A N, Kliewer W M. (1975) The influence of temperature on malic acid metabolism in grape berries: I. Enzyme responses.Plant. Physiology56 370-372.
- 28.Volschenk H, Vuuren H J Van, Viljoen-Bloom M. (2006) Malic acid in wine: Origin, function and metabolism during vinification.http://scholar.sun.ac.za/handle/10019.1/101555.
- 29.Locatelli M, Travaglia F, Coïsson J D, Bordiga M, Arlorio M. (2016) Phenolic composition of Nebbiolo grape (Vitis vinifera L.) from Piedmont: characterization during ripening of grapes selected in different geographic areas and comparison with Uva Rara and Vespolina cv. EuropeanFood Research and Technology242 1057-1068.
- 30.Petrozziello M, Torchio F, Piano F, Giacosa S, Ugliano M et al. (2018) Impact of increasing levels of oxygen consumption on the evolution of color, phenolic, and volatile compounds of Nebbiolo wines.Frontiers in chemistry6. 137.
- 31.Escribano-Bailón M T, Santos-Buelga C. (2012) Anthocyanin copigmentation - evaluation, mechanisms and implications for the colour of red wines.Current Organic Chemistry16. 715-723.
- 32.Ribéreau-Gayon P, Dubourdieu D, Doneche B, Lonvaud A, Glories Y et al.(2006).Handbook of enology, the microbiology of wine and vinificationsWest Sussex. , England: J 1.
- 34.Cagnasso E, Torchio F, Gerbi V, Segade S R, Giacosa S et al. (2011) Evolution of the phenolic content and extractability indices during ripening of Nebbiolo grapes from the Piedmont growing areas over six consecutive years.South. , African J. Enol. Vitic.32 229-241.
- 35.Baca-Bocanegra B, Nogales-Bueno J, García-Estévez I, Escribano-Bailón M T, Hernández-Hierro J M et al. (2019) Screening of wine extractable total phenolic and ellagitannin contents in revalorized cooperage by-products: Evaluation by micro-NIRS technology.Food and Bioprocess. Technology2 477-85.
- 36.Tassone S, Masoero G, Peiretti P G. (2014) Vibrational spectroscopy to predict in vitro digestibility and the maturity index of different forage crops during the growing cycle and after freeze- or oven-drying treatment.Animal Feed Sci. , Techn 194, 12-25.
Cited by (3)
This article has been cited by 3 scholarly works according to:
Citing Articles:
Plant Physiology and Biochemistry (2026) Crossref
Frontiers in Plant Science (2023) Crossref Semantic Scholar OpenAlex