
Risk Factors for Stunted Growth among Children Aged 6–59 Months in Rural Uganda
Abstract
Despite the agreed global and national stunting reduction targets, Uganda has made very little progress. Understanding context-specific risk factors for stunted growth is therefore pertinent to designing programs to address the problem.
A cross-sectional study was conducted in 32 randomly selected villages in Buhweju district, Southwest Uganda. Data entry, cleaning and analysis were carried out using Statistical Package for Social Sciences (SPSS) version 21. A regression analysis was conducted to examine the associations between potential risk factors and stunted growth.
The survey covered 256 households and anthropometric measurements were taken for 221 children aged 6–59 months. The majority of the households (66%) in the district were food insecure and had a low socioeconomic status (84%). The prevalence of stunting in Buhweju district was 51%, which is significantly higher than the regional and national averages. Only 28% of the children were exclusively breastfed in the first 6 months of life, and only 10% of them received the minimum acceptable diet (MAD).
The findings of this study demonstrate that reductions in stunted growth at national or regional levels has not necessarily translated into similar trends in rural areas of Uganda. The notable contributors to stunting in these areas include morbidity, sub-optimal infant and young child feeding (IYCF) practices, low consumption of animal-source foods, food insecurity, lack of access to high-quality drinking water, sanitation and hygiene (WASH) facilities and poverty. Increased investment in both nutrition specific and sensitive interventions is therefore crucial to address these risk factors.
Author Contributions
Academic Editor: Chung-Yi Chen, Fooyin University
Checked for plagiarism: Yes
Review by: Single-blind
Copyright © 2017 John Bukusuba, et al
 This is an open-access article distributed under the terms of the Creative Commons Attribution License, which permits unrestricted use, distribution, and reproduction in any medium, provided the original author and source are credited.
Competing interests
The authors have declared that no competing interests exist.
Citation:
Introduction
Background
Stunting has recently gained international attention because it has severe short- and long-term health consequences and affects 178 million children in low- and middle-income countries1, 2. Globally, the prevalence of stunting is highest in Eastern Africa, where 50% of children under 5 years old are stunted1, and Uganda has one of the highest burdens of stunted growth2, 3. Therefore, in 2012, the World Health Organization adopted a resolution on maternal, infant and young child nutrition that included a global target of a 40% reduction in the number of stunted children under 5 years old by 20252.
Despite the agreed global and national stunting reduction targets, Uganda has made very little progress, and it is currently not on course to meet the Second National Development Plan (NDP II) and World Health Assembly (WHA) targets, as shown in Figure 1 and 22, 4, 5, 6, 7, 8. The risk factors for stunted growth in rural Uganda are still poorly understood, particularly the risk factors in the southwest region where, despite 95% of the households reportedly being food secure, two out of every five (42%) children are stunted8, 9, 10.
Figure 1.National Ugandan stunting trends
Sources: UBOS (1989, 1996, 2001, 2007 and 2012)
Stunting is a well-established risk marker for poor child development and an enormous drain on economic productivity and growth. Adults who were stunted as children earn 20% less compared with non-stunted individuals11, stunted children are four times more likely to die before their fifth birthday1 and the World Bank estimates that stunting can reduce a country’s gross domestic product (GDP) by up to 3%12. However, the economic losses in Uganda are likely even to be much higher. It is estimated that 5.6% of Uganda’s GDP ($899 million) is lost every year as a result of undernutrition13, 14. Understanding the context-specific risk factors for stunted growth is therefore pertinent to designing programs to address the problem. This study adapted the conceptual framework developed by Stewart et al.15 to assess the potential predictors of stunted growth in the study district.
Materials and Methods
Study Site and Design
A cross-sectional study was conducted in Buhweju district in Southwest Uganda. Structured questionnaires were developed and pre-tested prior to starting data collection. The fieldworkers underwent a 2-day training course, which included a 1-day class and a standardization test on the second day. Sixteen focus group discussions and 16 interviews with key informants were also conducted (in addition to the interviews based on the structured questionnaires). These discussions and interviews involved mothers and fathers of children under the age of 5 years, village leaders and other key informants.
Sample Size Calculation
Emergency Nutrition Assessment (ENA) Software was used to calculate the sample size for the study based on the following formula:

N = sample Size
P = Estimated prevalence of stunting
d= Desired precision
DEFF = Design effect
The survey was conducted in 32 villages (i.e., 32 clusters) and, in each village, eight randomly selected households were interviewed using the structured questionnaire. Systematic random sampling was used to select the households within each cluster.
Nutrition Status
In the selected households, all eligible children (i.e., those who were 6–59 months) were measured. The height of the children was 65–110 cm. Height was measured (to the nearest 1 mm) using a standard height board, weight (to the nearest 100 g) using a Seca scale and mid-upper arm circumference (MUAC) of the left arm using a MUAC tape. In cases in which there was no official documentation on a child’s birth date, age was estimated using an event calendar.
Food Consumption Score (FCS)
Food Consumption Scores (FCSs) were calculated based on the frequency of consumption of foods within eight food groups (cereals & tubers, pulses, vegetables, fruit, meat & fish, milk, sugar and oil) over a 7-day recall period. Weights were assigned to each food group based on the nutritional density of the foods16. Households with a FCS of <28 were classified as having poor food consumption, those with a FCS of 28–42 were classified as having borderline consumption and those with a FCS of >42 were considered to have acceptable consumption16, 17.
Socioeconomic Status (SES)
The approach for determining household socioeconomic status (SES) was based on a household wealth index adapted from the indices devised by Garenne and Hohmann-Garenne18 and Saaka and Osman19. The household wealth index scores were calculated based on information collected on the education level and occupation of the head of each household, ownership of household assets (land, a bicycle, a motorcycle, a car, a television, a radio, a sewing machine, a telephone, a refrigerator, a mattress, a bed, poultry and livestock) and housing quality (floor, walls and roof material and type of toilet facility). The scores varied from 0 to 20, and households that had a score of <8 were classified as having a low SES and those that had a score of ≥8 were classified as having a high SES.
Statistical Analysis
The recordings from focus group discussions and interviews with key informant were transcribed, entered into Microsoft Excel, assessed for major themes and coded. Stunting was defined as <-2 height-for-age z-scores, severe stunting as <-3 height-for-age z-scores, and moderate stunting as ≥-3 and <-2 height-for-age z-scores. The data were analyzed after excluding z-scores from observed mean Standardized Monitoring and Assessment of Relief and Transition (SMART) flags (height-for-age z-scores -3 to 3). Data entry, cleaning and analysis were carried out using Statistical Package for Social Sciences (SPSS) version 21. Independent samples t-tests were used to test for differences in linear growth among children under 5 years old based on exposures to various potential risk factors. A logistic regression analysis was also conducted to examine the associations between potential risk factors and stunted growth. For all statistical tests, p ≤ 0.05 was considered significant.
Results
Socio-Demographic Characteristics
The survey covered 256 households and anthropometric measurements were taken for 221 children aged 6–59 months. Among the households surveyed, 11% were female-headed households and the average household size was 5 people. The ratio of boys to girls was 1 to 1. The majority of heads of households (86%) were Banyankore by tribe and had education levels of up to primary school (59%), and their main occupation was farming (73%). The SES of most households (84%) was low, and female-headed households were significantly (p < 0.05) more likely to be of low SES.
Nutrition Status
The prevalence of stunted growth found in this study (i.e., a 2016 survey) in Buhweju district was lower than that in 2004 (51% vs. 56%), but the difference was not significant. However, the prevalence of stunted growth in Buhweju district was significantly (p < 0.05) higher than both the southwest average (51% vs. 42%) and the national average (51% vs. 33%). The prevalence of stunted growth was also higher among boys compared with girls (54% vs. 48%), although the difference was not significant. Only 44% of the children were born in a health facility (Table 1), and these children were significantly (p < 0.05) less likely to be stunted. Most mothers (61%) of stunted children said that they did not know that their children were stunted. Even among mothers of severely stunted children, most of them (58%) did not know that their children were stunted.
Table 1. Socio-demographic characteristics| Variable | Number | Percentage |
| Sex of head of household | ||
| Male | 286 | 87.5 |
| Female | 41 | 12.5 |
| Sex of child | ||
| Male | 118 | 53.4 |
| Female | 103 | 46.6 |
| Age of child | ||
| 6–23 months | 69 | 31.2 |
| 24–59 months | 152 | 68.8 |
| Birth place of child | ||
| Health facility | 98 | 43.8 |
| Other (home or with a traditional birth attendant) | 126 | 56.2 |
| Education level of head of household | ||
| None/illiterate | 69 | 21.2 |
| Primary school | 201 | 61.8 |
| Secondary school and above | 55 | 16.9 |
| Ethnicity of head of household | ||
| Banyankore | 276 | 84.7 |
| Bakiga | 48 | 14.7 |
| Other | 2 | 0.6 |
| Main source of household income | ||
| Self-employed – farming/livestock | 242 | 74 |
| Agricultural labor | 36 | 11 |
| Skilled labor | 6 | 1.8 |
| Non-skilled non-agricultural labor | 9 | 2.8 |
| Salaried work | 12 | 3.7 |
| Self-employed – non-agricultural | 22 | 6.7 |
| Socioeconomic status (SES) | ||
| Low | 260 | 79.5 |
| High | 67 | 20.5 |
The prevalence of wasting was 5% while the prevalence of being underweight was 21% (Table 2). The prevalence rates of wasting and underweight were higher than the southwest regional averages, (5.2% vs. 4.9%) and (21% vs. 15%) respectively, but the differences were not significant.
Table 2. Prevalence of malnutrition based on WHO (2006) standards| Indicator | Percentage (95% CI) | ||
| Stunting (n = 206) | Wasting (n = 213) | Underweight (n = 208) | |
| Global | 51.0 (44.2–57.7) | 5.2 (2.9– 9.0) | 20.7 (15.7–26.7) |
| Moderate | 26.2 (20.7–32.6) | 2.3 (1.0–5.4) | 14.9 (10.7–20.4) |
| Severe | 24.8 (19.4–31.1) | 2.8 (1.3–6.0) | 5.8 (3.3–9.8) |
Stunting was significantly higher among young children under 2 years (p < 0.05) compared with older children above 2 years of age. Stunted growth was shown to increase in among children between 6 months (when complementary foods are introduced) and 12–17 months, and peak in the 18–23-month age group. Although it was shown to decrease among older age groups, the prevalence of stunting in Buhweju district is still above acceptable limits in all age groups (Figure 2). This is evidence of diets that are of low quantity and quality that cannot support the appropriate growth of young children. Households therefore need to have access to high-quality diets to ensure that children over 6 months are fed appropriate complementary food. This complementary food could be used to mitigate the issues caused by most low-quality local foods (i.e., foods that have particularly limited essential micronutrient content), which are currently frequently given to rapidly growing infants and young children.
Figure 2.Prevalence of stunting by age of child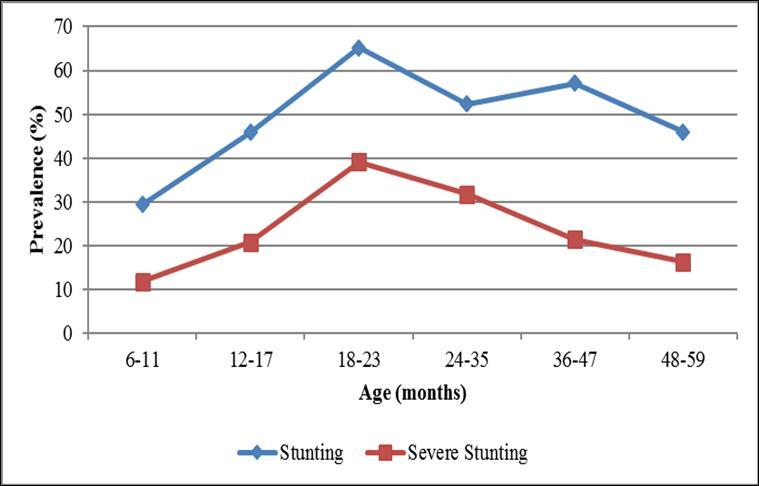
The prevalence of stunting was generally higher among boys after 2 years of age, showing that there may be a general difference in feeding practices for boys and girls in the surveyed population, which could be leading to differences in the growth patterns (Figure 3). Children from households with a low SES were also more likely to be stunted compared with those from households with a high SES.
Figure 3.Prevalence of stunting by age and sex of child
The number of underweight children followed a similar trend to that of children with stunted growth, beginning to increase between 6 months (when complementary foods are introduced) and 12–17 months, and peaking in the 18–23-month age group (Figure 4).
Figure 4.Prevalence of underweight by age of child
Infant and Young Child Feeding (IYCF) practices
Most mothers of children aged 6–23 months reported that they had breastfed their children (95%), initiated breast feeding within the first hour after birth (78%) and were still breastfeeding them at the time of the survey (70%). However, only 58% of the mothers understood the meaning of “exclusive breastfeeding” and only 28% of the children were exclusively breastfed during the first 6 months. Exclusive breastfeeding was significantly (p < 0.05) higher among mothers whose children were born in a health facility, possibly because health workers provided adequate advice to these mothers on optimal IYCF. The prevalence of stunting was higher among children who were not exclusively breastfed compared with those who were exclusively breastfed, although the difference was not significant.
Although 69% of the mothers understood the appropriate age for introduction of complementary foods, only 27% practiced appropriate introduction of complementary foods at 6 months. Knowledge of appropriate complementary feeding was significantly (p < 0.05) higher among mothers whose children were born in a health facility, possibly because health workers provided adequate advice on optimal IYCF practices. Mothers who understood the appropriate age for introduction of complementary foods were significantly (p < 0.05) more likely to start complementary feeding at 6 months, and their children were significantly (p < 0.05) less likely to be stunted. The prevalence of stunting was significantly (p < 0.05) higher among children who started complementary feeding at less than 6 months of age. Only 13% of the children aged 6–23 months received the recommended minimum dietary diversity (defined as proportion of children aged 6–23 months who receive foods from four or more food groups according to WHO20), 55% of the children received the recommended minimum number of meals per day (defined as two times per day for 6–8-month-olds and three times per day for 9–23-month-olds according to WHO20) and only 10% had the minimum acceptable diet (combination of both the minimum dietary diversity and minimum meal frequency). Consumption of a diversified diet was significantly (p < 0.05) associated with high household SES. Children who received the recommended minimum dietary diversity (MDD), recommended minimum number of meals per day or minimum acceptable diet (MAD) were less likely to be stunted, although the differences were not significant. Consumption of animal sources of protein generally boosts linear growth, as evidenced by the results of the independent samples t-test, which showed that children who reportedly consumed muscle meat and fish were significantly (p < 0.05) less likely to be stunted.
Food Consumption Scores (FCSs)
The majority of the households (66%) in the district had poor or borderline food consumption, which is a proxy indicator of food insecurity (i.e., poor household access to food). Only 34% of the households had acceptable food consumption (Table 3). A poor FCS was significantly (p < 0.05) associated with a low SES and, therefore, low-SES households were significantly (p < 0.05) more likely to be food insecure. Children from food-insecure households (based on poor or borderline FCSs) were significantly (p < 0.05) more likely to be stunted compared with those in food-secure households (based on acceptable FCSs).
Table 3. Food Consumption Score| Food consumption category | Number (N=327) | Percentage (95% CI) |
| Poor | 38 | 14.8 (10.5–19.5) |
| Borderline | 132 | 51.6 (45.3–57.4) |
| Acceptable | 86 | 33.6 (27.7–39.5) |
The mean number of food groups consumed per week was only three, and the proportion of households consuming four or more food groups was only 37% (95% CI: 30.9–43.4, N=256). Household dietary diversity significantly (p < 0.05) increased with an increase in SES. The consumption of animal protein was relatively low (Figure 5).
Figure 5.Mean number of days per week on which specific food groups were consumed
Water, Sanitation and Hygiene (WASH) practices
Improved WASH facilities are defined as access to an improved drinking-water source (which, by the nature of its construction and when properly used, adequately protects the source from outside contamination), an improved toilet facility (which hygienically separates human excreta from human contact) and a facility for washing one’s hands with soap. The type of drinking-water source used by each household is an indicator of whether the quality of drinking water is adequate. About 57% of the households drank water from improved sources, which were therefore assumed to be of adequate quality. However, the majority of households (65%) reported that the distance to the water source was >30 minutes. The average time taken to collect water from the main drinking-water source was approximately 42 minutes. Access to improved water sources is important because 23% of the respondents reported that they do not treat water to make it safe for drinking. Those who reported treating water to make it safe for drinking mainly boil it (87%). The majority of households (72%) also reported that they were not satisfied with their water supply.
Only 23% of the households reportedly used an improved toilet facility although the majority of households with children under 3 years of age safely disposed of the children’s excreta (96%). Most of the toilets (83%) observed did not have a facility for hand washing. Therefore, it is unsurprising that only 54% of respondents washed their hands after using the toilet (Figure 6). Only 2% of the households had access to improved WASH facilities (i.e., drinking-water sources, toilets and hand washing facilities). Children from households with access to safe water for drinking or other improved WASH facilities were less likely to be stunted, although the differences were not statistically significant.
Figure 6.Percentage of mothers who washed their hands at critical times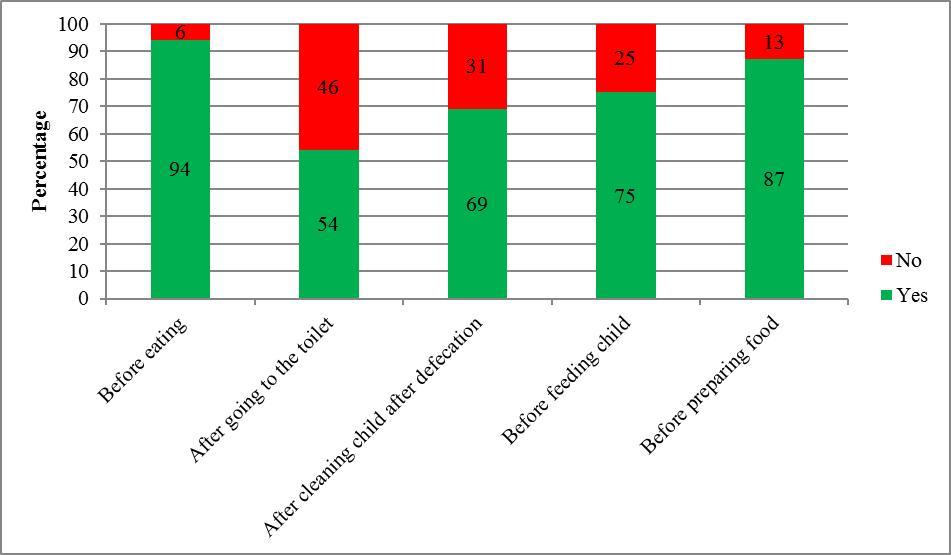
Morbidity
Parents were asked whether their children had been ill within 2 weeks prior to the survey, and it was reported that 21% of the children under 5 years old had diarrhea, 24% had suspected malaria and 40% had an acute respiratory infection (ARI). Only 42% were reportedly dewormed within 6 months prior to the survey. Children who had diarrhea or ARI and those who were not dewormed were more likely to be stunted.
Independent Predictors of Stunted Growth
In the multivariate analysis, stunted growth was significantly (p < 0.05) associated with reported illness (diarrhea and ARI) within 2 weeks prior to the survey, consumption of poorly diversified diet (child not having the recommended MDD or household having a low dietary diversity), lack of access to improved WASH facilities, early introduction of complementary foods (before 6 months) and a high dependency ratio (i.e., a high number of household members aged below 15 years and above 65 years).
Discussion
Linear growth is the best overall indicator of children’s wellbeing and provides an accurate marker of inequalities in human development21. Stunting is also currently the most prevalent form of child undernutrition and its inclusion among the six global nutrition priorities underscores the urgency to address it2. Although the Uganda Demographic and Health Surveys (UDHS), which are conducted every 5 years, report on trends in stunting, the focus is mainly at the national and regional levels. Therefore, in the absence of district-level prevalence data, tracking stunting trends and planning for interventions to address stunting mainly relies on regional data. This results in an underestimation of the problem and in the resources needed to address it. This study was conducted to examine the risk factors for stunted growth among children under 5 years old in a rural setting in Uganda, where stunting often goes unrecognized because short stature is often considered normal.
Stunted growth was most prevalent among poor households and children who were born outside health facilities (mostly because of lack of access to health services). Most of the participants in focus group discussions and key informants attributed the high prevalence of stunting in the district to poor access to health services, lack of proper information on optimal IYCF practices, lack of access to improved WASH facilities, lack of awareness of stunted growth and poverty. A study in Tanzania found that children born outside health facilities (i.e., at home without an experienced attendant or at home with a traditional birth attendant) and those from the poorest households were significantly more likely to be stunted22. These findings are similar to our findings in Buhweju district, where mothers whose children were born in a health facility were counseled by health workers on optimal IYCF and were more likely to exclusively breastfeed their children as well as to practice appropriate complementary feeding.
Nutrition counseling of mothers on optimal IYCF is crucial for the prevention of stunted growth. However, a significant number of mothers in the study area did not have knowledge of recommended IYCF practices and, therefore, the majority did not practice optimal breastfeeding nor appropriate complementary feeding. This is consistent with the findings of a previous study on feeding practices and nutritional outcomes among children in rural areas of central Uganda23. The present study showed that mothers who understood the appropriate age for introduction of complementary foods were more likely to start complementary feeding at 6 months and their children were less likely to be stunted. Imdad et al.24 conducted a review of the various complementary feeding strategies and they showed that educating mothers about complementary feeding had a significant positive impact on linear growth. Mothers need to understand that complementary feeding should be timely (meaning that all infants should start receiving foods in addition to breastmilk from 6 months onwards), adequate (meaning that the nutritional value of the complementary foods should fulfill the needs of the rapidly growing child) and appropriate (meaning that foods should be diverse, of appropriate texture and given in sufficient quantity)24. Consumption of animal-source foods is a well-recognized contributor to linear growth25, as this study also demonstrated.
Lack of access to improved WASH facilities is a known contributor to stunted growth, as this study also found. For example, studies of determinants of stunting among children under 5 years old in Tanzania found that unsafe drinking-water sources were one of the major predictors of stunted growth22, 26. Providing people with access to improved WASH facilities (i.e., safe drinking water, adequate sanitation and facilities to wash their hands with soap) would reduce incidences of diarrhea among children under five and, therefore, they would reduce mortality. Diarrhea is the second most common cause of child death worldwide, and it contributes to child morbidity and mortality by directly affecting children’s nutritional status27. Hand washing with soap at critical times (including before eating or preparing food and after using the toilet) can reduce diarrhea rates by more than 40%28. This makes it one of the most cost-effective interventions to prevent diarrhea-related disease and deaths. However, this study found that the practice of hand washing after using the toilet was very low.
Conclusion
The findings of this study demonstrate that reductions in stunted growth at the national and regional levels have not necessarily translated into similar trends in rural areas of Uganda. The notable contributors to the persistently high levels of stunting in these areas include morbidity, sub-optimal IYCF practices, low consumption of animal-source foods, food insecurity, lack of access to improved WASH facilities and poverty. Increased investment in both nutrition specific and sensitive interventions is therefore crucial to address these risk factors.
Acknowledgements
Supported by a grant from the Nestlé Foundation for the study of problems of nutrition in the world, Lausanne, Switzerland.
References
- 1.R E Black, L H Allen, Z A Bhutta, L E Caulfield, M de Onis. (2008) Maternal and child undernutrition: global and regional exposures and health consequences. , Lancet 371(9608), 243-260.
- 2.M de Onis, K G Dewey, Borghi E, A W Onyango, Blössner M. (2013) The World Health Organization's global target for reducing childhood stunting by 2025: rationale and proposed actions. , Matern Child Nutr 9, 6-26.
- 3.UNICEF. (2015) Situation analysis of children in Uganda. Ministry of Gender, Labour and Social Development and UNICEF Uganda .
- 4.National Development Plan II (2015) . Second National Development Plan (NDP II) 2015/16 – 2019/20: Strengthening Uganda’s Competitiveness for Sustainable Wealth Creation, Employment and Inclusive Growth .
- 5.Statistics Department [Uganda] and Macro International Inc (1996) Uganda Demographic and Health Survey. , Calverton, MD:
- 6.Statistics Uganda Bureau of, Macro ORC. (2001) . Uganda Demographic and Health Survey 2000-2001. Calverton, MD: UBOS and ORC Macro .
- 7.Uganda Bureau. of Statistics (UBOS) and Macro International Inc. (2007) Uganda Demographic and Health Survey 2006. Calverton, MD: UBOS and Macro International Inc .
- 8.Uganda Bureau. of Statistics (UBOS) and ICF International Inc. (2012) Uganda Demographic and Health Survey 2011. UBOS and , Calverton, MD: .
- 10.J K Kikafunda, Agaba E, Bambona A. (2014) Malnutrition amidst plenty: An assessment of factors responsible for persistent high levels of childhood stunting in food secure Western Uganda. , Afr. J. Food Agric. Nutr. Dev 14(5), 9288-9313.
- 11.Grantham-McGregor S, Y B Cheung, Cueto S, Glewwe P, Richter L. (2007) Developmental potential in the first 5 years for children in developing countries. , Lancet 369, 60-70.
- 12.Bank World. (2006) Repositioning Nutrition as Central to Development: A Strategy for Large-scale Action. The International Bank for Reconstruction and Development/The World Bank:. http://siteresources. worldbank.org/NUTRITION/Resources/281846-1131636806329/NutritionStrategy.pdf (Accessed , Washington, DC
- 13.COHA. (2013) The Cost of Hunger in Uganda:. Implications on National Development and Prosperity. http://npa.ug/wp-content/themes/npatheme/documents/Publications/ CostofHungerre-portsummaryversion_FinalEdition.pdf. (Accessed .
- 14.Haddad L. (2013) Ending Undernutrition: Our Legacy to the Post. Generation. Institute of Development Studies in partnership with the Children’s Investment Fund Foundation .
- 15.C P Stewart, Iannotti L, K G Dewey, K F Michaelsen, A W Onyango. (2013) Contextualising complementary feeding in a broader framework for stunting prevention. , Matern Child Nutr 9, 27-45.
- 16.Lovon M, Mathiassen A. (2014) Are the World Food Programme’s food consumption groups a good proxy for energy deficiency? Food Sec. 6, 461-470.
- 17.WFP. (2008) Food Consumption Analysis: Calculation and Use of the Food Consumption Score in Food Security Analysis. World Food Programme, Vulnerability Analysis and Mapping Branch. , http://documents.wfp.org/stellent/groups/public/documents/manual_guide_proced/wfp197216.pdf?_ga=1.142541618.1626788436.1477310578. (Accessed
- 18.Garenne M, Hohmann-Garenne S. (2003) Social Determinants, Health Equity and Human Development. , J Health Popul Nutr 21(3), 235-242.
- 19.Saaka M, S M Osman. (2013) Impact of the national food supplementary program for children on household food security and maternal weight status in Iran Int J Popul Res. http://dx.doi.org/10.1155/2013/304169
- 20.Health World.Organization (2010) Indicators for Assessing Infant and Young Child Feeding Practices:. , Part 2.
- 21.M de Onis, Branca F. (2016) Childhood stunting: a global perspective. , Matern Child Nutr 12, 12-26.
- 22.Chirande L, Charwe D, Mbwana H, Victor R, Kimboka S. (2015) Determinants of stunting and severe stunting among under-fives in Tanzania: evidence from the 2010 cross-sectional household survey BMC Pediatr. 10-1186.
- 23.Nankumbi J, J K Muliira, M K Kabahenda. (2012) Feeding Practices and Nutrition Outcomes in Children Examining the Practices of Caregivers Living in a Rural Setting Infant Child Adolesc Nutr. 4(6), 373-380.
- 24.Imdad A, M Y Yakoob, Z A Bhutta. (2011) Impact of maternal education about complementary feeding and provision of complementary foods on child growth in developing countries. , BMC Public Health 11, 1-14.
- 25.N F Krebs, Mazariegos M, Tshefu A, Bose C, Sami N. (2011) Meat consumption is associated with less stunting among toddlers in four diverse low-income settings. , Food Nutr Bull 32(3), 185-191.
- 26.Altare C, T D Delbiso, G M Mutwiri, Kopplow R, Guha-Sapir D. (2016) Factors Associated with Stunting among Pre-school Children in Southern Highlands of Tanzania. , J Trop Pediatr 62, 390-408.
Cited by (26)
This article has been cited by 26 scholarly works according to:
Citing Articles:
Health Information : Jurnal Penelitian (2025) Crossref
Environmental Health (2025) OpenAlex
X. Seposo, Aden Kay Celis-Seposo, Athicha Uttajug, Muhammad Abdul Basit Ahmad Tajudin, Kayo Ueda - Environmental Health (2025) Semantic Scholar
Environmental Health (2025) Crossref
African Journal of Food Agriculture Nutrition and Development (2023) OpenAlex
African Journal of Food, Agriculture, Nutrition and Development (2023) Crossref
Journal of Pediatric Nursing (2023) OpenAlex
Journal of Pediatric Nursing (2023) Crossref
H. Herman, A. Mansur, Y. Chang - Journal of pediatric nursing (2023) Semantic Scholar
Jurnal Obsesi Jurnal Pendidikan Anak Usia Dini (2023) OpenAlex
The Central European Journal of Paediatrics (2023) OpenAlex
Fitra Yeni, H. Herman, D. Deswita - The Central European Journal of Paediatrics (2023) Semantic Scholar
BMC Nutrition (2022) OpenAlex
BMC Nutrition (2022) Crossref
Journal of Pharmaceutical Negative Results (2022) OpenAlex
Food Security (2022) Crossref
Vincent Ssekajja, H. Wamani, F. Kitutu, A. Atukwase - BMC Nutrition (2021) Semantic Scholar
Jurnal Obsesi Jurnal Pendidikan Anak Usia Dini (2021) OpenAlex
Food Security (2021) OpenAlex
I. Petrikova - Food Security (2021) Semantic Scholar
Enfermería Clínica (2020) OpenAlex
Enfermería Clínica (2020) Crossref
Aspar Abdul Gani, Lucy Widasari, Anang S. Otoluwa, V. Hadju, Sukri Palutturi et al. - Enfermería clínica (2020) Semantic Scholar
Research Square (Research Square) (2020) OpenAlex
I. Petrikova - (2020) Semantic Scholar
BMC Pediatrics (2019) OpenAlex
Yeshalem Mulugeta Demilew, Abiot Tefera Alem - BMC Pediatrics (2019) Semantic Scholar
BMC Nutrition (2018) OpenAlex
BMC Nutrition (2018) Crossref
J. Bukusuba, A. Kaaya, A. Atukwase - BMC Nutrition (2018) Semantic Scholar
J. Bukusuba, A. Kaaya, A. Atukwase - Food and Nutrition Bulletin (2017) Semantic Scholar
International Journal Of Nutrition (2017) OpenAlex