
Individual Dietary Diversity Score for Diabetic and Hypertensive Patients in Cote d’Ivoire
Abstract
Unlike developed countries, monitoring of the alimentation quality is important in developing countries. In recent years, several methods of assessing food consumption using simple tools the 24-hour diet recall have been proposed. This individual dietary diversity score (IDDS) is a simplified method for assessing the quality of diets, defined as the number of food groups represented in the diet over a period of time. We conducted an individual qualitative food consumption survey based on the 24 hours recall method. It was an Interviewer-administered questionnaire was used to collect information.The classification terciles of Dietary Diversity score was obtained from the 14 food groups recommended by FAO. 200diabetic and 200 hypertensive patients regularly followed in the same hospital (University hospital of Treichville) were included in this study without any distinction about treatment. The average of individual dietary diversity score was to 5.6 ± 1.58 for diabetic against 6 ± 1.94 food groups consumed the day before by hypertensive. Hypertensive patients in our study seemed o better diversity their diet with 8% of them who had a high score against 0.5% for diabetic. The food groups most consumed by our population were cereals, white tubers, other vegetables, fish and oils and fats at the expense leafy vegetables, vitamin A fruits, other fruits and legumes, nuts and seeds. In terms of anthropometric factors, we found the influence of waist circumference on food diversification in diabetic and not from hypertensive. Considering the importance of dietary diversity to nutrition and health, these results show the need to mobilize efforts for ensuring that people have better access to and knowledge about adequate nutrition. Despite the fact that this study has to be performed and that comparisons with other countries are required to harmonize the methodology, our results show the interest of the use of a simple tool to assess the quality of the food within the population. Using of this tool is certainly a future solution for a rapid diagnostic of diets quality.
Article Information
- Received
- Accepted
- Published
Academic Editor: Jing Li, University of Illinois at Chicago
Checked for plagiarism: Yes
Review by: Single-blind
Copyright © 2016 Déré KAL, et al
 This is an open-access article distributed under the terms of the Creative Commons Attribution License, which permits unrestricted use, distribution, and reproduction in any medium, provided the original author and source are credited.
Corresponding author: Dr DERE Kwadjo Anicet Luc, Mail: —
Competing Interests
The authors have declared that no competing interests exist.
Funding
No specific funding statement was provided by the authors.
Data Availability
No data-availability statement was provided by the authors.
Acknowledgements
Author affiliations: Department of internal medicine; cardiology institute (Abidjan).
Citation:
Introduction
In contrast to the developed countries where lifestyle diseases like obesity and chronic diseases have taken precedence, the developing world is still dealing with infectious diseases which are compounded by the presence of a nutritious transition 1, 2 . Indeed, the persistence of nutritional deficiencies and infectious diseases on one side and the emergence of other chronic metabolic disorders constitute a double burden detrimental to developing countries 3. This coexistence is associated at low level of economic development, urbanization, poor quality food and poor living conditions 4, 5.
Like in developed countries, the monitoring of food quality is important because malnutrition have a strong influence on mortality and morbidity. In addition to various deficiencies, over nutrition may lead chronic diseases such as diabetes mellitus, gout and cardiovascular disease including high blood pressure.
Thus, chronic diseases related to nutrition in general and both hypertension and diabetes mellitus in particular are a major public health problem in the developing countries. 79% of deaths worldwide attributed to chronic diseases occur in developing countries 6. Nutritional problems are common in poor people whose diets are primarily based on starchy foods and plants 7. These plant-based diets are low in micronutrients, rich in dietary fiber and phytates that inhibit intestinal absorption of micronutrients 8, 9. However, studies on dietary habits in general and in particular sick Ivoirians are new and need to be evaluated to draw objective conclusions which could help in planning and policy actions.
Over the past, several methods of assessing food consumption using simple tools like the 24-hour diet recall have been proposed. This individual dietary diversity score (IDDS) is a simplified method for assessing the quality of diets, defined as the number of food groups represented in the diet over a period of time 10. The biochemistry department of Medical Sciences (Alassane OUTTARA University), Cote d’Ivoire studied IDDS of different layers of the population. In this study, the aim was to compare food behavior of patients with diabetes mellitus and hypertensive.
Material and Methods.
Study Area:
This study was conducted in the Treichville University Hospital. The recruits of diabetics were done in the area of diabetology internal medicine and the recruitments of hypertensives were done in the cardiology institute of Abidjan.
Study Type:
It was an individual qualitative food consumption survey based on the 24 hours recall method.
Population:
During the period of December 2011- April 2012, 200 diabetics and 200 hypertensive adult patients regularly followed in this hospital were included in this present study without any distinction about gender and treatment.
Dietary Assessment:
The 24-hours diet recall method was used to obtain information on dietary intake of subjects. It was conducted by interviewers trained to interview patients. We asked patients to recall all food eaten and beverages taken in the previous twenty-four hours prior to the interview.
Dietary Diversity:
A scale of fourteen food groups was used in assessing the dietary diversity of patients. Using information collected from the 24-hour dietary recall, the dietary diversity scores for individuals were derived using the FAO guidelines for measuring household and individual dietary diversity 11. The dietary diversity was assessed based on the number of food groups consumed over the immediate past 24 hours. A point was awarded to each food group consumed over the reference period, and the sums of all points were calculated for the dietary diversity score for each individual. The classification terciles of Dietary Diversity score was obtained from the 14 food groups recommended by FAO. A scale was established for this distribution: low 1, 2, 3, 4, medium, average 5, 6, 7, 8, 9 and high 10, 11, 12, 13, 14, 9.
Anthropometric Measurements:
Height was measured in meters using a measuring tape and the weight was measured in kilograms using a balance scale. Body Mass Index (BMI) was calculated Lorentz’s formula (BMI = Weight/Height2 kg/m2). The waist circumference (WC) was measured for each patient using a tape measure.
Statistical Analysis:
All data was analyzed using statistical package for social sciences (SPSS version 10). The mean Dietary Diversity Scores from the patients were compared using One-way ANOVA. The independent-sample t-test was used to compare the mean DDS of patients. Pearson chi square was used to test for association between the DDS and the socio-demographics and anthropometrics factors. A descriptive analysis was performed and a study of the relationship between factors. Statistical tests were performed with a significant level of α = 5%.
Results:
This study included 200 diabetics and 200 hypertensives patients. In our two series we noted significantly as many men as women. More than 85% of the patients were over 40 years. Among diabetics, 30% had never attended school against 16% among hypertensive. A large proportion of patients were noted to be overweight regardless of the anthropometric parameters used Table I. Our results showed that DDS increased with abdominal obesity’s augmentation, this relationship was significant for diabetic patients. There were otherwise underweight patients with high DDS then overweight patients with low DDS Table IV. The average of individual dietary diversity score for the food groups consumed the day before was 5.6 ± 1.58 for diabetics against 6 ± 1 for hypertensives. Hypertensive patients in our study seemed to have a better diversity in their diet with 8% of them who had a high score against diabetics. In the both groups, 20 % of patients had low DDS Table II. The food groups most consumed by our population were cereals, white tubers, other vegetables, fish and oils and fats at the expense leafy vegetables, vitamin A fruits, other fruits and legumes, nuts and seeds picture 1.
Table I. Comparative table of socio-demographic and anthropometric parameters of the two studies populations.| caracteristics | Diabetic people | Hypertensive people |
| (n=200) | (n=200) | |
| Sex | ||
| M | 0.35 | 0.63 |
| F | 0.65 | 0.37 |
| Age | ||
| 20 – 39 | 0.14 | 0.05 |
| 40 – 59 | 0.5 | 0.44 |
| 60 and more | 0.36 | 0.51 |
| Educational level | ||
| No formal education | 0.3 | 0.16 |
| Secondary completed | 0.47 | 0.46 |
| University degree | 0.23 | 0.38 |
| Professional status | ||
| Unemployed | 0.31 | 0.16 |
| students | 0 | 0.01 |
| Civil servant | 0.485 | 0.4 |
| retired person | 0.205 | 0.43 |
| BMI | ||
| Underweight | 0.0847 | 0.01 |
| Normal | 0.3729 | 0.4 |
| Overweight | 0.2768 | 0.42 |
| Obesity | 0.2655 | 0.17 |
| WC | ||
| Normal | 0.567 | 0.35 |
| Obesity | 0.433 | 0.65 |
| Dietary diversity scores | Diabetic people (%) medium ± SD = 5.6 ±1.58 | Hypertensive people (%) medium ± SD = 6 ± 1.94 |
| 1 | 0.5 | 0.5 |
| 2 | 0.5 | 0.5 |
| 3 | 6 | 3 |
| 4 | 13.5 | 18 |
| 5 | 26 | 19 |
| 6 | 26 | 25 |
| 7 | 15.5 | 14 |
| 8 | 8 | 10 |
| 9 | 3.5 | 2 |
| 10 | 0 | 5 |
| 11 | 0 | 2 |
| 12 | 0 | 1 |
| 13 | 0.5 | 0 |
| Dietary Diversity Terciles | ||
| Low (1-4) | 20.5 | 22.5 |
| Medium (5-9) | 79 | 69.5 |
| High (10-14) | 0.5 | 8 |
Regarding the influence of some socio-demographic factors on individual dietary diversity score, it is clear from our findings that there was no statistically significant relationship between sex, age, educational level and oldness of disease with the diversity score. In terms of anthropometric factors, we found the influence of waist circumference on food diversification in diabetic and not from hypertensive. Concerning body mass index no statistical link was found among our patients Table III.
Table III. Influence of some socio-demographic indicators on the individual dietary diversity score| Diabetic people | Hypertensive people | |||||||
| L | M | H | p | L | M | H | p | |
| Sex | ||||||||
| M | 0.015 | 0.15 | 0.185 | 0.04 | 0.22 | 0.37 | ||
| F | 0.055 | 0.245 | 0.35 | 0.48 | 0.01 | 0.15 | 0.21 | 0.79 |
| Age | ||||||||
| 20 - 39 | 0.005 | 0.07 | 0.065 | 0 | 0.01 | 0.02 | ||
| 40 - 59 | 0.035 | 0.2 | 0.265 | 0.02 | 0.23 | 0.24 | ||
| 60 and more | 0.03 | 0.125 | 0.205 | 0.76 | 0.04 | 0.12 | 0.32 | 0.11 |
| Educational level | ||||||||
| No formal education | 0.02 | 0.11 | 0.17 | 0 | 0.07 | 0.09 | ||
| Secondary completed | 0.02 | 0.195 | 0.255 | 0.02 | 0.2 | 0.24 | ||
| University degree | 0.03 | 0.09 | 0.11 | 0.66 | 0.03 | 0.1 | 0.25 | 0.39 |
| Disease duration | ||||||||
| New cases | 0.045 | 0.15 | 0.2 | 0.01 | 0.17 | 0.19 | ||
| Old cases | 0.025 | 0.245 | 0.335 | 0.14 | 0.04 | 0.19 | 0.4 | 0.17 |
| Diabetic people Hypertensive people | |||||||||
| waist circumference | L | M | H | p | L | M | H | p | |
| normal | 01% | 26.5% | 29.5% | 0.008 | 2% | 14% | 19% | 0.658 | |
| High | 05.5% | 13.5% | 24% | 3% | 23% | 39% | |||
| Underweight | 00% | 04% | 04% | 00% | 00% | 01% | |||
| BMI | Normal | 0.50% | 16% | 21% | 0.19 | 02% | 16% | 22% | 0.98 |
| Overweight | 01% | 12% | 14% | 03% | 14% | 25% | |||
| obesity | 04% | 08% | 15% | 01% | 06% | 10% | |||
Picture 1. Frequency of food consumption 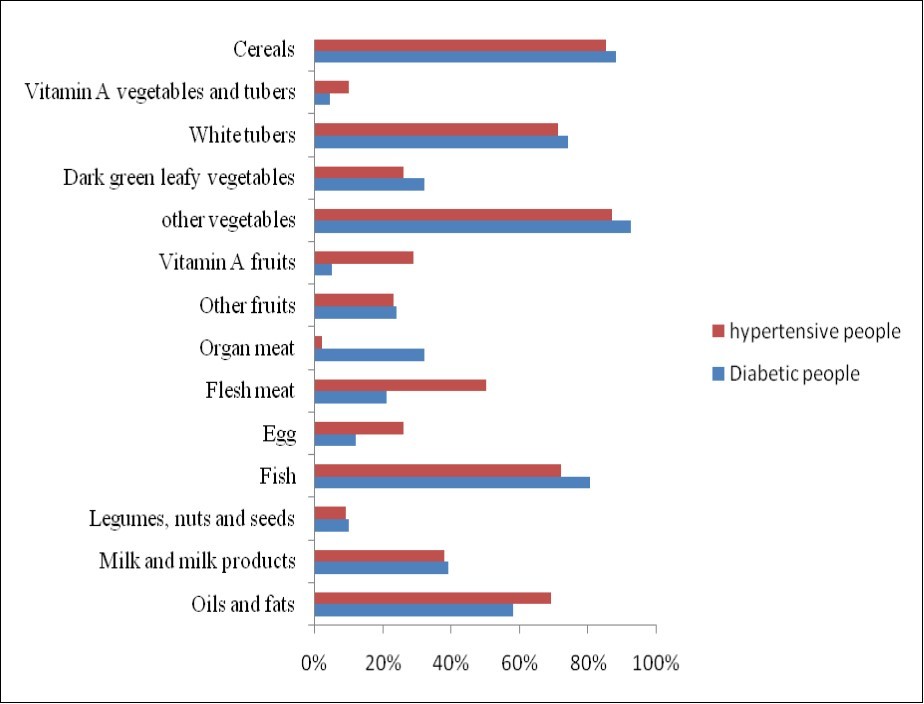
Download figure
Discussion:
Dietary diversity score consists of the total number of foods or food groups that contribute to the overall diet of an individual over a reference period 11, but dietary diversity in terms of food groups better predicts diet quality than that based on individual food items 12. Dietary diversity assessed in this study consisted of simple count of food groups that individuals consumed over a 24-hours reference period. One of the methods employed in defining cutoff points for assessing varying levels of dietary diversity in populations is to create terciles and sometimes quintiles 12. Terciles of
DDS based on 14 food groups were adopted in this study to determine the proportion of subjects scoring low, average and high DDS.
Diabetes and high blood pressure are two serious diseases increasing in our country and affects children, adults and senior citizens. In this urban study, we recruited between 69% and 83% workers and senior citizens. Among them most of 50% were overweight based upon BMI. In previous studies obesity is found to be related to dietary diversity 13, 14 in which authors observed a high prevalence of overweight or obesity in respectively 38% and 36%. Depending IDDS, 20% and 22% patients have consumed fewer than five diets groups the day before investigation, and that only 0.5 % diabetics had high DDS. The mean DDS obtained was 5.6 diets groups for diabetics and 6 diets groups for hypertensives. However in a study to assess whether dietary diversity is a good indicator of dietary adequacy, Steyn et al. 7 used 9 food groups to measure dietary diversity and obtained a mean DDS of 3.6. A mean DDS of 3.6 derived from 9 food groups is not comparable to the 5.8 from 14 food groups in this study.
Other vegetables (90%) (onion, tomato and pepper), cereals (86%), fish (76%) and oils and fats (63%) were the most consumed food groups by the two study groups. The explanation of the same is that these items consumed every day. In contrast to other fruits (23%), vegetables, nuts and seeds (10%) were the least consumed food groups. Fruits and vegetables rich in micronutrients and antioxidant should be benefits for these patients in regularly consumption because diabetes and high blood pressure have high oxidative potential. Feeding behavior of our patients was not related to the financial status but a habit acquired over several years. It is important to teach the healing properties of good alimentation and in particular fruits and vegetables consumption to our population. It will therefore be appropriate to prescribe a diet for our patients after each consultation. The practice of weighing food items before diet consumption should give a clear answer on the quantity and food micronutrient value consumed by each patient. However this methodology would be complex to realize because the investigation was done in a hospital. The daily consumption of fruits and vegetables in good portion (400 – 500 g per day), was recognized to decrease cardio-vascular disease risks 15. The beneficial effects of the consumption of fruit and vegetables were assessed by the DASH trial 16. This trial demonstrated that certain dietary patterns can favorably affect blood pressure in adults with average systolic blood pressures of less than 160 mm Hg and diastolic blood pressures of 80 to 95 mm Hg. Specifically, a diet rich in fruits, vegetables, and low-fat dairy products and with reduced saturated and total fat lowered systolic blood pressure by 5.5 mm Hg and diastolic blood pressure by 3.0 mm Hg more than a control diet. A diet rich in fruits and vegetables also reduced blood pressure upto a certain extent.
In the study of Arimond et al. 14 very few diets groups had been consumed the day before. They found 99.7% for cereals, 80.9% for fruits and vegetables rich in vitamin A and 95.2% for other vegetables. Peggy D 13 also in Burkina Faso observed in urban three majorities diets groups with 150 points for vegetables, 106 points for cereals and 103 points for fats. In Nigeria, Sanusi et al 9 assessed dietary diversity in six Nigerian states and reported a prevalence of 92.1% for cereals, 99% for fats and 59.7% for tubercles and food rich in vitamin A. Although dietary diversity of populations has been reported to range from 3 to 6 17, different numbers of food groups and scoring systems have been employed in different countries to assess dietary diversity, making it difficult to compare DDS between countries 15, 18.
The mean dietary diversity score obtained in this study is higher than the mean DDS found by Arimond 14 and Savy 17 respectively 6 for 21 maximum diets groups and 4.6 for 9 maximum diets groups. Their study was done in a rural area and could justify the difference observed with our study. Educational levels, household size and income usually interact to have a positive effect on food intake, because higher educational attainment in households is likely to be associated with higher income and increased income is linked to more expenditure on food. The DDS mean obtained by Sanusi 9 was 5.81 with a range of 4.98 to 6.61. The high value was obtained in urban area and during humid period. We researched the influence of socio-demographic and anthropometric parameters on food diversification of our patients. No significant statistical link association was found with socio-demographic parameters, however patients followed for many years and those aged over 60 years seemed better diversify their diet. In this study a positive statistical correlation had been found between the abdominal obesity and diversification for diabetics. In fact, DDS increased with abdominal obesity’s augmentation. This relationship hasn’t been found with another anthropometric factor in both study groups. There were otherwise underweight patients with high DDS then overweight patients with low DDS. Our results aren’t consistent with some reports 13, 15 which showed DDS increased with age while other studies had similar findings to our study 9, 19, 20.
In effect, Mc Crory et al. results suggested that dietary variety, and the types of foods that provide it, may be an important determinant of body mass in adult men and women. In addition, results imply that changes in dietary variety patterns are a likely contributor to the rising prevalence of obesity nationally and worldwide 21. In the study of George et al. 22, the magnitude of association between DDS and obesity was stronger and more likely to be statistically significant among those with a high waist circumference than among those with a high BMI value. One possible reason is that waist circumference may be a more direct measure of body composition because a higher waist circumference indicates a greater extent of abdominal obesity, which is more tightly linked to metabolic dysfunction than BMI alone. Abdominal obesity is known to be associated with abnormal production of inflammatory and metabolic cytokines that are responsive to dietary manipulation.
Raynor and Epstein reports showed that increasing risks of overweight and obesity depended DDS of food rich in energy 23. They observed that a good dietary diversity was associated to excess and imbalance of energy, whichever the different groups in score. The same results have been obtained by Mc Crory et. al. 22; they concluded that excess energy intake and body corpulence were more depending diets variety than fats intake alone. Predicting excess and imbalance of energy by qualitative study it isn’t easy and we must reflect on other ways to characterize excess consumption and food behavior.
Conclusion:
Most of the patients when assessed on individual DDS do not score up to average based on 14 food groups. It is thus considered that the average number of food groups consumed by the subjects over the reference period is poor. We noted that hypertensives and diabetics patients had the same diet behavior. Fruits and vegetables were the least consumed food groups unlike cereals, fishes, oils and fats. Considering the importance of dietary diversity to nutrition and health, these results shows that there is a need to mobilize efforts for ensuring that people have better access to knowledge about adequate nutrition. It is not surprising that eating a large variety of foods across and within major food groups has been recommended in most dietary guidelines because it is associated with a number of improved outcomes such as nutrient adequacy and better anthropometric indices. Is is important to conduct studies using a harmonized tool so that comparisons between different set-ups is possible. Our study shows that a simple tool could be used to assess the quality of the food within the population. Usage of this tool is certainly a future solution for a rapid diagnostic of diets quality.
References
- 1.Kennedy G, M R Pedro, Seghieri C, Nantel G, Brouwer I. (2007) Dietary diversity score is a useful indicator of micronutrient intakes in non-breastfeeding Filipino Children. , Journal of Nutrition 137, 1-6.
- 2.National Food (2013) Policy Capacity Strengthening Program (NFPCSP). , Compendium of Final Research Results 3, 188-259.
- 3.L E Tohreim, Hatloy A, Barikmo I, Diakité M, Solvoll K. (2001) Validation of the quantitative food-frequency questionnaire for use in Western Mali.Public HealthNutr;. 4(6), 1267-77.
- 4.Arimond M, M T Ruel. (2004) Dietary diversity is associated with child nutritional Status: evidence from 11 demographic and health Surveys. , Journal of Nutrition 134(1), 2579-85.
- 5.J L Garrett, Ruel M. (2003) Stunted child-overweight mother pairs: An emerging policy concern? International Food Policy Research Institute. Food Consumption and Nutrition Division, Discussion Paper no. 148.
- 7.N P Styen, J H Nel, Nantel G, Kennedy G, Labadarios D. (2006) Food Variety and Dietary Diversity Scores in children: are they good indicators of dietary adequacy:. , Public Health Nutrition 9(5), 644-50.
- 8.H W Lopez, Leenhardt F, Remesy C. (2004) New data on the bioavailability of bread magnesium. , Magnes Res 17(4), 335-40.
- 9.R A Sanusi. (2010) An assessment of dietary diversity in six Nigerian states.Afr. , J.Biomed.Res 13, 161-167.
- 10.Rose D, Meershoek S, Ismael C, Ewan Mc, M. (2002) Evaluation of a rapid field tool for assessing household diet quality in Mozambique.FoodNutrBull;. 23(2), 181-9.
- 11.FAO. (2007) Guidelines for Measuring Household and Individual dietary diversity. FAO Nutrition and consumer Protection Division, with Support from the EC/FAO Food Security Information for Action Programme and the Food and Nutrition Technical Assistance. (FANTA) Project
- 12.M T Ruel. (2003) Operationalizing Dietary Diversity: A Review of Measurement Issues and Research Priorities. , Journal of Nutrition 133, 3911-3926.
- 13.Peggy D. (2005) Etude de la consommation alimentaire à Ouagadougou, Burkina Faso : typologie des régimes stage de fin d’étude. Paris (FRA) ; Ouagadougou : INA-PG ; IRD, 2005,31 p : Nutrition Humaine. http : //www.documentation.ird.fr/hor/fdi :. 010036361.
- 14.Arimond M, Wiesmann D, Becquey E, Carriquiry A, Daniels M. (2010) Simple food group diversity indicators predict micronutrient adequacy of women’s diets in 5 diverse, resource-poor settings.Journal of Nutrition140: 11;. 2059-2069.
- 15.Savy M, Martin-Prevel Y, Daniel P, Traissac P, Dabire H. (2008) Are Dietary Diversity Scores related to the socio-economic and anthropometric status of women living in an urban area in Burkuna Faso?. , Public Health Nutrition 11(2), 132-41.
- 16.L J Appel, T J Moore, Obarzanek E, W M Vollner, L P Svetkey. (1997) A clinical trial of the effects of dietary patterns on blood pressure. , DASH Collaborative Research Group.New England Journal of Medicine; 336, 1117-1124.
- 17.Savy M, Martin-Prével Y, Sawadogo P, Kameli Y, Delpeuch F. (2005) Use of variety/diversity scores for diet quality measurement: relation with nutritional status of Women in a rural area in Burkina Faso. , Eur J Clin Nutri 59(5), 703-16.
- 18.Drescher L S, Thiele S, Mensink G B. (2007) A New Index to Measure Healthy Food Diversity Better Reflects a Healthy Diet than Traditional Measures. , Journal of Nutrition 137, 647-651.
- 19.Hoddinot J, Yohannes Y. (2002) Dietary diversity as a food Security indicator. Food consumption and Nutrition Division Discussion Paper No 136. International Food Policy Research Institute. , Washington, DC
- 20.A K Kant, Schatzkin A, T B Harris, R G Ziegler, Block.. G(1993) Dietary diversity and subsequent mortality in the First National Health and Nutrition Examination Survey Epidemiologic Follow-up Study.American Journal of Clinical Nutrition;57(3): 434-40.
- 21.Crory Mc, M A Fuss, J Mc Callum P, J E Yao, M et al. (1999) variety within food groups: association with energy intake and body fatness in men and women.American. , Journal ofClinical Nutrition; 69(3), 440-7.
- 22.S M George, Ballard-Barbash R, E J Manson, Reedy J, J M Shikany. (2014) . Comparing Indices of Diet Quality With Chronic Disease Mortality Risk in Postmenopausal Women in the Women’s Health Initiative Observational Study: Evidence to Inform National Dietary Guidance.American Journal of Epidemiology; 180(6), 616-625.
Cited by (9)
This article has been cited by 9 scholarly works according to:
Citing Articles:
A. K. Christian, Ruth T. Owu, I. Kretchy - BMC Women's Health (2025) Semantic Scholar Crossref OpenAlex
Eshetu Zemen, Y. S. Yimer, Negussie Deyessa Kabeta, Yonas Abebe - PeerJ (2025) Semantic Scholar Crossref OpenAlex
Revista Colombiana de Endocrinología Diabetes & Metabolismo (2024) OpenAlex
Roczniki Państwowego Zakładu Higieny (2022) OpenAlex
A. Theuri, A. Makokha, F. Kyallo, J. Gichure - Journal of Diabetes and Metabolic Disorders (2022) Semantic Scholar Crossref OpenAlex
Mahsa Rezazadegan, F. Mirjalili, Y. Jalilpiran, Monireh Aziz, Ahmad Jayedi et al. - Frontiers in Nutrition (2022) Semantic Scholar Crossref OpenAlex
M. Mahdavi-Roshan, Azin Vakilpour, S. M. Mousavi, A. Ashouri - BMC Nutrition (2021) Semantic Scholar Crossref OpenAlex
S. Sultana, N. Lina, M. T. Hasan, Md. Jannatul Ferdaus, B. Dash et al. - (2020) Semantic Scholar Crossref OpenAlex
Béhibolo Antoinette Yoboué, Arsène Landry Igor Nogbou, K. A. L. Déré, Zita Essan Bla N’Goran-Aw, Doudjo Soro et al. - European Scientific Journal (2018) Semantic Scholar OpenAlex