
Molecular Composition of and Potential Health Benefits Offered by Natural East African Virgin Sunflower Oil Products: A 400 MHz 1H NMR Analysis Study
Abstract
Objectives:
Sunflower oil (SFO) is regularly employed for cosmetic, emollient and food frying purposes, the latter representing its foremost use globally. Therefore, full investigations of the molecular composition and quality of SFO products are a major requirement. In this study high-field 1H NMR analysis was employed to explore the molecular composition and authenticities of East African virgin (EAV) SFO products, particularly their acylglycerol fatty acid contents, together with those of selected minor constituents. Results acquired were statistically compared to those obtained on commercially-available, EU-approved refined SFO products via NMR-linked multivariate chemometrics strategies.
Methodology:
High-field 1H NMR spectra of EAV and refined SFOs (n = 55 and 4 respectively) were acquired at an operating frequency of 400 MHz. Their triacylglycerol fatty acid, triacylglycerol hydrolysis product, and sterol and stanol contents were determined via intelligent frequency bucketing and electronic integration of selected resonances. Univariate analysis-of-variance, and multivariate ROC curve evaluations were conducted to determine the magnitude and statistical significance of analyte concentration differences between these two sample classifications. Further multivariate NMR-linked chemometrics analyses such as principal component, random forest and support vector machine classification analyses were also utilised for this purpose.
Key Results:
Multicomponent 1H NMR analysis demonstrated that EAV SFOs had significantly higher and lower contents of monounsaturated fatty acids (MUFAs) and polyunsaturated fatty acids (PUFAs), respectively, than those of refined SFOs. Furthermore, significantly higher concentrations of ‘health-friendly’, cholesterol-blocking sterols and stanols were also found in these virgin SFO products.
Major Conclusions:
1H NMR analysis provides much valuable molecular information regarding the composition and virginal status of SFOs.The high [MUFA]:[PUFA] content ratio of unrefined EAV SFO products renders them more suitable and safer for commercial or domestic deep-frying episodes than refined SFOs (MUFAs are much more resistant to thermally-induced peroxidation than PUFAs). These products also potentially offer valuable health benefits in view of their high natural sterol and stanol contents.
Article Information
- Received
- Accepted
- Published
Academic Editor: Dilsat Bozdogan Konuskan, Turkey
Checked for plagiarism: Yes
Review by: Single-blind
Copyright © 2019 Benita Percival, et al.
 This is an open-access article distributed under the terms of the Creative Commons Attribution License, which permits unrestricted use, distribution, and reproduction in any medium, provided the original author and source are credited.
Corresponding author: Martin Grootveld, Professor Martin, Grootveld, Leicester School of Pharmacy, De Montfort University, The Gateway, Leicester LE1 9BH, United Kingdom —
Competing Interests
All authors have declared that they have no competing interests.
Funding
No specific funding statement was provided by the authors.
Data Availability
No data-availability statement was provided by the authors.
Citation:
1. Introduction
Sunflower oil (SFO) is commonly and regularly employed for food frying and cooking, cosmetic and emollient purposes, and in 2014 the total global production of it was close to 16 million tonnes. Crude (virgin) vegetable oil products are predominantly comprised of fatty acid (FA)-containing triacylglycerols (95-98% by weight), along with a complex matrix of minor constituents, including natural colourants and phenolic antioxidants, and sterols and stanols. The plant species from which they are derived via seed pressing and related processes predominantly determines the fatty acid and minor agent compositions of these oils. Moreover, within the same vegetable/plant species, the abundance of such components in oils arising therefrom are critically dependent on a variety of factors, such as the nature and quality of seeds employed, agronomic strategies utilised, climate and temperature, and the oil extraction system, notably the temperature employed for this process 1, 2, 3.
SFO production has made significant contributions towards the socioeconomic development of East African nations since its establishment during the first half of the twentieth century, and currently agriculture accounts for >80% of total worker employment in Uganda, for example. Indeed, the sunflower sector in this nation has been of valuable interest to developmental communities following its original inception, although cultivation has generally been restricted to poorer Ugandan regions. These SFO markets were further developed to combat the deleterious economic effects arising from the diminishing cotton sector in the 1990’s, and since then sunflower and SFO production has considerably expanded, i.e. more than two-fold since 2000. Such global sunflower output has been facilitated by resilient demands from developing markets, reflected by population growth and modifications in edible oil consumption patterns linked to rising incomes.
Commercially, many East African SFO products classify as ‘virgin’ status ones, since they have not been exposed to harsh chemically-/physically-demanding ‘clean-up’ refinement processes. Any refining processes involved, which of course precludes the classification of culinary oils exposed to this process as ‘virgin’ status products, will also exert a major influence on oil compositions 4, 5, particularly their colouration status, reductions in their contents of α-tocopherol (vitamin E) and alternative phenolic antioxidants, along with those of other ‘health-friendly’ molecules such as sterols and stanols. Therefore, validated and detailed analytical determinations of the fatty acid, antioxidant, and sterol and stanol contents of unrefined ‘natural’ EAV SFOs is of critical importance, both to manufacturers and consumers, the latter now expressing a high level of interest and concern regarding the health and nutritional properties of their diets 6. Indeed, such assessments provide much valuable information concerning preservation of the nutritional qualities of such products, and also serve to reassure consumers of the absence of any adulteration, refinement or alteration of these oils, and hence their authenticity.
Of further concern are the toxicological properties and adverse health effects potentially exerted by dietary, predominantly polyunsaturated fatty acid (PUFA)-derived, lipid peroxidation products (LOPs), and when employed as frying media, or allowed to peroxidatively degrade during prolonged periods of storage and/or exposure to light, such toxins can be generated within PUFA-rich SFO products. 7, 8.
Therefore, in this investigation we have developed and applied 400 MHz 1H NMR analysis and linked chemometrics strategies in order to explore the total molecular (predominantly lipidic) composition of a large cohort of virgin (unrefined) SFO samples produced by a range of mill manufacturing sources located in East Africa, specifically at Ugandan and Tanzanian sites. Indeed, these techniques were employed to provide valuable molecular information to support the quality and authenticities of these oils, and also to test the effectiveness and reliabilities of NMR-based chemometrics strategies for the purpose of distinguishing between authentic, East African-produced virgin SFOs and corresponding products commonly available for purchase at EU (UK-based) retail outlets, and which have been exposed to rigorous industrial refinement processes.
2. Materials and Methods
2.1 1H NMR analysis
1H NMR measurements on the above samples were conducted on a 400 MHz Bruker Avance spectrometer operating at a frequency of 399.94 MHz and a probe temperature of 293 K. All spectra were acquired as described in9, 10, 11. Typically, a 0.20 mL aliquot of each oil sample was diluted to a final volume of 0.76 mL with deuterated chloroform (C2HCl3) containing 3.67 mmol.L-1 tetramethylsilane (TMS) as a δ = 0.00 ppm chemical shift reference, 3.95 mmol.L-1 1,3,5-trichlorobenzene (1,3,5-TCB) as a quantitative internal standard, and 1.32 mmol.L-1 of the chain-breaking antioxidant 2,5-di-tert-butylhydroquinone (DTBHQ). The C2HCl3 diluent provided a field frequency lock. These solutions were then transferred to 5-mm diameter NMR tubes. Typical pulsing conditions were: 128 or 256 free induction decays (FIDs), using 65,536 data points and a 4.5 s pulse repetition rate, the latter to allow full spin-lattice (T1) relaxation of protons in the samples investigated. Resonances present in each spectrum were routinely assigned by a consideration of chemical shifts, coupling patterns and coupling constants. One- and two-dimensional COSY and TOCSY spectra were acquired to confirm 1H NMR assignments, as previously described8, 9, 10, 11.
2.2 SFO samples: Determination of their Fatty Acid Contents
Samples of East African virgin (EAV) SFOs (unrefined) were provided by a range of manufacturing processing mills located in Uganda and Tanzania, as part of a UN International Trade Centre (ITC) project to promote the development of trading opportunities for such oils in the European and US markets (ITC Project Code A854- IC78 - INT/71/21A - [M1]). For this pilot investigation, a total of n = 55 EAV SFO samples were collected from these sources.
Samples of branded, refined SFOs commercially-available in the EU (n = 4) were purchased from retail outlets in the UK.
The saturated and monounsaturated fatty acid (SFA and MUFA respectively) and PUFA contents of these SFO samples were estimated via integration of intelligently-selected 1H NMR buckets (ISBs) featuring their acylglycerol bis-allylic-CH=CH-CH2-CH=CH-, -CH2-CH=CH-, α-CH2-CO2- and glyceryl backbone -CH2OCOR function resonances (δ = 2.73-2.88, 1.96-2.13, 2.26-2.37 and 4.10-4.15/4.28-4.33 ppm respectively), i.e. an adaption of the method described in12. Intelligently-selected buckets (ISBs) were pre-set via the spectral preprocessing strategy described in section 2.3.
From the FA compositions of these oils, their intrinsic peroxidative susceptibility indices (PSIs) were computed as previously described13, i.e. PSI = (0.025(% monoenoic FA)) + (1.00(% dienoic FA))+ (2.00(% trienoic FA)) +(4.00(% tetraenoic FA)) + (6.00(% pentaenoic FA)) + (8.00(% hexaenoic FA)). However, for all SFOs investigated here, contributions to the PSI from trienoic, tetraenoic, pentaenoic and hexaenoic FA sources were negligible.
2.3 Preprocessing of 1H NMR spectral profiles
1HNMR spectra acquired were preprocessed by the application of a separate macro for the ‘intelligent bucketing’ processing sub-routine. These procedures were conducted using the ACD/Labs Spectrus Processor 2017 software package (ACD/Labs, Toronto, Ontario, Canada M5C 1T4), and this generated a culinary oil dataset matrix consisting of ISBs corresponding to all molecular species detectable, including triacylglycerols (intense resonances in the δ = 0.85-5.60 ppm chemical shift range), triacylglycerol hydrolysis products (di- and monoacylglycerols, and free glycerol (δ = 3.65-5.27 ppm), and naturally-occurring sterols and stanols (C18-CH3 function resonances within the δ = 0.50-0.75 ppm chemical shift range). Prior to commencing this intelligent bucketing process, all spectra were examined visually for any inherent distortions and manually corrected, if required. The electronic intensities of resonances corresponding to ISBs encompassing individual 1H NMR resonances arising from all of the above agents were constant sum-normalized (CSN), generalized logarithmically (glog)-transformed, and Pareto-scaled prior to the performance of univariate and multivariate chemometrics analyses. However, we found that the concentrations of 1H NMR-detectable lipid oxidation products (LOPs) present in the unrefined EAV SFO products, predominantly those of conjugated hydroperoxydienes, but also including that of a very minor single aldehyde classification (n-alkanals) visible in some spectra at levels < 60 µmol.kg-1 (determined as in 9, 10, 11) were generally higher than those found in the refined UK products, a consequence of their development during periods of storage and transport to our UK laboratory. Therefore, all 1H NMR resonances arising from these LOPs were first removed from the spectral profiles prior to both univariate and multivariate statistical analyses in order to simplify these and allow us to focus on all other agents detectable. However, virtually all routine monitoring tests performed by governmental monitoring bodies in both Uganda and Tanzania found that the lipid peroxide levels present in these products were below the standard codex limits for these toxins when tested at their production sites (≤ 10 mequiv. O2/kg).
2.4 Quality Assurance/Quality Control Monitoring of 1H NMR Analyses
‘Between-assay’ sample coefficients of variation for all fatty acid and further component determinations (including minor and trace level agents) made on replicated oil samples (both EAV and refined EU products) were 3-7%, whereas those for repeat determinations made on the same oil sample within the same analytical batch were ≤ 3.2%.
For the analysis of trace level agents of relatively low or very low 1H NMR resonance intensities in spectra of these oil samples, lower limits of detection and quantification values (LLOD and LLOQ respectively) were found to be 30 and 100 µmol. Kg-1 respectively (equivalent to 9 and 30 µmol./mol. fatty acid respectively), for the diluted oil samples prepared as outlined in section 2.2 above (LLOD and LLOQ represented 3- and 10-fold signal-to-noise (STN) ratios respectively). These values arise from the influence of significant oil medium matrix effects at the oil/C2HCl3 dilution ratios employed. As expected, these values improved approximately 2-fold with lower C2HCl3 dilution levels of such oils (i.e. ca. 2/3 rather than ca. 1/3 or 1/4 primary dilutions), and also the acquisition of larger numbers of 1H NMR scans (for example, 1,024 or 2,048).
2.5 Experimental Design and Statistical Analysis
The experimental design for univariate analysis of the total culinary oil-1H NMR ISB intensity dataset involved an analysis-of-variance (ANOVA) model, which incorporated 1 prime factor and 2 sources of variation: (1) that 'between-SFO classifications’, qualitative fixed effect (Oi); and (2) experimental error (eij). This experimental design is represented by equation 1, in which yij represents the (univariate) ISB dependent variable CSN-normalised integration values observed, and μ their overall population mean values in the absence of any significant, influential sources of variation. This model is equivalent to a two-sample t-test.
yij = μ + Oi+ eij(1)
ANOVA was conducted with XLSTAT201software. Datasets were constant sum normalised, generalised logarithmically (glog)-transformed, and Pareto-scaled prior to analysis in order to satisfy assumptions of normality and homoscedasticity.
2.6 Multivariate Chemometrics and Algorithmic Computational Intelligence Analyses
Principal component analysis (PCA), partial least squares-discriminatory analysis (PLS-DA), orthogonal partial least squares-discriminatory analysis (OPLS-DA), and agglomerative hierarchal clustering (AHC) analysis of the culinary oil NMR-based ISB resonance intensity dataset was performed using Metaboanalyst4.0 software module options. Random forest (RF) and support vector machine (SVM) computational intelligence modelling strategies for SFO sample classification were also performed using this software module.
The random forest (RF) machine learning algorithm technique employed for classification and discriminatory variable selection purposes used the Random Forest Metaboanalyst4.0 module, with 1,000 trees (ntree) and 7 predictors selected at each node (mtry) following tuning. Datasets were randomly split into training and test sets containing approximately two-thirds and one-third of them respectively. The training set was used to build the RFs model and obtain an out-of-the-bag (OOB) error value in order to assess the performance of the classification.
The support vector machine (SVM) computational intelligence analysis was also employed for the purpose of distinguishing between the 1H NMR profiles of EAV SFOs and EU refined products, and for this purpose, appropriate models with increasing numbers of predictor variables were constructed using a mean decrease in accuracy (MDA) approach.
ROC curve analysis involved determinations of areas under the receiver operating characteristic (AUROC) curve for increasing numbers of 1H NMR-based ISB variables. This AUROC parameter serves a measure of the validity of multivariate (MV) models based on their sensitivities and specificities, i.e. a computed reflection of the number of samples correctly and incorrectly classified. Therefore, ROC curves represent plots of sensitivity vs. (1-specificity), i.e. true positives versus false positives.
3. Results
3.1 1H NMR profiles of East African Virgin and Refined EU-Available Refined SFOs, including their Saturated, Monounsaturated and Polyunsaturated Fatty Acid Contents
Typical 1H NMR spectra of EAV and EU-refined SFO samples are shown in Figure 1. Resonances visible in these spectral profiles are listed in Table 1 for both major and minor acylglycerol functions, and also for a range of further minor agents detectable within the expanded regions of these spectral profiles, including hydrolysis products, along with sterols and stanols.
Figure 1. 0.75-6.10 ppm regions of the 1H NMR spectra of commercially-available refined (top, red) and East African virgin (bottom, blue) SFOs in C2HCl3 solution.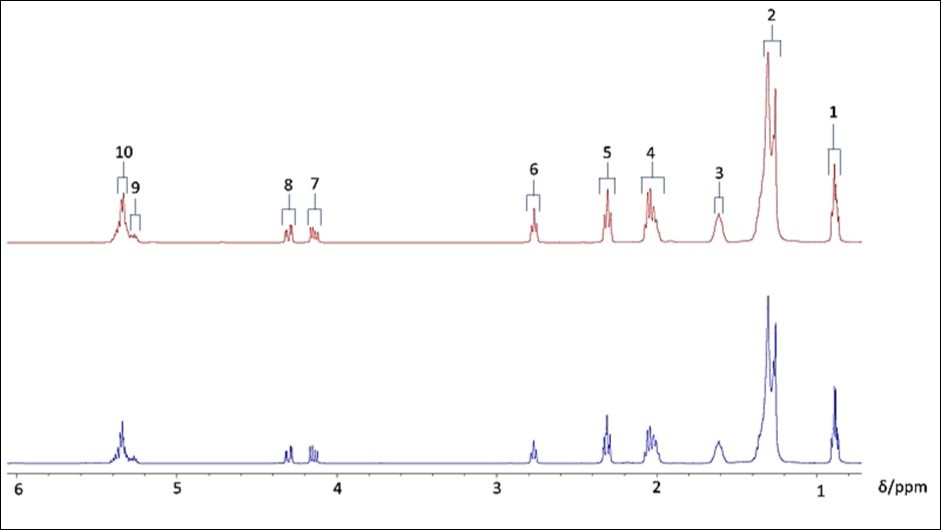
Download figure
Figure. 1 Abbreviations: 1 and 2, terminal-CH3 and bulk chain-CH2 n- functions, respectively, of all acylglycerol fatty acid species (with the exception of the terminal-CH3 group of linolenylglycerols which has a resonance located at δ = 0.952 ppm and which is not visible in the spectra shown here in view of its low intensity and overlap with a 13C satellite signal of the non-linolenoylglycerol fatty acid-CH3 function); 3, acylglycerol-OCO-CH2-CH2-; 4, acylglycerol unsaturated fatty acid (UFA)-CH2-CH=CH-; 5, acylglycerol-OCO-CH2-; 6, acylglycerol PUFA-CH=CH-CH2-CH=CH-; 7 & 8, glycerol backbone sn-1 and sn-3 position-CH2OCOR functions; 9, glycerol backbone sn-2 position-CHOCOR function; 10, acylglycerol UFA-CH=CH-. Typical spectra are shown. Note the lower relative intensity of the PUFA-CH=CH-CH2-CH=CH- resonance in the East African virgin SFO (blue) spectrum (centred at δ = 2.76 ppm), which is expected for SFOs with lower PUFA contents.
Table 1. Chemical shift assignments and multiplicities of the 1H NMR resonances detectable in the 1H NMR profiles ofSFO samples investigated (both major and minor agents found, acylglycerol or otherwise, are indicated).| Chemical Shift (δ)/ppm | Multiplicity | Assignment Function | Molecular Assignment(s) | Major or Minor Molecular Species |
| 0.54 | s | C18-CH3 function/steroid | ∆7-Avenasterol | Minor |
| 0.685 | s | C18-CH3 function/ steroid | β-Sitosterol/Δ5-Campesterol | Minor |
| 0.705 | s | C18-CH3 function/ steroid | Δ5-Stigmasterol/Brassicasterol | Minor |
| 0.88 | t | -CH3 | Acylglycerol terminal-CH3: saturated, ω-7 and/or ω-9 MUFA functions | Major |
| 0.89 | t | -CH3 | Acylglycerol terminal-CH3: unsaturated ω-6 acyl groups | Major |
| 0.955 | t | -CH3 | Acylglycerol terminal-CH3: unsaturated ω-3 acyl groups | Major |
| 1.22-1.42 | m | -(CH2)n- | Acylglycerol bulk chain acyl groups (all acylglycerols) | Major |
| 1.52-1.66 | m | -OCO-CH2-CH2-/H2O | Acyglycerol acyl groups/H2O contaminant | Major |
| 1.67 | s | -CH3 | Squalene | Minor |
| 1.81 | m | 1H nucleus of the carbon α- to the lactone ring methine function 14* | γ-Stearolactone* 14 | Minor |
| 1.94-2.14 | m | -CH2-CH=CH- | Acyglycerol acyl groups | Major |
| 2.305 | dt | -OCO-CH2- | Acylglycerol acyl groups | Major |
| 2.765 | dd | -CH=CH-CH2-CH=CH- | Acylglycerol bis-allylic-CH2 group (ω-6 fatty acids) | Major |
| 2.80 | dd | -CH=CH-CH2- CH=CH- | Acylglycerol bis-allylic-CH2 group (ω-3 fatty acids) | Major |
| 3.35 | s | -N(CH3)3+ | Phosphatidylcholine | Minor |
| 3.54, 3.64 | dd (AB component of ABX system) | HOCH2 -H(OH)-CH2OH | Free glycerol 15 | Minor |
| 3.65 | ddd | RCO-OCH2-CHOH-CH2OH | sn-1-Monoacylglycerols 16 | Minor |
| 3.725 | m | RCO-OCH2-CH(OCOR’)-CH2OH | sn-1,2-Diacylglycerols 16 | Minor |
| 3.84 | m | HOCH2-CHOCOR-CH2OH | sn-2-Diacylglycerols 16 | Minor |
| 3.94 | m | RCO-OCH2-CHOH-CH2OH | sn-1-Monoacylglycerols 16 | Minor |
| 4.14, 4.30 | dd,dd | RCO-OCH2- CH(OR’)-CH2OCOR’’ | Acylglycerol C1,3-glyceryl backbone function | Major |
| 4.18 | ddd | RCO-OCH2-CHOH-CH2OH | sn-1-Monoacylglycerols 16 | Minor |
| 4.28 | ddd | RCO-OCH2-CH(O-COR’)-CH2OH | sn-1,2-Diacylglycerols 16 | Minor |
| 4.93 | m | HOCH2-CH(OCOR)-CH2OH | sn-2-Diacylglycerols 16 | Minor |
| 4.95-5.07 | dq,dq | -CH=CH2 | Unsaturated ω-1 fatty acid acyl groups | Minor |
| 5.08 | m | ROCOCH2-CH(OCOR’)-CH2OH | sn-1,2-Diacylglycerols 16 | Minor |
| 5.22-5.30 | m | >CHOCOR | Acylglycerol C2-glyceryl backbone function | Major |
| 5.30-5.47 | m | -CH=CH- | Acylglycerol acyl group vinylic protons | Major |
| 5.75-5.86 | m | -CH=CH2 | Unsaturated ω-1 fatty acid acyl groups | Minor |
Results arising from the determination of differing classes of fatty acids in EAV SFOs are shown in Table 2, which provides the saturated, monounsaturated and polyunsaturated fatty acid contents of a total of n = 55 EAV and 4 commercially-available EU-purchased refined SFO samples analysed.
Table 2. Mean±SEM Saturated (SFA, predominantly combined palmitic and stearic acids), Monounsaturated (MUFA, predominantly oleic acid) and Polyunsaturated (PUFA, predominantly linoleic acid) fatty acid contents of n = 55 East African virgin and n = 4 refined SFOs commercially available in the EU. Abbreviations: CIs, 95% confidence intervals. *p < 10-3.| Oil Sample Group | Mean±SEM (95% CIs)Total SFAs (%) | Mean±SEM(95% CIs)Total MUFAs (%) | Mean±SEM(95% CIs)Total PUFAs (%) | Omega-3 Fatty Acids (% Linolenate) |
| East African VirginSFOs (n = 55) | 9.81±0.22 (95%CI 9.36-10.25%) | 39.78±0.57*(95% CI 38.63-40.93%) | 50.42±0.61*(95% CI 49.20-51.64%) | ≤ 0.20% |
| UK RefinedSFOs (n = 4) | 9.98±0.53 (95%CI 9.62-10.20%) | 31.31±0.62(95% CI 29.35-33.275%) | 58.61±0.69(95% CI 56.41-60.81%) | ≤ 0.20% |
| Codex Standards | 10.10%(expected value) | 14.00-39.40% | 48.30-74.00% | ≤ 0.20% |
| East African (Ugandan) Standards 17 | 6-20% | 14-35% | 55-75% | < 0.30% |
Comparisons of mean±95% confidence intervals (CIs) % values for the SFA, MUFA and PUFA contents of EAV SFOs with known international CODEX standard ranges for such oils, together with reference values available for Ugandan SFO products 17, are also provided. The full spectra displayed in Figure 1 clearly demonstrate the lower intensities of the bis-allylic-CH2- and vinylic -CH=CH- function resonances in the EAV SFO samples, and this reproducibly provided a high level of evidence for the lower unsaturation status of these products, i.e. lower contents of PUFAs therein. Indeed, the percentage contents of FAs in these and the refined EU-available SFOs (Table 2) clearly demonstrated that there were very highly statistically significant higher MUFA and lower PUFA contents of the EA virgin oils when expressed relative to those of the refined EU-based products (p = 2.24 and 6.90 x 10⁻⁴ respectively). However, no significant differences were found between the mean SFA contents of these two oil classifications.
Sixteen out of 55 of the estimated % PUFA (predominantly linoleic acid) contents were found to be lower than the codex standard for these values for SFOs (48.30-74.00%), although these lower level values were all found to be similar to the minimum codex standard value (i.e. 43-48%). However, 37 of the MUFA (predominantly oleic acid) function determinations were greater than the codex standard range for SFO (14.00-39.40%). These higher MUFA content values ranged from 28 to 46%, although many of those outside the upper codex limit standard were very close to it. The SFA contents of these oils, notwithstanding, were all very similar to the mean value expected for SFO (10.10%).
As expected, there was a highly significant negative Pearson correlation between the MUFA and PUFA contents of the East African virgin SFOs (r = -0.931, p < 10-4), together with another significant negative one between the percentage content of PUFAs and that of SFAs (r = -0.337, p = 1.18 x 10⁻² ).
In view of these observations, the mean peroxidative susceptibility indices of these products were very highly significantly lower than that of the refined EU versions, i.e. 51.6 versus 59.6 respectively, i.e. the mean EA virgin product value was 8.0% lower than that of refined EU SFOs in view of its significantly higher mean [MUFA]:[PUFA] content ratio.
In view of the much wider chemical shift spread of 13C NMR signals, much additional detailed information regarding the precise molecular nature and contents of a very wide range of SFO acylglycerol species was provided by the exploitation of such NMR datasets. This included valuable information on the regiospecific substitutional status of different FA agents on the glycerol backbone, and a detailed examination of the methylenic, olefinic, and carbonyl function resonances permitted direct structurally-specific evaluations of the relative contents of individual fatty acids (e.g. oleic and linoleic acids, together with SFAs) in the SFO samples investigated. Indeed, their 13C NMR spectra acquired in this study confirmed the relatively high contents of MUFAs present in EAV SFOs. This observation was conducted via quantitative assessments of the intensities of the olefinic C9 and C10 position 13C resonances of oleoylglycerols, and their expression relative to those of the C10 and C12 position ones of linoleoylglycerols (δ = 127-131 ppm 18) within the spectral profiles acquired (data not shown). These results will be reported in detail elsewhere.
3.2 Direct Non-Invasive 1H NMR Analytical Screenings of SFO Sterols and Stanols
Cholesterol-suppressing sterols and stanols were determined in all EAV SFO samples analysed via the detection, intelligent bucketing and electronic integration of their C18-CH3 function 1H NMR signals (data not shown). Statistical analysis of the results acquired revealed statistically significantly higher levels of these agents in these virgin SFO products than those observed in the refined EU-available ones investigated, specifically β-sitosterol/Δ-7-campesterol and ∆5-stigmasterol/brassicasterol (p = 6.54 x 10⁻⁴ and 2.61 x 10⁻³ respectively, Table 3), and this serves as a potentially impacting health benefit for these oils.
Table 3. False discovery rate (FDR)-corrected ANOVA-determined p values arising from univariate ANOVA, and also significant multivariate AUROC model evaluations (top 20 predictor variables) performed on all 1H NMR intelligently-selected buckets (ISBs). ISB assignments and the classification in which they are present at significantly higher levels are indicated. Abbreviation: EAV, East African virgin oils. *Tentative assignment.| ISB (ppm) | FDR-adjusted p value | Assignment | Difference observed | ROC key variable ranking |
| 0.66-0.69 | 6.54 x 10⁻⁴ | C18-CH3 β-Sitasterol/Δ-7-Camposterol (steroid functions) | EAV ↑ | > 20 |
| 0.69-0.75 | 2.61 x 10⁻³ | C18-CH3 Δ5-Stigmasterol/Brassicasterol (steroid functions) | EAV ↑ | >20 |
| 0.75-0.78 | 2.94 x 10⁻⁴ | Terminal-CH313C satellite | EAV ↑ | >20 |
| 0.78-0.80 | 9.97 x 10⁻⁶ | Terminal-CH313C satellite | EAV ↑ | >20 |
| 0.80-0.95 | 7.60 x 10⁻⁷ | Terminal-CH3, including its 13C satellite. | EAV ↑ | 4 |
| 1.00-1.02 | 1.51 x 10⁻³ | Bulk chain (-CH2-)n13C satellite | EAV ↑ | >20 |
| 1.02-1.06 | 9.46 x 10⁻³ | Bulk chain (-CH2-)n13C satellite | EAV ↑ | >20 |
| 1.06-1.08 | 8.63 x 10⁻⁴ | Bulk chain (-CH2-)n13C satellite | EAV ↑ | >20 |
| 1.08-1.10 | 4.27 x 10⁻⁴ | Bulk chain (-CH2-)n13C satellite | EAV ↑ | >20 |
| 1.10-1.13 | 1.89 x 10⁻⁴ | Bulk chain (-CH2-)n | EAV ↑ | >20 |
| 1.13-1.15 | 3.93 x 10⁻⁵ | Bulk chain (-CH2-)n | EAV ↑ | >20 |
| 1.15-1.17 | 9.35 x 10⁻⁶ | Bulk chain (-CH2-)n | EAV ↑ | >20 |
| 1.17-1.20 | 7.60 x 10⁻⁷ | Bulk chain (-CH2-)n | EAV ↑ | >20 |
| 1.20-1.22 | 2.94 x 10⁻⁶ | Bulk chain (-CH2-)n | EAV ↑ | 9 |
| 1.22-1.24 | 1.35 x 10⁻⁵ | Bulk chain (-CH2-)n | EAV ↑ | 11 |
| 1.24-1.29 | 9.35 x 10⁻⁶ | Bulk chain (-CH2-)n | EAV ↑ | 12 |
| 1.35-1.41 | 1.63 x 10⁻³ | Bulk chain (-CH2-)n13C satellite | Refined ↑ | >20 |
| 1.41-1.47 | ns | OCO-CH2-CH2- | EAV ↑ | 19 |
| 1.47-1.52 | ns | OCO-CH2-CH2- | EAV ↑ | 10 |
| 1.52-1.54 | ns | OCO-CH2-CH2- | EAV ↑ | 13 |
| 1.73-1.79 | 1.92 x 10⁻¹¹ | γ-Stearolactone-1H nucleus of the carbon α- to the lactone ring methine function 14* | Refined ↑ | 20 |
| 1.79-1.83 | 5.14 x 10⁻²⁴ | γ-Stearolactone-1H nucleus of the carbon α- to the lactone ring methine function 14* | Refined ↑ | 1 |
| 1.83-1.89 | 3.06 x 10⁻⁵ | γ-Stearolactone-1H nucleus of the carbon α- to the lactone ring methine function 14* | Refined ↑ | 8 |
| 1.95-1.97 | 4.66 x 10⁻³ | -CH2-CH=CH- | EAV ↑ | >20 |
| 1.97-2.03 | 6.20 x 10⁻⁴ | -CH2-CH=CH- | EAV ↑ | 15 |
| 2.03-2.09 | 4.61 x 10⁻⁴ | -CH2-CH=CH- | Refined ↑ | 14 |
| 2.13-2.19 | 1.91 x 10⁻³ | 13C satellite of -OCO-CH2- | EAV ↑ | 5 |
| 2.19-2.22 | 1.136 x 10⁻³ | 13C satellite of -OCO-CH2- | EAV ↑ | 3 |
| 2.24-2.28 | 1.126 x 10⁻² | -OCO-CH2- | EAV ↑ | >20 |
| 2.70-2.72 | 2.39 x 10⁻³ | -CH=CH-CH2-CH=CH- | Refined ↑ | 6 |
| 2.74-2.80 | 9.55 x 10⁻⁴ | -CH=CH-CH2-CH=CH- | Refined ↑ | >20 |
| 2.80-2.86 | 4.35 x 10⁻² | -CH=CH-CH2-CH=CH- | Refined ↑ | >20 |
| 4.09-4.11 | 3.11 x 10⁻² | RCO-OCH2-CH(OH)-CH2OCOR’ sn-1,3-Diacylglycerols | Refined ↑ | >20 |
| 4.13-4.19 | ns | -CH2OCOR (Glyceryl backbone function)/-CH2OH Glyceryl group in sn-1,3-diacylglycerols/sn-1-monoacylglycerols | Refined ↑ | 7 |
| 4.26-4.30 | 6.54 x 10⁻⁴ | -CH2OCOR Glyceryl backbone function in 1,2-diacylglycerols | EAV ↑ | 16 |
| 4.30-4.36 | ns | RCO-OCH2-CH(OCOR′)-CH2OH Glyceryl backbone group in 1,2-diacylglycerols | EAV ↑ | 17 |
| 4.36-4.41 | 3.17 x 10⁻⁴ | RCO-OCH2-CH(OCOR′)-CH2OH Glyceryl backbone group in 1,2-diacylglycerols | EAV ↑ | 2 |
| 5.30-5.36 | 1.32 x 10⁻² | -CH=CH- | Refined ↑ | >20 |
| 5.36-5.42 | 1.054 x 10⁻³ | -CH=CH- | Refined ↑ | 18 |
3.3 Univariate Statistical Analysis of Differences Between EAV and Refined EU SFO Product 1H NMR ISB variables
Univariate chemometrics comparisons of the 1H NMR profiles of the EAV SFO samples with those of commercially-available, EU retail outlet-purchased refined ones performed demonstrated that false-discovery rate (FDR)-corrected one-way completely randomised design ANOVA p values were very highly significant for many of the SFO ISB variables (p values ranging from 10-24 to 10-2 for the top 39 variables selected by this approach, Table 3).
These data clearly confirm that the EA virgin SFO products contained lower PUFA levels, with significantly lower relative spectral intensities of the PUFA-specific bis-allylic-CH=CH-CH2-CH=CH- function resonance ISB (δ = 2.70-2.86 ppm) and those of the olefinic proton resonances (δ = 5.30-5.42 ppm). Moreover, these products had higher relative intensities of resonances assignable to the terminal-CH3 and bulk-chain (-CH2-)n functions, as expected. Further statistically significant resonance features were those arising from the higher intensity, spectrally-visible C18-CH3 functions of natural sterols and stanols (δ = 0.50-0.85 ppm). Further significant discriminatory ISB variable features found included much elevated 1.73-1.79, 1.79-1.83 and 1.83-89 ppm ISB intensities in the refined SFO classification (tentatively assigned to a γ-stearolactone-CH2 function resonance). Higher contents of 1,2-diacylglycerol primary triacylglycerol hydrolysis products were found in the EAV SFO samples. Contrastingly, higher levels of 1,3-diacylglycerols were found in the EU refined oils.
Partial 1H NMR spectra of typical EAV and EU-available refined SFO products, which demonstrate the clearly-visible 1.79-1.83 ppm ISB-centred resonance in the latter profile, are shown in Figure 2. This signal was not detectable in any of the EAV SFO spectra acquired.
Figure 2. Expanded 1.54-2.00 and 1.35-2.00 ppm regions of the 1H NMR profiles of (a) EU-available refined, and (b) EAV SFO products respectively. The major 1.79-1.83 ppm ISB marker resonance for the refined SFO products is indicated in (a).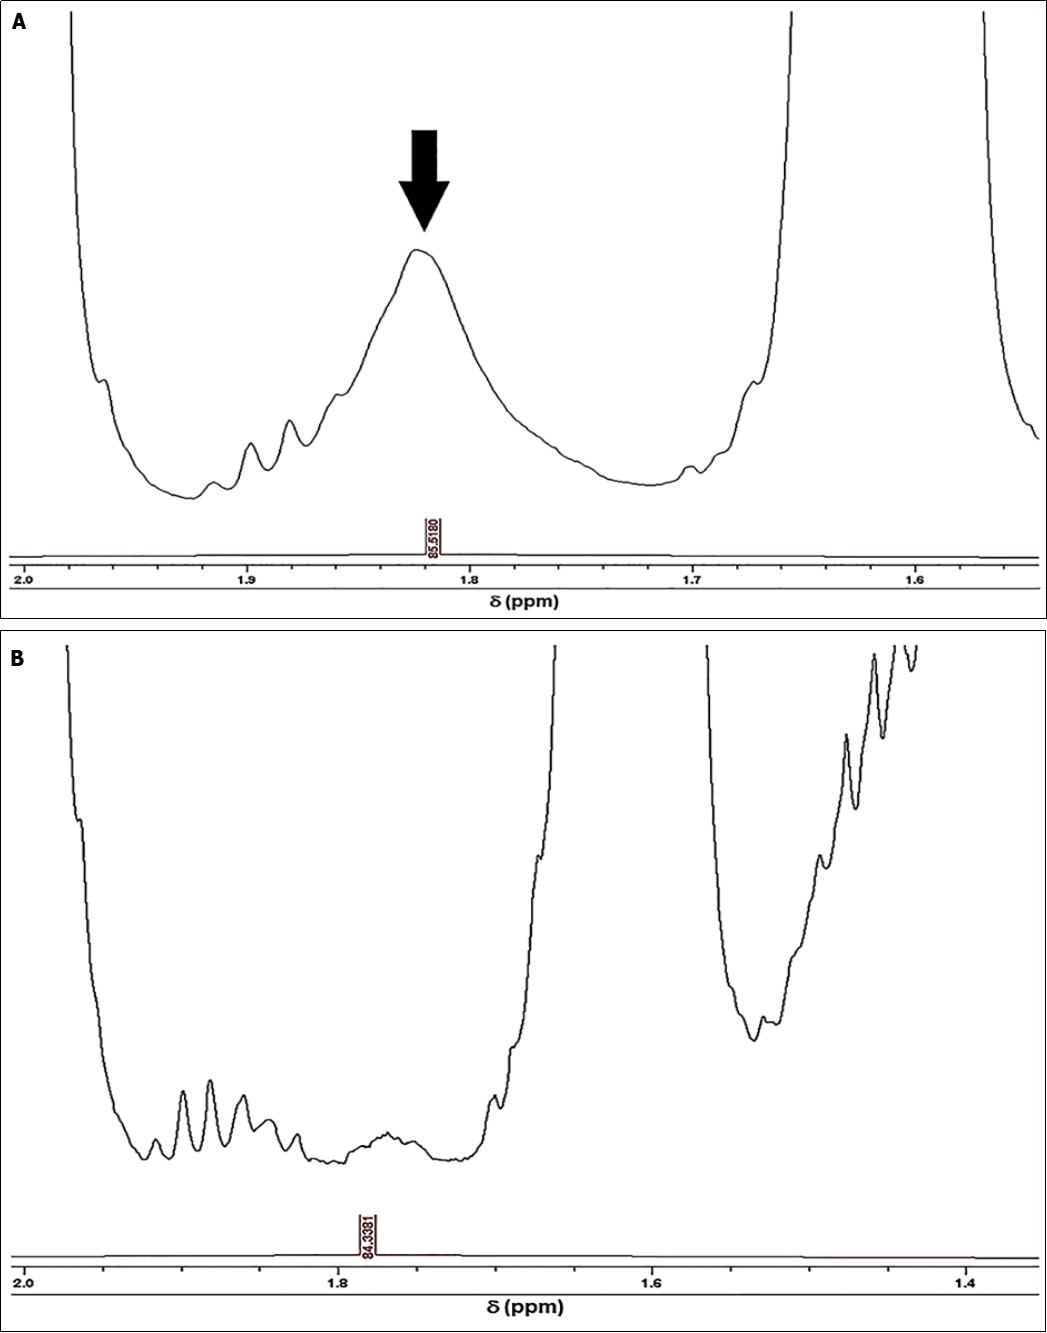
Download figure
All of the top 20 important variable features determined from a multivariate AUROC analysis of the complete dataset (section below) had statistically significant ANOVA p values.
3.4 1H NMR-Based Multivariate Statistical and Computational Intelligence Analysis Strategies Employed for Distinguishing East African virgin SFO Products from Commercially-Available EU Refined Ones
Multivariate chemometrics analysis was performed on the full 1H NMR dataset. Primarily, these analyses involved PCA and ROC curve analysis. Further multivariate chemometrics analysis was performed using PLS-DA, together with AHC, RF and SVM analysis strategies.
3.4.1 Principal Component Analysis (PCA) of the Multivariate SFO ISB Dataset
Principal component analysis (PCA) was primarily performed in order to obtain an overview of the degree of distinction between/clustering of the oil sample classifications explored, and also to detect any potential outliers. An investigation of two-dimensional (2D) PCA scores plots revealed that no major outliers were detectable, and that PCs 1 and 2 accounted for 36.1 and 23.0% of the total variance respectively. A 2D scores plot of these 2 most important PCs revealed that the two SFO sample groups investigated were readily distinguishable (Figure 3). All EU refined SFO product data-points had negative PC1 and highly negative PC2 scores vectors. No clear outliers were discernible in this plot.
Figure 3. PCA scores plot of PC2 versus PC1 for the 1H NMR spectral profile ISB dataset of EAV (blue) and refined, EU-available SFO products (red). The percentage contributions of each PC to the total model variance are provided in brackets for each axis label. Cluster centroids for each SFO classification are indicated in black.
Download figure
However, this plot also revealed two potential sub-clusters of the EVA SFO samples, the first with low, predominantly negative PC1 and PC2 scores vectors, the second with predominantly positive PC1 and PC2 ones. This sub-clustering may arise from differing sunflower cultivars, differing geographical sources of sunflowers cultivated (notably the altitude and climatic temperatures of such sites), differing sunflower qualities and types of sunflower seeds employed for oil extraction purposes, and/or differing SFO mill oil extraction techniques and temperatures employed, for example, between the 2 sub-clusters. Further investigations of these potential influences will be conducted by our group and reported in detail elsewhere.
3.4.2 ROC Curve Analysis of Differences between EA Virgin and EU-Available Refined SFOs
ROC curves produced via Monte Carlo cross-validation (MCCV) and based on the support vector machine (SVM) strategy demonstrated high mean classification success rates for this model. The most effective SVM models were those which incorporated ≥ 20 chemical shift bucket region intensity features, the AUROC value obtained being 0.997 for the 20 variable feature model (95% confidence intervals 0.967-1.000), as shown in Figure 4. Models incorporating > 20 variables gave rise to only very minor improvements in AUROC values and hence the classification success rate (Figure 4), so therefore the 20 variable model was adopted as the optimised strategy for these studies. Therefore, with the above overall classification reliability and AUROC values, this model applied served as one with a highly effective discriminatory ability (these values are considered effective, highly discriminatory and exceptional for models when they are > 0.70, 0.87-0.90 and > 0.90 respectively 19).
Figure 4. (a) ROC curve (plot of true positive vs. false positive rates) with an AUROC value of 0.997 obtained from the SVM model building system explored with 20 out of a possible 78 SFO sample ISB variables. ROC curves were developed via Monte Carlo Cross-Validation (MCCV) involving a balanced sub-sampling processes involving application of an SVM model builder (CSN-normalised dataset). The inset shows mean AUROC values estimated for increasing sampling sizes, together with 95% CIs for these values. 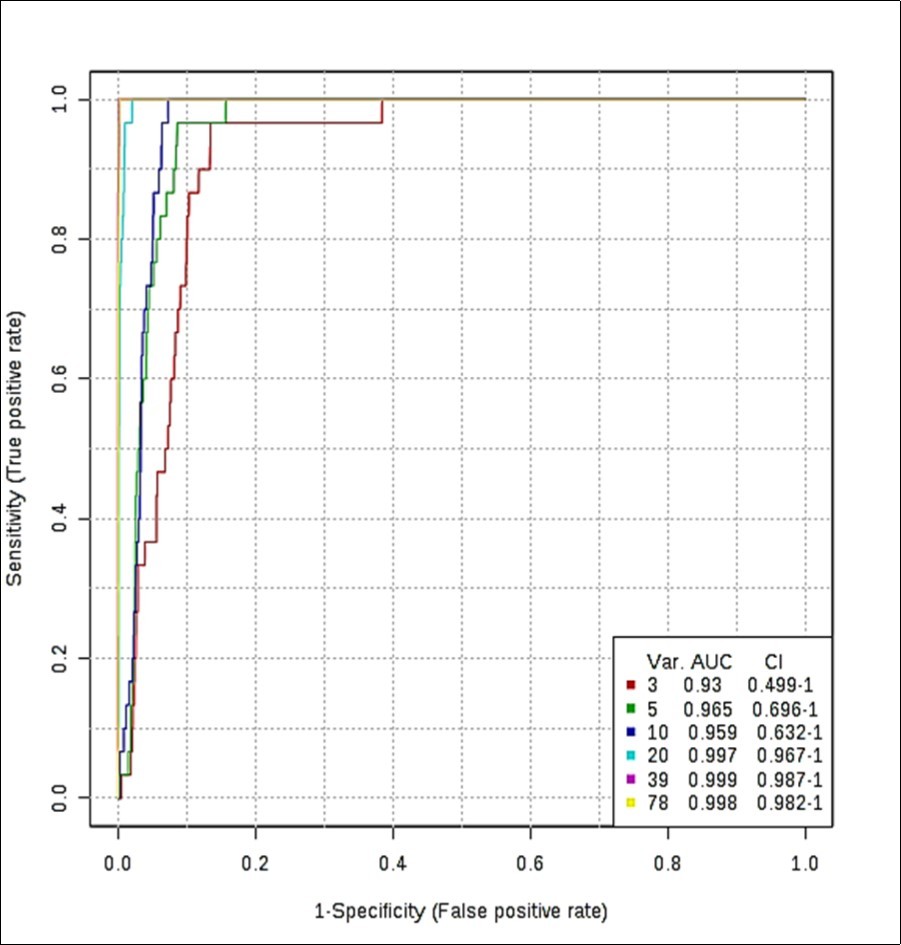
Download figure
Figure 4. (b) Probability view arising from a balanced sub-sampling approach for SVM model training (predicted class probabilities for each sample employed the most effective AUC-based classification system).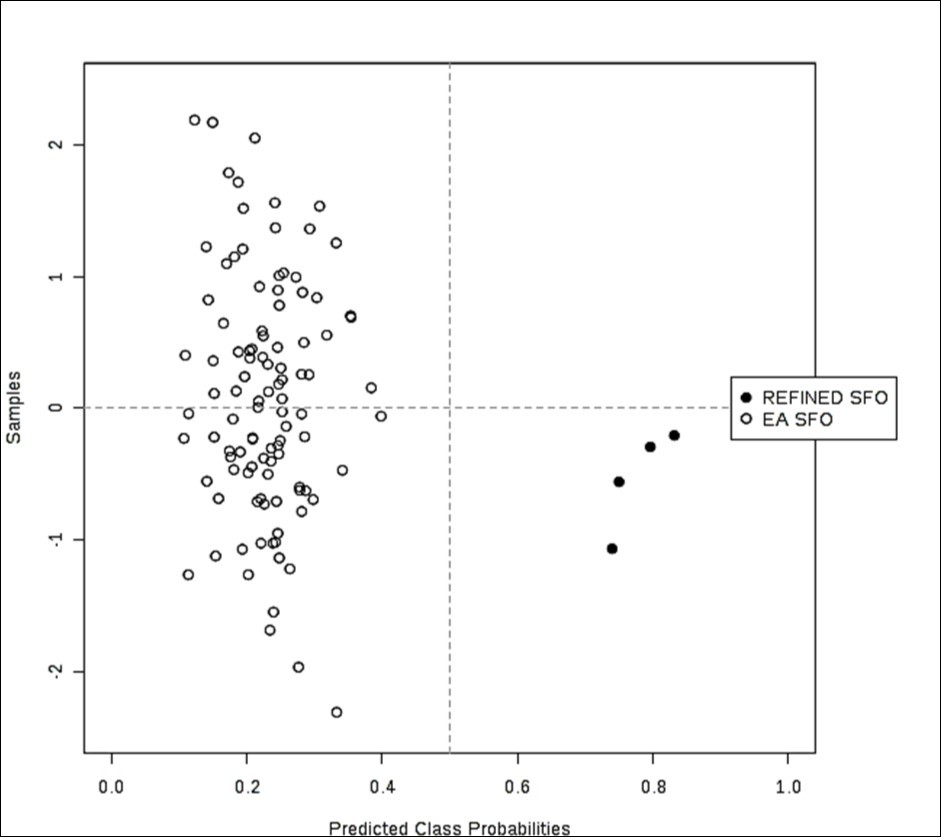
Download figure
Key discriminatory marker variables identified from this form of MV analysis for the model with 20 predictor ISB markers were: γ-stearolactone (tentative assignment, x 3), refined SFO↑ > sn-1,2-diacylglycerols, EAV SFO↑ (x 3) > triacylglycerol-OCO-CH2- function (x 2), EAV SFO↑ > terminal triacylglycerol-CH3, EAV SFO↑ > triacylglycerol PUFA-CH=CH-CH2-CH=CH-, refined SFO ↑ > sn-1,3-diacylglycerol/sn-1-monoacylglycerols, refined SFO↑ > triacylglycerol bulk (-CH2-)n (x 3), EAV SFO↑ > triacylglycerol-OCO-CH2-CH2- function (x 3), EAV SFO↑ > triacylglycerol-CH2-CH=CH- function (x 2), refined SFO↑ > triacylglycerol-CH=CH-, refined SFO↑ in that order of effectiveness. The (x 2) and (x 3) symbols indicate the number of times that corresponding, similar frequency ISB variables were featured in the top 20 ISB marker set, which are sequentially listed in Table 3
These data are clearly consistent with the higher PUFA contents of the EU-available refined SFO samples. Indeed, since all ISB variables were constant sum-normalised, lower levels of PUFAs present in the EAV SFO products will give rise to relatively higher resonance intensities for the non-PUFA- and more generally the non-olefinic function-associated resonances in their 1H NMR spectral profiles, for example those of the terinal-CH3, bulk chain (-CH2-)n, -OCO-CH2- and -OCO-CH2-CH2- functions, as observed here. These data are also fully consistent with results obtained from the univariate ANOVA model applied, i.e. a significantly higher unsaturation status of the refined EU SFO samples, reflecting a higher PUFA content and hence greater [PUFA]:[MUFA] content for this classification.
3.4.3 Distinction of SFO Classifications Using PLS-DA and OPLS-DA
For the PLS-DA approach employed, however, key discriminatory variables were selected on the basis of their variable importance in the projection (VIP) values. Validated and cross-validated area under the receiver operating characteristic curve (AUROC) was also selected as a method to determine the reliability of the models selected Table 3. Successful performance of the PLS-DA model was estimated using a test set (33% of the original number of samples), the remaining 67% being employed to construct the model. The PLS-DA technique generated Q2 values of > 0.78 for models containing a minimum of 3 orthogonal components (Figure 5). Permutationtesting of the best PLS-DA model with 2,000 permutations demonstrated a very high level of statistical significance regarding its ability to distinguish between the two oil classifications evaluated (p < 5 x 10⁻⁴).
Figure 5. Three-dimensional (3D) PLS-DA scores plot of component 3 versus component 2 versus component 1; these components accounted for 8.4, 12.3 and 24.3% of the total dataset variation, respectively. This plot shows clearly distinctive clusterings for the EAV and refined EU-purchased SFO sample study classifications. The differences observed are attributable to those between the first two component sample scores vectors, predominantly significantly lower component 1 and component 2 scores vectors for the natural EAV SFO product classification than those of the EU refined sample group.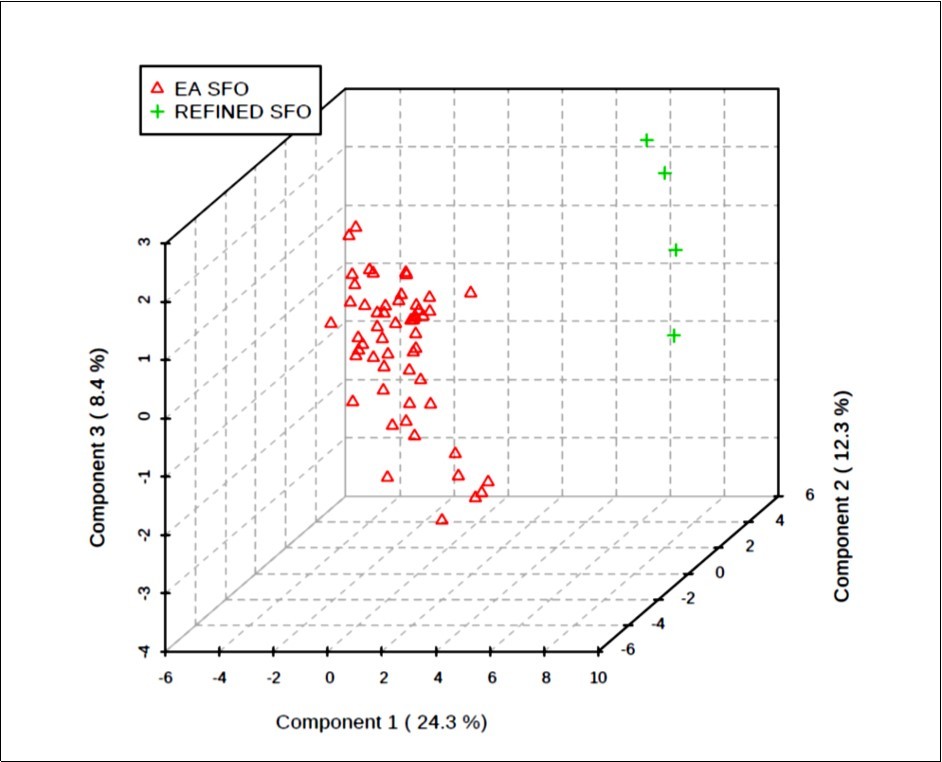
Download figure
Similarly, application of an OPLS-DA model provided a high level of evidence for the distinction of the two classes of SFO products compared (data not shown).
The most important discriminatory variables observed from these strategies included (1) higher MUFA and lower PUFA levels in the EAV SFOs; (2) the much elevated intensity of the 1H NMR 1.81 ppm ISB resonance in the refined EU samples, which is tentatively assignable to γ-stearolactone or one of its structurally-similar adducts, as noted in Table 314; and (3) higher concentrations of cholesterol-blocking sterols and stanols in the EAV SFOs.
3.4.4 AHC Analysis
Agglomerative hierarchal clustering (AHC) analysis demonstrated a very high level of distinction between the two SFO sample classifications investigated (Figure 4). This AHC classification model was based on dissimilarities between the grouped samples, and Figure 6 shows the progressive grouping of the dataset, and also the finalised clear distinction of the refined SFO group from the EAV one. A range of further clusterings and sub-clusterings within the EAV SFO sample group (i.e. major and minor respectively) are visible, and the sources of these will be further explored, and reported in detail elsewhere.
Figure 6. Agglomerative hierarchal clustering (AHC) analysis of the sunflower oil dataset. Colour codes: Red, EAV SFO samples; green, refined EU-purchased SFO samples. Numerical codes were randomly assigned for each SFO classification.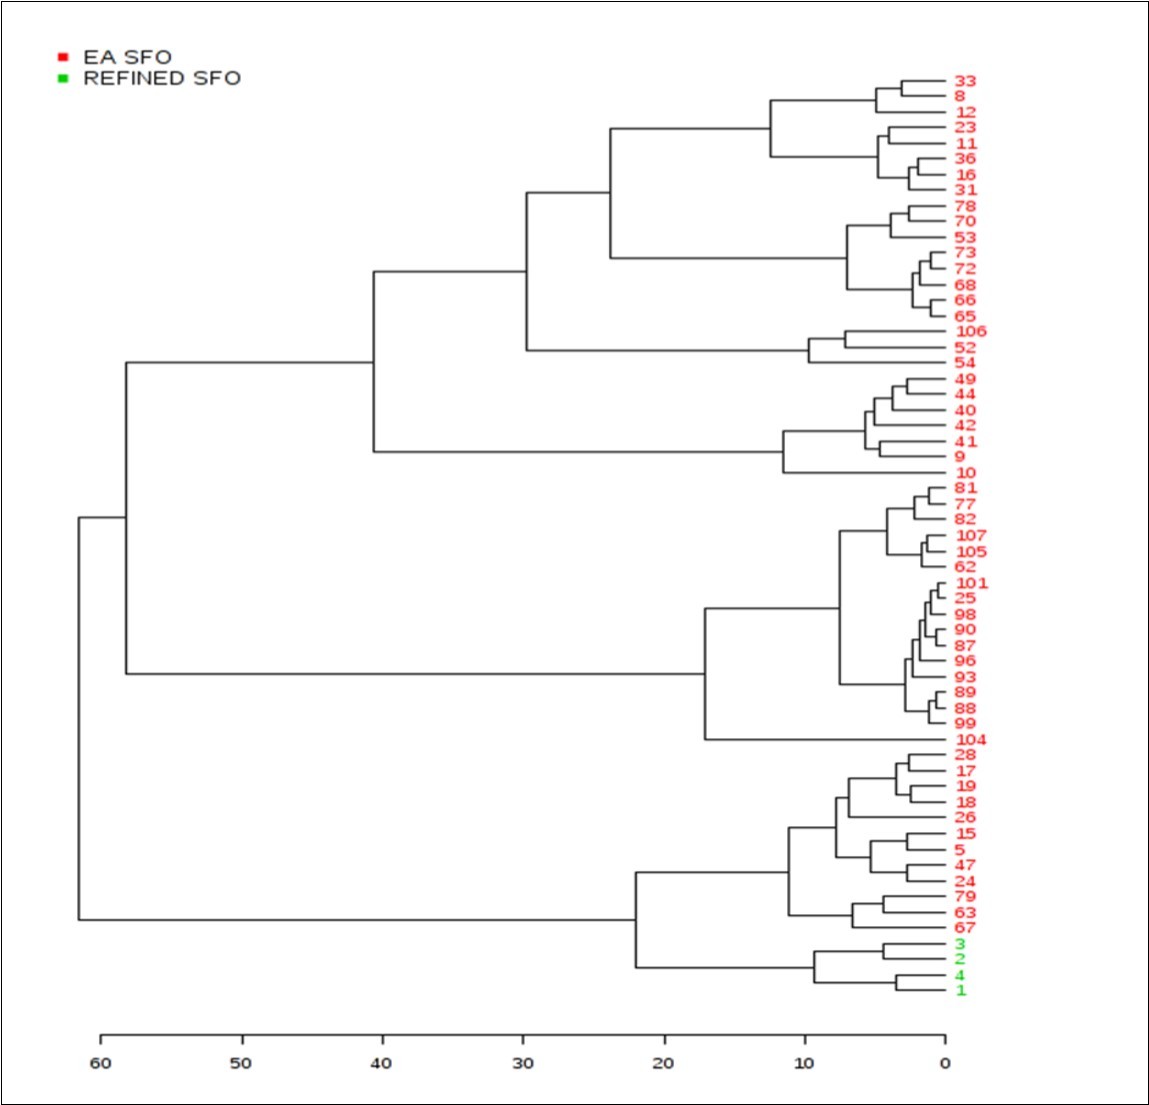
Download figure
3.4.5 RF and SVM Computational Intelligence Analysis Models
The RF and SVM computational intelligence algorithmic analysis model strategies applied displayed very high accuracies for predicting SFO classifications (i.e. EAV vs. EU refined controls). Indeed, these were > 99% overall for the RF model developed (with 54/55 EAV and 3/4 refined EU-purchased samples correctly classified), and 94.4, 94.4, 94.1, 92.7, 95.2, 99.2, 99.7 and 100% prediction accuracies for SVM models with totals of 5, 7, 9, 12, 16, 22, 37 and 74 predictor 1H NMR ISB variables, respectively, incorporated. Therefore, with the SVM model applied, only a low number of predictor variables was required (i.e., 6) to effectively distinguish between these two SFO sample classification groups.
Virtually all key distinguishing features detected by the RFs model employed were also discovered via the univariate FDR-corrected ANOVA testings applied (Table 3).
4. Discussion
Results acquired from our high-field 1H NMR investigation clearly demonstrated that EAV SFOs contain statistically higher and lower levels of MUFAs and PUFAs, respectively, than those determined in commercially-available, refined SFO products purchased from EU retail outlets. Moreover, statistically-significant higher levels of health-beneficial cholesterol-suppressing sterols and stanols were found in the EAV SFOs examined, as might be expected from their loss during the performance of industrial refinement processes with those commonly available for consumer purchase in the EU. These results serve to provide much valuable information regarding the potential health benefits offered by such virgin SFO products, which serves as a major resource asset for both food retailers and consumers.
Further clear molecular markers of the ‘virgin’ (unrefined) status of EAV SFO products were their significantly higher sn-1,2-diacylglycerol contents, an index which is also valuable as a marker of the virgin or extra-virgin status of olive oils 18. Indeed, such diacylglycerols (predominantly sn-1,2-diacylglycerols) in virgin olive oils have been found not to exceed a content of 2-3% (w/w) in these products, and they are derived from either incomplete triacylglycerol hydrolysis or limited lipase actions on these substrates. However, higher contents of diacylglycerols (largely sn-1,3-diacylglycerols) are found in ‘neutralized’ olive oils (i.e. refined olive oil) derived from a starting material (olives or olive-pomace) containing a high level of free FAs.
Although refining processes (involving treatments of chemical or physical neutralization, bleaching, deodorization and winterization) remove free FAs, they cause only a partial loss of diacylglycerols (which are absorbed in the soapy phase during oil neutralization and washing processes). Therefore, the total content of diacylglycerols and the ratio of sn-1,3-diacylglycerols to total diacylglycerols ([sn-1,3-]:[sn-1,2- + sn-1,3-]) permits us to distinguish between virgin olive oils and refined ones [18].
One very powerful marker variable detected was an agent with a relatively strong 1H NMR resonance centred at δ = 1.79-1.83 ppm in spectra acquired on the EU-purchased, refined SFO products tested (this was absent from the 1H NMR profiles ofall EAV SFOs analysed). This signal has been tentatively assigned to an 1H NMR-visible lactone ring site -CH2- function of γ-stearolactone 20, and further experiments to confirm this are currently in progress. Intriguingly, treatment of free oleic acid, i.e. that liberated from triacylglycerol hydrolysis, with relatively strong mineral acid such as that featured in the above degumming process, yields γ-stearolactone via a complex mechanism involving the intermolecular esterification of the carboxylic acid group by the MUFA substrate’s -CH=CH- function; this involves relocation of the olefinic -CH=CH- group into the Δ4,5-position. In principle, γ-stearolactone may arise during the degumming stage of the refinement process, which typically involves treatment of crude oil isolates with phosphoric acid, and the mixture heated at 45oC with slow agitation for a period of 30 min. (the medium is subsequently settled for 30 min., and then water containing dissolved ‘gum’ is allowed to drain out) 4. Hence, this process may be favourable to the generation of γ-stearolactone, since the phosphoric acid may directly activate the transformation of any free (unesterified) oleic acid in the medium to this product. Moreover, the high level of phosphoric (or other mineral) acid-accountable acidity in the degumming matrix would also promote the hydrolysis of triacylglycerols, a process yielding free oleic acid, amongst other fatty acids (from this work, the oleic acid content of refined EU-available SFO products, predominantly as oleoylglycerols, was found to be 31.3±0.6 molar %).
Moreover, the neutralisation stage of the refinement process, which involves adding the calculated quantity of 12% (w/w) sodium hydroxide solution from the free fatty acid content of the oil, followed by slow agitation of the mixture at 711oC 4, may further promote liberation of free fatty acids from triacylglycerols, which are then removed as a soap stock containing residual gums. Therefore, a sub-optimal neutralisation process may also give rise to excessive triacylglycerol hydrolysis to free fatty acids, together with their di- and monoacylglycerol, and free glycerol counterparts.
The range of MV analysis approaches applied here confirmed that there was an extremely high level of discrimination between the 1H NMR profiles of EAV SFOs and those of refined products of these oils purchased at EU retail outlets. Indeed, PLS-DA and OPLS-DA models all displayed highly distinctive, tight clusterings for the two sample classification groups explored and compared.
Exposure of PUFA-rich culinary oils to shallow- or deep-frying episodes gives rise to the production of very high levels of hazardous aldehydic LOPs 7, 8, 11. Such LOPs may indeed present both serious and chronic threats to human health, since toxicologically-significant levels of them are readily transferred to potato chips and other foods during these frying processes 8, 11. Therefore, it is anticipated that the use of SFO products with higher and lower contents of MUFAs and PUFAs, respectively, than those of refined, conventional SFO products will conceivably give rise to lower levels of such toxins when employed for common frying practices at ca. 180oC. Further experiments to explore this are currently in progress.
There is a wide range of potential health benefits offered by MUFA-rich diets. For example, a recent systematic review found that human blood plasma high-density-lipoprotein (HDL) cholesterol and total triacylglycerol concentrations are increased and decreased, respectively, in study participants after receiving a MUFA-rich diet 21.
Moreover, plant sterols and stanols suppress the in vivo absorption of cholesterol from the gut, and therefore have a powerful ability to reduce blood serum cholesterol concentrations 22. Indeed, the study involved investigated the ability of a sterol or stanol-supplemented margarine food product (2 g of esterified plant sterol or stanol added to a 25 g daily dietary allocation) to influence serum low-density-lipoprotein (LDL) cholesterol levels, and found that this dietary regimen gave rise to mean decreases in this heart disease risk parameter of 0.54, 0.43 and 0.33 mmol./L in study participants aged 50-59, 40-49 and 30-39 respectively; these agents were added to margarines as chemical esters in order to enhance their lipid solubilities. Hence, the dietary use of sterol- and stanol-rich virgin SFOs may represent an important innovation available for lowering heart disease risk in humans.
Although the major objectives of sunflower production is the optimisation of both grain and oil yields, recently there has been much demand for oils arising therefrom with specific and improved qualities. Indeed, the suitability of SFOs for food uses, most especially for frying purposes, is determined by their peroxidative resistance. Indeed, triggering of the lipid peroxidation process increasingly gives rise to a loss of nutritional value and the adverse generation of unpleasant odours and flavours (i.e. SFO and associated food product spoilage) 7.
Peroxidative stabilities of SFO products are critically determined by their contents of oleic acid (as oleoylglycerols) and lipid-soluble chain-breaking antioxidants (CBAs). Vitamin E (α-tocopherol, α-TOH) is considered to be one of the most important antioxidants in SFO, although a range of further CBAs such as γ-TOH are also present and detectable 23. However, the exposure of crude SFO to chemically- and physically-demanding refining processes gave rise to a total tocopherol loss of 30-35% 23. Moreover, as a MUFA with a single -CH=CH- function, oleic acid (18:1) is much more resistant to peroxidative degradation than its corresponding di-unsaturated PUFA linoleic acid, and hence SFOs charged with higher levels of it are more suitable for frying purposes 8, 9, 10, 11. Moreover, tocopherols have the capacity to block or delay the self-propagating, autocatalytic peroxidation of unsaturated fatty acids, particularly for the more susceptible PUFAs, and most especially during prolonged periods of storage at elevated tropical or sub-tropical temperatures.
Notwithstanding, the dietary PUFA linoleic acid (as linoleoylglycerols) is an essential fatty acid to humans, and evidence available supports its powerful cholesterol-reducing properties 24.
SFO yields and qualities are not only genotypically-determined, but also by their environmental interactions, and for traditional, non-high-oleic acid genotypes, these properties are critically affected by geographical locations and sowing dates. However, with sufficient nutrient and water provisions to sunflower crops, the qualities of grains and oils generated therein, together with their yields, are predominantly influenced by temperature and solar radiation exposure level 1, 2.
Interestingly, the influence of climatic temperature on the fatty acid composition of oil isolated from sunflower genotypes grown in tropical regions was recently investigated by Grunwald et. al.3, and these researchers found that in conventional ones, the minimum climatic temperature exerted a major effect on the triacylglycerol-bonded oleic acid:linoleic acid concentration ratios of these oils. Indeed, the % oleic acid content of these conventional genotypes could rise to and exceed 70% (w/w) in such oils, and higher locational temperatures gave rise to enhancements of up to 35% for this FA.
High-resolution 1H and 13C NMR analysis of culinary oils offers a wealth of opportunities regarding evaluations of the qualities, authenticities and storage/use stabilities of a very wide range of such products. Indeed, major advantages of these spectroscopic approaches are that the techniques involved are virtually non-invasive and involve only minimal sample manipulation and preparation protocols, and an extremely large number of lipidic, lipid-derived and further relevant molecules (both major and minor, the latter including potentially hazardous LOPs 25) can be simultaneously detected and determined within a very short period of time, i.e. that involving a ca. 5-10 min. acquisition time per sample for an 1H spectral profile, and hence this process enables a rapid sample throughput 11, 15, 26. As noted above, the quality and product authentificational aspects of this multianalyte form of analysis includes the relatively simple identification and determination of many minor agents, such as valuable sterols and stanols, and phenolic antioxidants, etc., most especially in unrefined virgin or extra virgin oil products. Significantly, these properties are related to their sensory and/or nutritional qualities, together with a means for assessing their geographical sources via NMR-linked, multidimensional chemometrics analyses.
Therefore, this multicomponent analytical strategy offers a very high level of potential regarding culinary oil characterisations, and structure-specific analysis of a wide range of SFO agents simultaneously serves to provide much valuable molecular information which indicates their genuineness and quality. Hence, high-field NMR analysis offers reliable and rapid methodologies for employment as official and validated authentificational strategies, especially when utilised in conjunction with alternative, more conventional methods.
A further promising application of this work involves the solving of problems associated with the oils’ geographical classification, particularly for those with Protected Origin Denominations (PODs). For such investigations, a plethora of reliable datasets are required for the purpose of constructing models for their MV NMR-linked statistical chemometrics evaluation.
5. Conclusions
EAV SFOs have statistically significantly lower and higher average percentage contents of PUFAs and MUFAs, respectively, than those of commercially-available refined EU ones, and some of the products tested have values lying outside Standard Codex and Ugandan regulation ranges. However, an enhanced MUFA:PUFA content ratio indicates that these oils will be better suited for frying purposes. Statistically significant higher levels of ‘health-friendly’, cholesterol-blocking sterols and stanols were found in EAV SFO products, and this may serve as a clear marketing benefit for such products.
Ethical Approval
This article does not contain any investigations with human participants or experimental animals performed by any of the authors.
Acknowledgements
This research work was supported by the Supporting Indian Trade and Investment for Africa (SITA) Project, implemented by the International Trade Centre (UN-WTO), and funded by United Kingdom's Department for International Development (DFID). We are also grateful to Mariana Cavezza Vega, Aman Goel Jarmila Sarda Souckova and Hanna Bucher of the International Trade Centre, Geneva, Switzerland for valuable discussions. We also thank John Doddrell for providing useful advice. BP is very grateful to De Montfort University, Leicester, UK for the provision of a fees-waiver PhD Scholarship.
Tables & Figures
Figure 1. 0.75-6.10 ppm regions of the 1H NMR spectra of commercially-available refined (top, red) and East African virgin (bottom, blue) SFOs in C2HCl3 solution.
Download figure
| Chemical Shift (δ)/ppm | Multiplicity | Assignment Function | Molecular Assignment(s) | Major or Minor Molecular Species |
| 0.54 | s | C18-CH3 function/steroid | ∆7-Avenasterol | Minor |
| 0.685 | s | C18-CH3 function/ steroid | β-Sitosterol/Δ5-Campesterol | Minor |
| 0.705 | s | C18-CH3 function/ steroid | Δ5-Stigmasterol/Brassicasterol | Minor |
| 0.88 | t | -CH3 | Acylglycerol terminal-CH3: saturated, ω-7 and/or ω-9 MUFA functions | Major |
| 0.89 | t | -CH3 | Acylglycerol terminal-CH3: unsaturated ω-6 acyl groups | Major |
| 0.955 | t | -CH3 | Acylglycerol terminal-CH3: unsaturated ω-3 acyl groups | Major |
| 1.22-1.42 | m | -(CH2)n- | Acylglycerol bulk chain acyl groups (all acylglycerols) | Major |
| 1.52-1.66 | m | -OCO-CH2-CH2-/H2O | Acyglycerol acyl groups/H2O contaminant | Major |
| 1.67 | s | -CH3 | Squalene | Minor |
| 1.81 | m | 1H nucleus of the carbon α- to the lactone ring methine function 14* | γ-Stearolactone* 14 | Minor |
| 1.94-2.14 | m | -CH2-CH=CH- | Acyglycerol acyl groups | Major |
| 2.305 | dt | -OCO-CH2- | Acylglycerol acyl groups | Major |
| 2.765 | dd | -CH=CH-CH2-CH=CH- | Acylglycerol bis-allylic-CH2 group (ω-6 fatty acids) | Major |
| 2.80 | dd | -CH=CH-CH2- CH=CH- | Acylglycerol bis-allylic-CH2 group (ω-3 fatty acids) | Major |
| 3.35 | s | -N(CH3)3+ | Phosphatidylcholine | Minor |
| 3.54, 3.64 | dd (AB component of ABX system) | HOCH2 -H(OH)-CH2OH | Free glycerol 15 | Minor |
| 3.65 | ddd | RCO-OCH2-CHOH-CH2OH | sn-1-Monoacylglycerols 16 | Minor |
| 3.725 | m | RCO-OCH2-CH(OCOR’)-CH2OH | sn-1,2-Diacylglycerols 16 | Minor |
| 3.84 | m | HOCH2-CHOCOR-CH2OH | sn-2-Diacylglycerols 16 | Minor |
| 3.94 | m | RCO-OCH2-CHOH-CH2OH | sn-1-Monoacylglycerols 16 | Minor |
| 4.14, 4.30 | dd,dd | RCO-OCH2- CH(OR’)-CH2OCOR’’ | Acylglycerol C1,3-glyceryl backbone function | Major |
| 4.18 | ddd | RCO-OCH2-CHOH-CH2OH | sn-1-Monoacylglycerols 16 | Minor |
| 4.28 | ddd | RCO-OCH2-CH(O-COR’)-CH2OH | sn-1,2-Diacylglycerols 16 | Minor |
| 4.93 | m | HOCH2-CH(OCOR)-CH2OH | sn-2-Diacylglycerols 16 | Minor |
| 4.95-5.07 | dq,dq | -CH=CH2 | Unsaturated ω-1 fatty acid acyl groups | Minor |
| 5.08 | m | ROCOCH2-CH(OCOR’)-CH2OH | sn-1,2-Diacylglycerols 16 | Minor |
| 5.22-5.30 | m | >CHOCOR | Acylglycerol C2-glyceryl backbone function | Major |
| 5.30-5.47 | m | -CH=CH- | Acylglycerol acyl group vinylic protons | Major |
| 5.75-5.86 | m | -CH=CH2 | Unsaturated ω-1 fatty acid acyl groups | Minor |
| Oil Sample Group | Mean±SEM (95% CIs)Total SFAs (%) | Mean±SEM(95% CIs)Total MUFAs (%) | Mean±SEM(95% CIs)Total PUFAs (%) | Omega-3 Fatty Acids (% Linolenate) |
| East African VirginSFOs (n = 55) | 9.81±0.22 (95%CI 9.36-10.25%) | 39.78±0.57*(95% CI 38.63-40.93%) | 50.42±0.61*(95% CI 49.20-51.64%) | ≤ 0.20% |
| UK RefinedSFOs (n = 4) | 9.98±0.53 (95%CI 9.62-10.20%) | 31.31±0.62(95% CI 29.35-33.275%) | 58.61±0.69(95% CI 56.41-60.81%) | ≤ 0.20% |
| Codex Standards | 10.10%(expected value) | 14.00-39.40% | 48.30-74.00% | ≤ 0.20% |
| East African (Ugandan) Standards 17 | 6-20% | 14-35% | 55-75% | < 0.30% |
| ISB (ppm) | FDR-adjusted p value | Assignment | Difference observed | ROC key variable ranking |
| 0.66-0.69 | 6.54 x 10⁻⁴ | C18-CH3 β-Sitasterol/Δ-7-Camposterol (steroid functions) | EAV ↑ | > 20 |
| 0.69-0.75 | 2.61 x 10⁻³ | C18-CH3 Δ5-Stigmasterol/Brassicasterol (steroid functions) | EAV ↑ | >20 |
| 0.75-0.78 | 2.94 x 10⁻⁴ | Terminal-CH313C satellite | EAV ↑ | >20 |
| 0.78-0.80 | 9.97 x 10⁻⁶ | Terminal-CH313C satellite | EAV ↑ | >20 |
| 0.80-0.95 | 7.60 x 10⁻⁷ | Terminal-CH3, including its 13C satellite. | EAV ↑ | 4 |
| 1.00-1.02 | 1.51 x 10⁻³ | Bulk chain (-CH2-)n13C satellite | EAV ↑ | >20 |
| 1.02-1.06 | 9.46 x 10⁻³ | Bulk chain (-CH2-)n13C satellite | EAV ↑ | >20 |
| 1.06-1.08 | 8.63 x 10⁻⁴ | Bulk chain (-CH2-)n13C satellite | EAV ↑ | >20 |
| 1.08-1.10 | 4.27 x 10⁻⁴ | Bulk chain (-CH2-)n13C satellite | EAV ↑ | >20 |
| 1.10-1.13 | 1.89 x 10⁻⁴ | Bulk chain (-CH2-)n | EAV ↑ | >20 |
| 1.13-1.15 | 3.93 x 10⁻⁵ | Bulk chain (-CH2-)n | EAV ↑ | >20 |
| 1.15-1.17 | 9.35 x 10⁻⁶ | Bulk chain (-CH2-)n | EAV ↑ | >20 |
| 1.17-1.20 | 7.60 x 10⁻⁷ | Bulk chain (-CH2-)n | EAV ↑ | >20 |
| 1.20-1.22 | 2.94 x 10⁻⁶ | Bulk chain (-CH2-)n | EAV ↑ | 9 |
| 1.22-1.24 | 1.35 x 10⁻⁵ | Bulk chain (-CH2-)n | EAV ↑ | 11 |
| 1.24-1.29 | 9.35 x 10⁻⁶ | Bulk chain (-CH2-)n | EAV ↑ | 12 |
| 1.35-1.41 | 1.63 x 10⁻³ | Bulk chain (-CH2-)n13C satellite | Refined ↑ | >20 |
| 1.41-1.47 | ns | OCO-CH2-CH2- | EAV ↑ | 19 |
| 1.47-1.52 | ns | OCO-CH2-CH2- | EAV ↑ | 10 |
| 1.52-1.54 | ns | OCO-CH2-CH2- | EAV ↑ | 13 |
| 1.73-1.79 | 1.92 x 10⁻¹¹ | γ-Stearolactone-1H nucleus of the carbon α- to the lactone ring methine function 14* | Refined ↑ | 20 |
| 1.79-1.83 | 5.14 x 10⁻²⁴ | γ-Stearolactone-1H nucleus of the carbon α- to the lactone ring methine function 14* | Refined ↑ | 1 |
| 1.83-1.89 | 3.06 x 10⁻⁵ | γ-Stearolactone-1H nucleus of the carbon α- to the lactone ring methine function 14* | Refined ↑ | 8 |
| 1.95-1.97 | 4.66 x 10⁻³ | -CH2-CH=CH- | EAV ↑ | >20 |
| 1.97-2.03 | 6.20 x 10⁻⁴ | -CH2-CH=CH- | EAV ↑ | 15 |
| 2.03-2.09 | 4.61 x 10⁻⁴ | -CH2-CH=CH- | Refined ↑ | 14 |
| 2.13-2.19 | 1.91 x 10⁻³ | 13C satellite of -OCO-CH2- | EAV ↑ | 5 |
| 2.19-2.22 | 1.136 x 10⁻³ | 13C satellite of -OCO-CH2- | EAV ↑ | 3 |
| 2.24-2.28 | 1.126 x 10⁻² | -OCO-CH2- | EAV ↑ | >20 |
| 2.70-2.72 | 2.39 x 10⁻³ | -CH=CH-CH2-CH=CH- | Refined ↑ | 6 |
| 2.74-2.80 | 9.55 x 10⁻⁴ | -CH=CH-CH2-CH=CH- | Refined ↑ | >20 |
| 2.80-2.86 | 4.35 x 10⁻² | -CH=CH-CH2-CH=CH- | Refined ↑ | >20 |
| 4.09-4.11 | 3.11 x 10⁻² | RCO-OCH2-CH(OH)-CH2OCOR’ sn-1,3-Diacylglycerols | Refined ↑ | >20 |
| 4.13-4.19 | ns | -CH2OCOR (Glyceryl backbone function)/-CH2OH Glyceryl group in sn-1,3-diacylglycerols/sn-1-monoacylglycerols | Refined ↑ | 7 |
| 4.26-4.30 | 6.54 x 10⁻⁴ | -CH2OCOR Glyceryl backbone function in 1,2-diacylglycerols | EAV ↑ | 16 |
| 4.30-4.36 | ns | RCO-OCH2-CH(OCOR′)-CH2OH Glyceryl backbone group in 1,2-diacylglycerols | EAV ↑ | 17 |
| 4.36-4.41 | 3.17 x 10⁻⁴ | RCO-OCH2-CH(OCOR′)-CH2OH Glyceryl backbone group in 1,2-diacylglycerols | EAV ↑ | 2 |
| 5.30-5.36 | 1.32 x 10⁻² | -CH=CH- | Refined ↑ | >20 |
| 5.36-5.42 | 1.054 x 10⁻³ | -CH=CH- | Refined ↑ | 18 |
Figure 2. Expanded 1.54-2.00 and 1.35-2.00 ppm regions of the 1H NMR profiles of (a) EU-available refined, and (b) EAV SFO products respectively. The major 1.79-1.83 ppm ISB marker resonance for the refined SFO products is indicated in (a).
Download figure
Figure 3. PCA scores plot of PC2 versus PC1 for the 1H NMR spectral profile ISB dataset of EAV (blue) and refined, EU-available SFO products (red). The percentage contributions of each PC to the total model variance are provided in brackets for each axis label. Cluster centroids for each SFO classification are indicated in black.
Download figure
Figure 4. (a) ROC curve (plot of true positive vs. false positive rates) with an AUROC value of 0.997 obtained from the SVM model building system explored with 20 out of a possible 78 SFO sample ISB variables. ROC curves were developed via Monte Carlo Cross-Validation (MCCV) involving a balanced sub-sampling processes involving application of an SVM model builder (CSN-normalised dataset). The inset shows mean AUROC values estimated for increasing sampling sizes, together with 95% CIs for these values.
Download figure
Figure 4. (b) Probability view arising from a balanced sub-sampling approach for SVM model training (predicted class probabilities for each sample employed the most effective AUC-based classification system).
Download figure
Figure 5. Three-dimensional (3D) PLS-DA scores plot of component 3 versus component 2 versus component 1; these components accounted for 8.4, 12.3 and 24.3% of the total dataset variation, respectively. This plot shows clearly distinctive clusterings for the EAV and refined EU-purchased SFO sample study classifications. The differences observed are attributable to those between the first two component sample scores vectors, predominantly significantly lower component 1 and component 2 scores vectors for the natural EAV SFO product classification than those of the EU refined sample group.
Download figure
Figure 6. Agglomerative hierarchal clustering (AHC) analysis of the sunflower oil dataset. Colour codes: Red, EAV SFO samples; green, refined EU-purchased SFO samples. Numerical codes were randomly assigned for each SFO classification.
Download figure
References
- 1.Connor D J, Hall A J. (1997) Sunflower physiology. In:. Sunflower technology and production. Agronomy Monograph No 35 Schneiter, A.A. (Ed.) , ASA, CSSA, SSSA, Madison, Wisconsin 113-182.
- 2.Hall A J. (2004) Advances in the physiology of the sunflower crop: a ten year progress report. Proc. 16th International Sunflower Conference , Fargo, North 1, 2941.
- 3.Grunvald A G, CL Portela de Carvalho, Santos Leite R, Mandarino J M. (2013) Influence of Temperature on the Fatty Acid Composition of the Oil From Sunflower Genotypes Grown in Tropical Regions. , Journal of the American Oil Chemists' Society 90, 10-1007.
- 4.Pal U S, Patra R K, Sahoo N R, Bakhara C K, Panda M K. (2014) Effect of refining on quality and composition of sunflower oil. , Journal of Food Science and Technology 52(7), 4613-4618.
- 5.MIV Brevedan, Carelli A A, Crapiste G H. (2000) Changes in composition and quality of sunflower oils during extraction and degumming. , Grasas y Aceites 51(6), 417-423.
- 6.National Research Council. (1988) Committee on Technological Options to Improve the Nutritional Attributes of Animal Products. (DC): National Academies Press (US);4, Consumer Concerns and Animal Product Options, Available from: https://www.ncbi.nlm.nih.gov/books/NBK218169/ , Washington .
- 7.Grootveld M, Silwood C, Addis P B, AWD Claxson, Bonet Serra B. (2001) Health effects of oxidised heated oils. , Foodservice Research International 13, 41-55.
- 8.CJL Silwood, Grootveld M. (1999) Application of high-resolution two-dimensional 1H and 13C nuclear magnetic resonance techniques to the characterization of lipid oxidation products in autoxidized linoleoyl/linolenoyglycerols. , Lipids 34, 741-756.
- 9.Haywood R M, Claxson A W, Hawkes G E, Richardson D P, Naughton D P. (1995) Detection of aldehydes and their conjugated hydroperoxydiene precursors in thermally-stressed culinary oils and fats: investigations using high resolution proton NMR spectroscopy. , Free Radical Research 22, 441-82.
- 10.AWD Claxson, Hawkes G E, Richardson D P, Naughton D P, Haywood R M. (1994) Generation of lipid peroxidation products in culinary oils and fats during episodes of thermal stressing: a high field 1H NMR study. , FEBS Letters 355, 81-90.
- 11.Moumtaz S, Percival B C, Parmar D, Grootveld K L, Jansson P. (2019) Toxic aldehyde generation in and food uptake from culinary oils during frying practices: peroxidative resistance of a monounsaturate-rich algae oil. Nature Scientific Reports. (in press)
- 12.Martınez-Yusta A, Goicoechea E, Guillen M D. (2014) A Review of thermo-oxidative degradation of food lipids studied by 1H NMR spectroscopy: influence of degradative conditions and food lipid nature. Comprehensive Rev. Food Sci. Food Safety. 13, 838-859.
- 13.Cortinas L, Galobart J, Barroeta A C, Baucells M D, Grashorn M A. (2003) Change in α-tocopherol contents, lipid oxidation and fatty acid profile in eggs enriched with linolenic acid or very long chain w-3 polyunsaturated fatty acids after different processing methods. , Journal of Science Food and Agriculture 83, 820-829.
- 14.Knothe G. (2017) Some miscellaneous fatty acids. 1HNMR analysis of fatty acids and their derivatives. Lactones, AOCS Lipid Library 2017,Jun,20 .
- 15.Siddiqui N, Sim J, CJL Silwood, Toms H, Iles R A. (2003) Multicomponent analysis of encapsulated marine oil supplements using high resolution 1H and 13C NMR nuclear magnetic resonance (NMR) techniques. , Journal of Lipid Research 44, 2406-2427.
- 16.Nieva-Echevarría B, Goicoechea E, Manzanos M J, Guillén M D. (2014) A method based on 1H NMR spectral data useful to evaluate the hydrolysis level in complex lipid mixtures. ISSN 0963-9969, https://doi.org/10.1016/j.foodres.2014.09.031. (http://www.sciencedirect.com/science/article/pii/S0963996914006310) , Food Research International 66, 379-387.
- 17.STANDARD FINAL DRAFT UGANDA.. FDUS EAS 299, First Edition, 2013-mm-dd Edible Sunflower Oil – Specification .
- 18.Sacchi R, Addeo F, Paolillo L. (1997) 1H and 13C NMR of virgin olive oil. An overview. , Magnetic Resonance in Chemistry 35, 133-145.
- 19.Hanley J A, McNeil B J. (1982) The meaning and use of the area under a receiver operating characteristic (ROC) curve. , Radiology 143, 29-36.
- 20.Shepherd I S, Showell J S. (1969) The mechanism of the aqueous perchloric acid isomerization of oleic acid to γ-stearolactone. , Journal of the American Oil Chemists' Society, DOI: 46(9), 479-481.
- 21.Perez-Jimenez F, Lopez-Miranda J, Mata P. (2002) Protective effect of dietary monounsaturated fat on arteriosclerosis: beyond cholesterol. , Atherosclerosis 163, 385-398.
- 22.Law M R. (2000) Plant sterol and stanol margarines and health. , Western Journal of 173(1), 43-47.
- 23.Tasan M, Demirci M. (2005) Total and individual tocopherol contents of sunflower oil at different steps of refining. , European Food Research Technology 220(3), 251-254.
- 24.Kris-Etherton P M, Yu S. (1997) Individual fatty acid effects on plasma lipids and lipoproteins: human studies. , American Journal of Clinical Nutrition 65, 1628-1644.
- 25.Grootveld M, Percival B C, Grootveld K L. (2018) Chronic non-communicable disease risks presented by lipid oxidation products in fried foods. , HepatoBiliary Surgery and Nutrition 7(4), 305-312.
- 26.Grootveld M, Atherton M D, Sheerin A N, Hawkes J, Blake D R. (1998) In vivo absorption, metabolism, and urinary excretion of alpha,beta-unsaturated aldehydes in experimental animals. Relevance to the development of cardiovascular diseases by the dietary ingestion of thermally stressed polyunsaturate-rich culinary oils. , Journal of Clinical Investigation 101, 1210-1218.
Cited by (10)
This article has been cited by 10 scholarly works according to:
Citing Articles:
Food Research International (2025) OpenAlex Crossref Semantic Scholar
Food Safety and Health (2024) OpenAlex
Journal of Food Composition and Analysis (2024) Crossref OpenAlex Semantic Scholar
G. Ampem, A. Le Gresley, M. Grootveld, D. Naughton - Journal of Food and Drug Analysis (2023) Semantic Scholar
Journal of Food and Drug Analysis (2023) OpenAlex
Foods (2023) OpenAlex Crossref Semantic Scholar
Foods (2022) OpenAlex Crossref Semantic Scholar
Applied Sciences (2021) OpenAlex Crossref Semantic Scholar
Foods (2021) OpenAlex Crossref Semantic Scholar
Frontiers in Nutrition (2021) OpenAlex Crossref Semantic Scholar