
Abstract
Objectives:
To measure the horizontal inequity in the uptake of hospital delivery and quantify the contribution of various social determinants of health (SDH) to such inequity in China from 1993-2008
Methods:
With four national representative surveys in China conducted in 1993, 1998, 2003 and 2008, we measured horizontal inequity in the uptake of hospital delivery using indirect standardized concentration indices (CIs). By decomposing Cis into components, we explored the contributions of income, health insurance, education, living conditions to such inequities. Oaxaca type decomposition was further used to explain the role for each SDH on the changes of inequities between 1993 and 2008.
Results:
We found that horizontal inequity in the coverage of hospital delivery approached equal line in the urban areas and shrank by 90% in rural China in 1993-2008. The data also showed that dramatic socio-economic achievement was made across the 16 years, including education, income, health insurance and living conditions, which contributed substantially to the reduction of the inequities in the uptake of hospital delivery. Income’s contribution was mainly made by its protection effect, while health insurance’s role was mainly played by its equal distributions in the rural areas.
Conclusions:
The horizontal inequity in the uptake of hospital births vanished in urban China and decreased in the rural. The leading contributors to such inequity were income, health insurance, living conditions and education. Decomposition analysis suggests that more investments are warranted for financial risk protection and targeted demand side subsidies may make a difference.
Author Contributions
Academic Editor: Serap Simavli, Pamukkale University School of Medicine, Department of Obstetrics and Gynecology, Denizli, Turkey
Checked for plagiarism: Yes
Review by: Single-blind
Copyright © 2016 Xing Lin Feng, et al.
 This is an open-access article distributed under the terms of the Creative Commons Attribution License, which permits unrestricted use, distribution, and reproduction in any medium, provided the original author and source are credited.
Competing interests
The authors have declared that no competing interests exist.
Citation:
Introduction
The widely cited concept of health equity is: “Equity refers to differences that are unnecessary or reducible and are unfair and unjust” 1 . Analyses on health care inequity were focused on the achievement of horizontal inequity, defined as “equal treatment for equal medical need, irrespective of other characteristics such as income, race, place of residence, etc 2.” A medicalized “downstream” paradigm focusing on risk factors was dominated 3 regarding the relationship between diseases and their determinants. More recently, however, an emerging revitalization of a broader perspective on “upstream factors” that determine population health and its potential value in helping solve health problems has gained traction 4. This perspective focuses on factors such as cultural and social structures, socioeconomic status in one’s family of birth and throughout the life course, and social and environmental factors, typically described as social determinants of health (SDH) 5, 6, 7. The March 2005 launch of the World Health Organization’s Commission on Social Determinants of Health8 is a milestone of the recognition that there needs to be greater focus on those upstream determinants, followed by the Rio declaration9 in reflecting a commitment among global health leaders to promote related policy actions.
China has made great success in reducing maternal and neonatal mortality, which has been attributed to the national hospital delivery strategy 10, 11. In 1988 less than half of all women gave birth in hospital, yet twenty years later hospital births have become nearly universal, with the disparities shrank sharply between the poor and rich 12. The effects of other various SDHs are also reported. For example, Xue et.al 13 and Wang et al 14 found that knowledge, culture, physical accessibility, education and parity were all correlated with the utilization of maternal health care in China, while Long et.al 15 reported rising utilization of institutional delivery after the launch of the Chinese New Cooperative Medical Scheme (NCMS). Say & Raine 16 made a systematic review on inequalities of maternal health care in developing countries, where age, education, medical insurance, clinical risk factors, distance of facility was found to be correlated with the uptake of care. However, none research has been performed to quantify the horizontal inequity for coverage of such care, nor did they analyse the contribution of various SDHs on the potential inequities in a unified framework.
With four national representative surveys in China conducted in 1993, 1998, 2003 and 2008, in this article we measured the horizontal inequity in the uptake of hospital delivery in China during the past two decades using indirect standardized concentration indices (CIs). By decomposing CIs to various SDHs, we explored the contribution of income, health insurance, education, living conditions to such inequities. Oaxaca type decomposition technique was further used to explain the role for each SDH on the changes of inequities of hospital birth over the past 16 years.
Methods
We used secondary data from four cross-sectional National Health Service Surveys (NHSS) conducted in urban and rural China in 1993, 1998, 2003 and 2008. Each survey used the same sample of villages as those selected in the 1993 survey, with some minor modifications over time. The 1993 survey used four-stage stratified cluster random sampling to select households. Each survey sampled a similar number of cities/counties according to their development strata (92, 95, 95 and 94 in the 1993, 1998, 2003 and 2008 surveys respectively) 17. Within each city/county five districts/townships were sampled, and two villages within each district/township. Sixty households were randomly selected from each village. The total number of households sampled was 54,984, 56,994, 57,023, and 56,456 for each survey respectively.
All four surveys used locally trained health personnel to interview households using a structured questionnaire. One section in the questionnaire provided information on characteristics of pregnancies preceding the survey. All women were asked the outcome of her pregnancy/delivery and where the birth had taken place. The recall period was 3-5 years per survey. To make consistent comparison, in this analysis we constrained the population to women who had live births in no more than 3 years. The outcome of interest was births in hospital (defined as births in township, county (including MCH care centres), provincial or national hospitals) 18.
The questionnaires included a comprehensive list of socio-demographic indicators. To capture various constructs measuring socio-economic determinants comprehensively, we selected the following eleven for this analysis: the household’s annual income, the woman’s educational attainment, whether the women were employed, women’s maritus status, whether the woman is a Han Majority, access to clean water, access to hygienic toilet, access to health insurance, access to health information from the society, household’s average housing squares, and traffic time to the nearest health care centres. We included the following indicators to standardize women’s health needs: age, gravidities, parities, and whether the women had any chronic conditions.
Hospital delivery rate is defined as proportion of live births delivered in hospitals. To measure the horizontal inequity of hospital delivery, we calculated its needs standardized Concentration Index (CI) 19, 20. The analysis was stratified by urban /rural typologies due to the dual nature of China’s urban/rural social and political systems. CI is calculated as  ….(1)
….(1)
where Y is health indicator (hospital delivery here) for the calculation of CI, µY is the mean of Y, R is the cumulative rank proportion according to individual’s socio-economic status (income is used to for Parato efficiency as usual). To take into consideration of household economies of scale, income equivalence scales were used 21:
 ….(2)
….(2)
where Zh is the adult equivalent income for household h, nAand nC are number of adults and children for this household. We adopt ɸ = 0.5 and Indirect θ = 0.5 standardization for CI, the measure of horizontal inequity, was conducted to get inequalities amongst women with the same needs 22, 23. A regression
 …(3)
…(3)
is firstly carried out and the needs standardized Y is defined as
 …(4)
…(4)
Where
 …(5)
…(5)
 …(6)
…(6)
CI of Yis is the measure of horizontal inequity for Y, X is a matrix for various SDHs concerned, and Z is a matrix standing by health needs indicators. Since uptake of hospital delivery is a dichotomous variable, logit models were performed to estimate item (3), where
 …(7)
…(7)
is used to estimate (4) (5) and (6) and is the cumulative normal distribution function.
To measure the contribution of each SDH to the horizontal inequity of hospital delivery, the needs standardized CI is decomposed 24, 25, 26, 27 as
 …(8)
…(8)
where C is the CI for Y, Ck is the CI of xk and
 ….(9)
….(9)
is CI of the error term. According to equation (8), the k’s SDH’s contribution to the CI of Y is the multiplication of its own CI and the elasticity of it on Y. Such a technique allows us to explain that how much of the inequities in hospital delivery could be accounted for by various SDHs after standardizing health needs. Further, we used the Oaxaca type decomposition technique 27 to explain that how the changes of inequities could be explained by the changes of various SDHs as shown in Equation (10).
 ….(10)
where the foot label k represent the k’s SDH, t and t-1 stands by the two elapsed periods for comparison.
 …(11)
…(11)
is the elasticity of xk to Y. By such decomposition we could partial out effects of the inequity in SDH and the effect of SDH on the inequity of Y, i.e. to answer that how much the change of Y’s inequality over time could be explained as the inequality of each SDH per se, versus their protecting (damaging) effect on the inequity of Y respectively.
Non-linear models and the decomposition techniques require the projection linearly additive, for which we used the mean partial effects 28 as a linear approximation for (7) 29. All the analyses were made using StataSE 9.2 and the “svy” sets of commands were used to take into account the sampling stratification and cluster effects.
Results
As Table 1 presents, uptake of hospital delivery increased dramatically during 1993-2008, particularly in rural China. In the year 1993, only 28% rural women delivered their baby in hospitals, while in the year 2008 the coverage almost approached universal. During the past two decades, socio-economic changes were also enormous, especially in the rural areas. In 1993, 25% of the rural mothers were illiterate, while till 2008 the proportion reduced sharply to only 7%. While in urban areas, achievement was mainly made by the increasing of secondary and above education with 17% increase in the two decades. Urban mothers tended to be unemployed comparing with their rural counterpart, where the employment rates decreased about 16% during 1993-2008. Unmarried mothers seemed to be uncommon in China according to the survey and the ethnicity compositions are quite stable, suggesting reliability of the data. Hygienic situation improved greatly in rural China, where access to clear water were double folded from 49% to 86% during 1993-2008, and access to hygienic toilet increased from only 4% to 42%. Average housing squares doubled in both urban and rural China and income per capita increased by 6-7 times. In the year 1993, only 11% rural mothers had health insurance, but till 2008, the coverage increased to more than 90%, 9 times of those in 1993.
Table 1. Trends in uptake of hospital delivery and socioeconomic factors amongst the surveyed women with delivery history within 3 years by urban/rural typology (1993-2008)| 1993 | 1998 | 2003 | 2008 | |||||
| Mean | Std. | Mean | Std. | Mean | Std. | Mean | Std. | |
| Hospital Delivery (1 Yes 0 No) | ||||||||
| urban | 0.91 | 0.01 | 0.94 | 0.01 | 0.94 | 0.01 | 0.96 | 0.01 |
| rural | 0.28 | 0.00 | 0.44 | 0.01 | 0.68 | 0.01 | 0.90 | 0.00 |
| Education-illiteracy | ||||||||
| urban | 0.06 | 0.01 | 0.04 | 0.01 | 0.03 | 0.00 | 0.02 | 0.00 |
| rural | 0.25 | 0.00 | 0.18 | 0.01 | 0.12 | 0.00 | 0.07 | 0.00 |
| Education-primary | ||||||||
| urban | 0.46 | 0.01 | 0.43 | 0.02 | 0.38 | 0.01 | 0.34 | 0.01 |
| rural | 0.70 | 0.00 | 0.77 | 0.01 | 0.81 | 0.01 | 0.83 | 0.01 |
| Education-secondary and above | ||||||||
| urban | 0.47 | 0.01 | 0.52 | 0.02 | 0.59 | 0.01 | 0.64 | 0.01 |
| rural | 0.05 | 0.00 | 0.05 | 0.00 | 0.07 | 0.00 | 0.10 | 0.00 |
| Employment( 1 Yes 0 No) | ||||||||
| urban | 0.79 | 0.01 | 0.69 | 0.02 | 0.63 | 0.01 | 0.63 | 0.01 |
| rural | 0.88 | 0.00 | 0.97 | 0.00 | 0.97 | 0.00 | 0.90 | 0.00 |
| Married (1 Yes 0 No) | ||||||||
| urban | 0.99 | 0.00 | 0.97 | 0.01 | 0.99 | 0.00 | 0.99 | 0.00 |
| rural | 0.99 | 0.00 | 0.98 | 0.00 | 0.99 | 0.00 | 0.99 | 0.00 |
| Majority ethnicity (1 Yes 0 No) | ||||||||
| urban | 0.89 | 0.01 | 0.90 | 0.01 | ||||
| rural | 0.77 | 0.01 | 0.79 | 0.01 | ||||
| Access to clean water (1 Yes 0 No) | ||||||||
| urban | 0.95 | 0.01 | 0.97 | 0.01 | 0.99 | 0.00 | 0.98 | 0.00 |
| rural | 0.49 | 0.01 | 0.52 | 0.01 | 0.75 | 0.01 | 0.86 | 0.00 |
| Access to hygienic toilet (1 Yes 0 No) | ||||||||
| urban | 0.65 | 0.01 | 0.68 | 0.02 | 0.88 | 0.01 | 0.94 | 0.01 |
| rural | 0.04 | 0.00 | 0.06 | 0.00 | 0.18 | 0.01 | 0.42 | 0.01 |
| Access to health information from society (1 Yes 0 No) | ||||||||
| urban | 0.90 | 0.01 | 0.98 | 0.00 | ||||
| rural | 0.80 | 0.01 | 0.96 | 0.00 | ||||
| Average housing squares | ||||||||
| urban | 10.95 | 0.22 | 12.56 | 0.37 | 19.60 | 0.34 | 22.69 | 0.44 |
| rural | 15.09 | 0.11 | 13.54 | 0.17 | 24.82 | 0.23 | 27.78 | 0.26 |
| Income per capita | ||||||||
| urban | 1,710.77 | 31.97 | 4,304.99 | 152.09 | 6,135.58 | 240.72 | 10,862.09 | 461.12 |
| rural | 630.25 | 6.28 | 1,666.60 | 23.83 | 1,834.45 | 24.42 | 4,394.49 | 68.01 |
| Health insurance (1 Yes 0 No) | ||||||||
| urban | 0.65 | 0.01 | 0.46 | 0.02 | 0.47 | 0.01 | 0.65 | 0.01 |
| rural | 0.11 | 0.00 | 0.07 | 0.00 | 0.13 | 0.00 | 0.92 | 0.00 |
| Time to nearest health facilities | ||||||||
| urban | 13.22 | 0.17 | 9.60 | 0.35 | 9.58 | 0.22 | 9.16 | 0.17 |
| rural | 15.35 | 0.12 | 14.72 | 0.30 | 14.45 | 0.28 | 13.12 | 0.21 |
| age | ||||||||
| urban | 27.95 | 0.10 | 27.85 | 0.18 | 28.88 | 0.12 | 29.35 | 0.13 |
| rural | 27.24 | 0.05 | 27.05 | 0.12 | 27.81 | 0.07 | 28.36 | 0.08 |
| gravidity | ||||||||
| urban | 1.63 | 0.03 | 1.33 | 0.03 | 1.34 | 0.02 | 1.59 | 0.03 |
| rural | 2.33 | 0.02 | 1.65 | 0.02 | 1.66 | 0.02 | 1.86 | 0.01 |
| parity | ||||||||
| urban | 1.26 | 0.02 | 1.12 | 0.02 | 1.14 | 0.01 | 1.19 | 0.01 |
| rural | 2.07 | 0.01 | 1.51 | 0.02 | 1.57 | 0.01 | 1.56 | 0.01 |
| chronic disease (1 Yes 0 No) | ||||||||
| urban | 0.07 | 0.01 | 0.05 | 0.01 | 0.03 | 0.01 | 0.02 | 0.00 |
| rural | 0.09 | 0.00 | 0.06 | 0.00 | 0.04 | 0.00 | 0.05 | 0.00 |
| No.of women with latest live birth <=3 years | ||||||||
| urban | 1,761 | 702 | 1,236 | 1,142 | ||||
| rural | 8,825 | 3,276 | 5,075 | 4,911 | ||||
| No. of total respondents | ||||||||
| urban | 53,916 | 54,558 | 49,698 | 46,510 | ||||
| rural | 160,320 | 161,573 | 143,991 | 130,991 |
After standardizing age, parity, gravidity, their quadratic form and chronic conditions, we calculated CIs of hospital delivery in the four surveys as shown in (Figure 1 and Figure 2). The trends of the horizontal inequities in hospital delivery were thus depicted for analysis, since health needs were standardized. As (Figure 1) show, inequities in hospital delivery decreased greatly during 1993-2008 in rural China, with the concentration indices deceased near 90% (from 0.1877 in 1993 to 0.0217 in 2008, CIs for 1998 and 2003 are 0.121 and 0.079 respectively); While in the urban areas, standardized concentration curves for hospital delivery were nearly approaching the equal line with the CI of only 0.0017 in 2008 (Figure 2).
Figure 1.Standardized Concentration Curves for Utilization of Hospital Delivery in Rural China (1993-2008)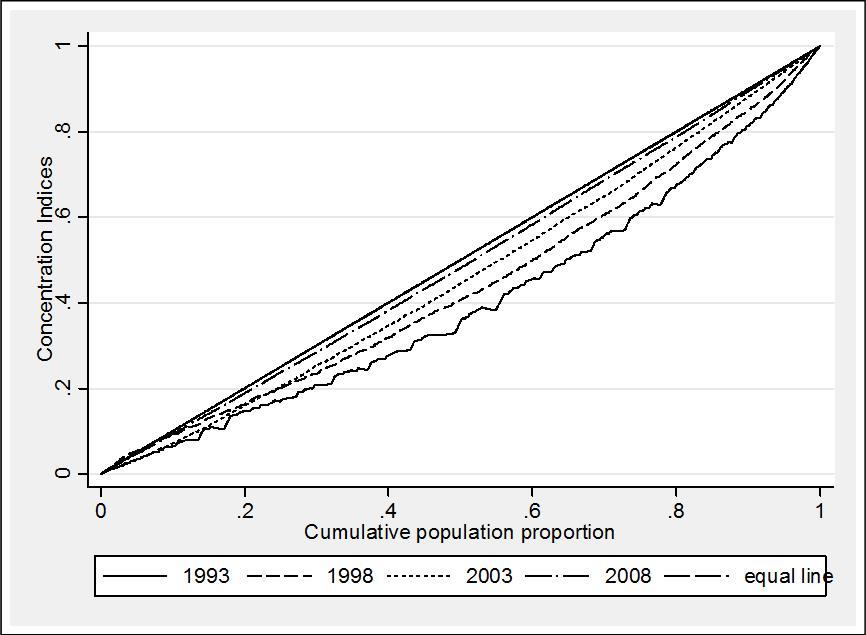
Figure 2.Standardized Concentration Curves for Utilization of Hospital Delivery in Urban China (1993-2008)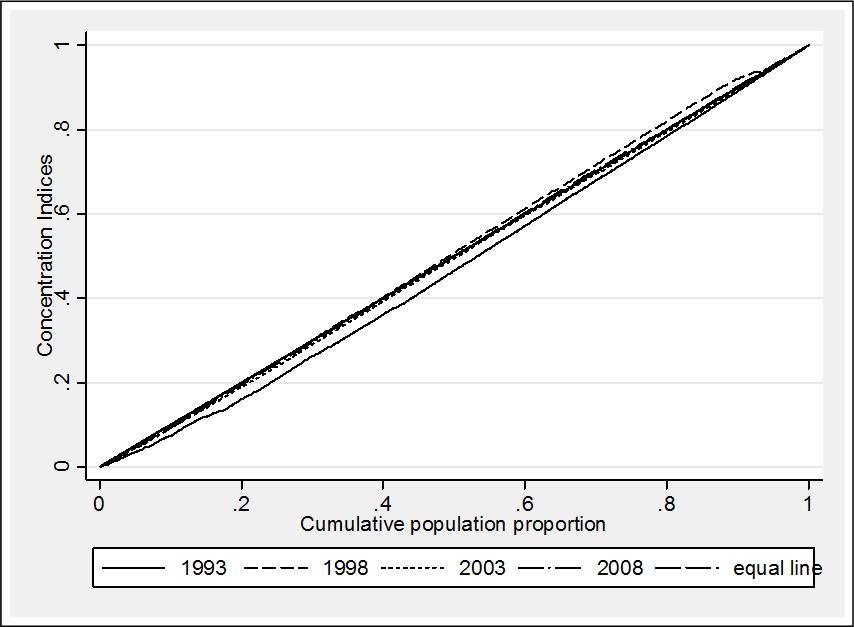
Since the Concentration Curves show consistent converging patterns for the four surveys, we only illustrate the results of year 1993 and 2008 in the decomposition exercises for brevity. As shown in (Table 2 and Table 3) are the contributions of various SDHs to the CI of hospital delivery by rural/urban typology. Income was the leading contributor to the CI for both urban and rural areas, where in rural areas income accounted for more than 50% of the inequities (57.09% and 59.47% in 1993 and 2008 respectively). While in the urban areas, the contribution of income was much smaller, and interestingly it contributed negatively to CI, i.e. inequities of hospital delivery, in 2008. However, it is not a surprise should we remind the urban CI in 2008 is almost 0.
Table 2. Cross-sectional Decomposition of CI for Rural Mothers, 1993 and 2008| CI | Elasticity | Contribution | Contribution% | |||||
| 1993 | 2008 | 1993 | 2008 | 1993 | 2008 | 1993 | 2008 | |
| Education-primary (illiteracy as reference group) | 0.067 | -0.012 | 0.101 | 0.068 | 0.007 | -0.001 | 3.63 | -3.76 |
| Education-secondary and above (illiteracy as reference group) | 0.333 | 0.246 | 0.017 | 0.007 | 0.006 | 0.002 | 3.06 | 7.67 |
| Employment (1 Yes 0 No) | -0.001 | -0.005 | 0.009 | -0.011 | 0.000 | 0.000 | 0.00 | 0.25 |
| Married (1 Yes 0 No) | 0.001 | 0.001 | 0.058 | -0.035 | 0.000 | 0.000 | 0.05 | -0.16 |
| Major ethnicity (1 Yes 0 No) | 0.037 | 0.101 | 0.004 | 17.33 | ||||
| Access to clean water (1 Yes 0 No) | 0.085 | 0.020 | 0.183 | 0.031 | 0.016 | 0.001 | 8.31 | 2.86 |
| Access to hygienic toilet (1 Yes 0 No) | 0.443 | 0.146 | 0.026 | 0.011 | 0.012 | 0.002 | 6.20 | 7.23 |
| Access to health information from society (1 Yes 0 No) | 0.003 | 0.037 | 0.000 | 0.55 | ||||
| Health insurance (1 Yes 0 No) | 0.481 | -0.007 | 0.058 | 0.045 | 0.028 | 0.000 | 15.00 | -1.40 |
| Average housing squares | 0.071 | 0.087 | 0.098 | -0.020 | 0.007 | -0.002 | 3.69 | -8.18 |
| logarithm income per capita | 0.053 | 0.031 | 2.036 | 0.412 | 0.107 | 0.013 | 57.09 | 59.47 |
| Time to nearest health facilities | -0.022 | -0.086 | 0.024 | -0.006 | -0.001 | 0.001 | -0.28 | 2.34 |
| Residual | 0.006 | 0.003 | 3.26 | 15.80 | ||||
| Total | 0.188 | 0.022 | 100.00 | 100.00 | ||||
| CI | Elasticity | Contribution | Contribution% | |||||
| 1993 | 2008 | 1993 | 2008 | 1993 | 2008 | 1993 | 2008 | |
| Education-primary (illiteracy as reference group) | -0.066 | -0.268 | -0.010 | 0.012 | 0.001 | -0.003 | 0.34 | -14.97 |
| Education-secondary and above (illiteracy as reference group) | 0.111 | 0.004 | 0.007 | 0.009 | 0.001 | 0.000 | 0.41 | 0.18 |
| Employment (1 Yes 0 No) | 0.057 | 0.107 | 0.004 | 0.013 | 0.000 | 0.001 | 0.12 | 6.21 |
| Married (1 Yes 0 No) | -0.001 | 0.003 | -0.004 | 0.030 | 0.000 | 0.000 | 0.00 | 0.42 |
| Major ethnicity (1 Yes 0 No) | 0.008 | 0.017 | 0.000 | 0.61 | ||||
| Access to hygienic toilet (1 Yes 0 No) | 0.034 | 0.012 | 0.163 | 0.152 | 0.006 | 0.002 | 2.93 | 8.35 |
| Access to hygienic toilet(1 Yes 0 No) | 0.177 | 0.030 | 0.021 | 0.079 | 0.004 | 0.002 | 1.97 | 10.94 |
| Access to health information from society (1 Yes 0 No) | 0.004 | 0.029 | 0.000 | 0.50 | ||||
| Health insurance (1 Yes 0 No) | 0.139 | 0.101 | 0.043 | -0.007 | 0.006 | -0.001 | 3.22 | -3.17 |
| Average housing squares | 0.033 | 0.062 | -0.016 | -0.006 | -0.001 | 0.000 | -0.28 | -1.62 |
| logarithm income per capita | 0.042 | 0.035 | 0.346 | -0.070 | 0.015 | -0.002 | 7.75 | -11.47 |
| Time to nearest health facilities | -0.029 | -0.028 | -0.020 | 0.007 | 0.001 | 0.000 | 0.31 | -0.95 |
| Residual | 0.018 | 0.003 | 9.39 | 12.58 | ||||
| Total | 0.049 | 0.002 | 26.15 | 7.61 | ||||
The contributions of other factors varied across the urban/rural typology. In rural areas, the second leading contribution to CI was made by health insurance, which also showed great variations across the decades. In 1993, health insurance contributed to 15% to CI which was much pro-rich while in 2008 it reduced sharply to -1.4% which was slightly pro-poor. The third largest contributions were made by the two hygiene indicators (accounted for around 10-15% to CIs). Education contributed 6-7% to CIs while the role of primary education reversed by comparing 1993 with 2008 (from 3.63% to -3.76%).In urban areas, the second leading contributions to CI were made by the two hygiene factors. And the role of health insurance showed similar patterns like the rural counterpart (3.22% to -3.17% in 1993 and 2008). For both of the two models, more than 80% of the variations in CIs were explained with only 3.26-15.8% left in the residuals.
Table 4. Contribution of SDH to the Changes of Inequities Overtime, 1993 and 2008| Rural | Urban | |||||||||||
| △ Cη | C △ η | Total | △ C% | △ η% | Total% | △ Cη | C △ η | Total | △ C% | △ η% | Total% | |
| Education-primary | -0.005 | 0.000 | -0.005 | 4.90 | -0.36 | 4.55 | -0.002 | -0.006 | -0.008 | 4.45 | 10.59 | 15.04 |
| Education-secondary and above | -0.001 | -0.003 | -0.003 | 0.53 | 2.33 | 2.87 | -0.001 | 0.000 | -0.001 | 1.67 | -0.01 | 1.65 |
| Employment (1 Yes 0 No) | 0.000 | 0.000 | 0.000 | -0.04 | -0.09 | -0.13 | 0.001 | 0.001 | 0.002 | -1.14 | -1.69 | -2.83 |
| Married (1 Yes 0 No) | 0.000 | 0.000 | 0.000 | -0.02 | 0.08 | 0.07 | 0.000 | 0.000 | 0.000 | -0.20 | -0.19 | -0.39 |
| Access to clean water (1 Yes 0 No) | -0.002 | -0.003 | -0.005 | 1.80 | 2.80 | 4.60 | -0.003 | 0.000 | -0.003 | 6.09 | 0.22 | 6.31 |
| Access to hygienic toilet (1 Yes 0 No) | -0.003 | -0.002 | -0.005 | 2.88 | 2.06 | 4.95 | -0.012 | 0.002 | -0.010 | 21.16 | -3.18 | 17.99 |
| Health insurance (1 Yes 0 No) | -0.022 | 0.000 | -0.022 | 19.70 | -0.09 | 19.61 | 0.000 | -0.005 | -0.005 | -0.47 | 9.24 | 8.77 |
| Average housing squares | 0.000 | -0.010 | -0.011 | 0.31 | 9.37 | 9.68 | 0.000 | 0.001 | 0.000 | 0.29 | -1.16 | -0.86 |
| logarithm income per capita | -0.009 | -0.051 | -0.060 | 7.98 | 46.10 | 54.07 | 0.000 | -0.015 | -0.014 | -0.86 | 26.75 | 25.89 |
| Time to nearest health facilities | 0.000 | 0.003 | 0.003 | -0.35 | -2.36 | -2.70 | 0.000 | -0.001 | -0.001 | -0.01 | 1.39 | 1.38 |
| Residual | -0.003 | 2.44 | -0.015 | 0.00 | 0.00 | 27.06 | ||||||
| Total | -0.110 | 37.70 | 59.86 | 100.00 | -0.055 | 0.00 | 0.00 | 100.00 | ||||
Table 4 show the results of the Oaxaca type inter-temporal decomposition. Irrespective of rural and urban typology, income explains the highest proportions of changes (54.07% and 35.89%) in CIs for hospital delivery during 1993-2008. The over period decomposition also shows that the contribution of income to the CI of hospital delivery were mostly due to its protection effects rather than its own disproportional distribution among the poor, for only 7.98% and -0.86% are accounted by the changes in the CI of income, while 46.10% and 26.75% are due to income’s protection effects. The effects of health insurance corroborated the findings in Table 2 and Table 3, but interestingly we could observe that its role were different by rural/urban typology. In rural areas, the decrease of unequal distribution in health insurance coverage accounted for 19.70% of the decrease of inequities in hospital delivery, while the protection effect of health insurance per se only accounted for -0.09% of the variations; Whilst in the urban areas, the role of health insurance were mainly due to its protection effect (9.24%) rather than its more equal access (-0.47%). The role of education also varies across rural/urban areas. In the rural areas, the contribution to the decrease of CI were mainly made by the more equal distribution of primary education(4.9%); whilst in the urban areas, the protection effects of primary education accounted more than its distribution per se ( 10.59% VS 4.45%).
Discussion
Using four cross sectional national data from 1993 to 2008, in this paper we found that great improvement was made in improving the coverage of hospital delivery in China during the past decade. Rural China experienced most of the success, with the proportion of women delivering their baby in hospitals tripled and achieving near 100% till 2008. As measured by the concentration indices, horizontal inequity shrank dramatically by 90% in the rural areas; whilst in the urban areas, the uptake of care almost approached equal line irrespective of women’s socio-economic status. The data also showed that dramatic socio-economic achievement was made in China across the 16 years. Most strikingly income equivalent increased more than 6 times, illiteracy decreased near 4 times, hygiene increased 10 times and health insurance coverage increased by 9 times to near universal coverage, particularly for the rural.
We found that most of the inequity in hospital delivery coverage could be explained by household income. It is not surprising since we ranked household by their income to estimate the concentration indices. But interestingly, we found that the contribution of income to the inequity in hospital delivery was mainly made by its protection effects rather than by income’s own distribution. Such findings suggest that should women have money to pay for their care in hospitals, no matter how unequal their household income levels are, they would tend to use hospital delivery. Therefore care specific demand side finance may be more effective than wide social protection programs. For that targeted demand side finance approaches like delivery vouchers 30, 31 , delivery fee exemptions 32, and conditional cash transfers 33 are all possible effective policy alternatives, with the last two approaches probably more effective, as proposed by the diagonal health system strengthening approach 34. Meanwhile, the results also sheds light that it is the ability to pay rather than wiliness to pay that determines the disproportionate coverage of hospital delivery for developing countries like China. Delivering babies in hospitals should be the desires of most of the women, and unlike the developed world 35, choice on where to deliver may not be the most important issue. As shown by China’s experience, the national hospital delivery strategy has been proved to be a great success in reducing maternal and neonatal mortality, with extensive targeted demand side finance mechanisms putting forward 36.
Despite income, health insurance played a vital role in reducing inequity of hospital delivery in China, particularly for the rural areas. In the rural areas, the contribution of health insurance was positive with a large scale in 1993, suggesting a large pro-rich effect, but such disparities near vanished till 2008. Health insurance coverage was quite low in 1993, but increased dramatically to near universal in 2008, thus explained the small minus contribution to the concentration indices of hospital delivery in 2008. It is well reported in literature that rural health insurance collapsed after the economic reform since 1978, ushering in non trivial medical impoverishment 37. Since 2003, the NCMS was introduced in rural China, which is heavily subsidized by the central government. Impact evaluations 38, 39 consistently show that the NCMS increased uptake of care. Accordingly, the over period decomposition in our analysis showed different patterns across the urban rural typologies. For example in the rural areas, the most contribution to the decreasing inequity in hospital delivery was made by equal coverage of health insurance; whilst in the urban areas, the role was made by the protecting effects of health insurance per se. Furthermore, the newly introduced NCMS in China have relatively low reimbursement rate while the urban reproductive insurance has been putting forward since 1988 with more generous benefit packages 39. These findings suggest that although improvement has been made by equal coverage of NCMS in rural China, the actual financial protection effect of the NCMS warrants improvement.
As for other SDHs, the role of education was consistent with literatures 13, 16. Whilst the different patterns across urban/rural typologies corroborates their development levels. In the rural areas, the role of education in reducing inequity was mainly made by achievement of equal distribution of primary education; whilst in the urban areas by its protection effects. A law to guarantee compulsory primary education was pasted in 1986 with substantial financial input by the central government since 2006. Thus it is with no doubt to witness the pro-poor effect of primary education to reduce inequity in hospital delivery due to its own more equal distribution. Social development made by improvement of hygiene situations also contributed greatly to the reduction of inequity in uptake of care. This confirmed the literature that people with better living conditions tends to have easier accessibility to primary care 16. Rural minority women were less likely to use hospital delivery, suggesting more policy emphasis is warranted. As for other social determinants, both employment and marriage have trivial effects in this analysis.
Careful scrutiny is warranted for such an analysis. Firstly, our data are cross-sectional and all the analyses are based on regression models. Thus the conclusions made by this paper should not be considered as causal. However, the novel approach used in this analysis equipped us with a new perspective to overlook the disproportional distribution of primary care amongst the poor. By such an analysis, we entrench the literature not only by quantifying the contributions of various SDHs to the inequities of health care, but also by explaining how the contributions were made. We found that the role of income to reducing inequity of care was played by its own protection effects, whilst the role of health insurance was made by its more equal distribution for the rural. Such analyses could help the policy makers to understand why and how policy changes could reduce inequities in the access of care. Secondly, the data in this study are nationally representative and the sample size is large. As reported previously, response rate was higher than 90% 40. With sampling procedures fully taken into account we believe that the analysis yielded robust national estimates, though there may be some limitations. Births not approved by the family planning system or among rural migrants temporarily away from home may have been missed. Since these women may be less likely to use formal services we may have over-estimated the proportion of births in health institutions. And thirdly, the analysis only covered data in 1993 to 2008, and we are unable to further explore polices developed after 2009, particularly the NCMS. However since the coverage of NCMS almost achieved universal in 2008, the data gap may not affect the interpretation of the main findings.
China’s sustained commitment to its national hospital delivery strategy has resulted in more equal accessibility; with most Chinese women now give birth in hospitals. The roles of social determinants of health are not trivial. The leading contributors are income, health insurance, living conditions and education. Income’s contribution was mainly made by its protection effect, suggesting that targeted demand side subsidies make sense. While health insurance’s role was mainly played by its own more equal distributions in the rural areas, suggesting that more investments are warranted for financial risk protection.
Funding
National Natural Science Foundation of China (No. 71303010 and No. 71422009).
References
- 1.Whitehead M. (1991) The concepts and principles of equity and health. Health Promotion International 6, 217-228.
- 2.Wagstaff A, Paci P, Van D E. (1991) On the measurement of horizontal inequity in the delivery of health care. , J Health Econ 10, 169-205.
- 3.Dobson A J. (2004) Public Health and the Risk Factor: A History of an Uneven Medical Revolution. The New England. , Journal of Medicine 350-627.
- 4.Link B, Northridge M, Phelan J, Ganz M. (1998) Social Epidemiology and the Fundamental Cause Concept: On the Structuring of Effective Cancer Screens by Socioeconomic Status. The Milbank Quarterly. 76, 375-402.
- 5.Baum F, Harris L. (2006) Equity and the social determinants of health. , Health Promotion Journal of Australia 17, 163-165.
- 6.Wilkinson R, Marmot M. (2003) Social determinants of health: the solid facts. Copenhagen, Denmark: World Health Organization;.
- 7.Marmot M. (2007) Achieving health equity: from root causes to fair outcomes. , The Lancet 370, 1153-1163.
- 8.CSDH: Closing the gap in a generation: health equity through action on the social determinants of health. Final Report of the Commission on Social Determinants of Health. Geneva:World Health Organization;2008 .
- 10.Feng X L, Zhu J, Zhang L, Song L, Hipgrave D et al. (2010) . Socio-economic disparities in maternal mortality in China between1996and2006. BJOG 117, 1527-1536.
- 11.Feng X L, Guo S, Hipgrave D, Zhu J, Zhang L et al. (2011) China's facility-based birth strategy and neonatal mortality: a population-based epidemiological study. , Lancet 378, 1493-1500.
- 12.Feng X L, Xu L, Guo Y. (2011) Ronsmans C: Socioeconomic inequalities in hospital births in China between1988and2008. Bull World Health Organ. 89, 432-441.
- 13.Xue L, Guo S, Cui Y, Wu K, Zhao F. (2004) Analyzing the determinants of hospital delivery for the pregnancy. Maternal and Child Health Care of China. 19, 10-11.
- 14.Wang Y, Zhao X, Wang X, Fu X, M L I et al. (2001) A Study on the Determinants of the Utilization of Hospital Services at Delivery in Fengning County of Hebei Province of China. Chinese Rural Health Service Administration. 21, 60-62.
- 15.Long Q, Zhang T, Xu L, Tang S. (2010) Hemminki E: Utilisation of maternal health care in western rural China under a new rural health insurance system (New Co-operative Medical System). Trop Med Int Health. 15, 1210-1217.
- 16.Say L, Raine R. (2007) A systematic review of inequalities in the use of maternal health care in developing countries: examining the scale of the problem and the importance of context. B World Health Organ. 812-819.
- 17.China MOH. (2008) The guideline manual for the Fourth National Health Services Survey (in Chinese).:.
- 18.China MOH. (2006) Maternal and child health surveillance working manual (in Chinese):MCH department,MOH, China National Office for Maternal and Child Health Surveillance of China;.
- 19.Kakwani N C, Wagstaff A, E van Doorslaer. (1997) Socioeconomic inequalities in health: Measurement, computation, and statistical inference. , J Econometrics 77, 87-103.
- 20.Wagstaff A, Paci P, E Van Doorslaer. (1991) On the measurement of inequalities in health. , Socical Science & Medicine 33, 545-557.
- 21.Aronson J R, Johnson P. (1994) Redistributive effect and unequal income tax treament. , Economic Journal 104, 262-270.
- 22.E Van Doorslaer, Wagstaff A, BH Christiansen T Van, GD Duchesne I De, Gerdtham U G et al. (2000) et al: Equity in the delivery of health care. in Europe and the US. J Health Econ 19, 553-583.
- 23.E Van Doorslaer, Wagstaff A, Bleichrodt H, Calonge S, Gerdtham U et al. (1997) et al: Income-related inequalities in health: some international comparisons. 16, 93-112.
- 24.Lambert P J, Aronson J R. (1993) Inequality Decomposition Analysis and the Gini Coefficient Revisited. , The Economic Journal 103, 1221-1227.
- 25.Podder N. (1993) The disaggregation of the Gini coefficient by factor components and its applications to Australia. Review of Income and Wealth. 39, 51-61.
- 26.Rao V M. (1969) Two Decompositions of Concentration Ratio. , Journal of the Royal Statistical Society. Series A (General) 132, 418-425.
- 27.Wagstaff A, E Van Doorslaer, Watanabe N. (2003) On decomposingthe causes of health sector inequalities with an application to malnutrition inequalities in Vietnam. , J Econometrics 112.
- 28.Greene W H. (2002) Econometric Analysis (P668). 5th Edition edn. Upper Saddle River. , New Jersey:Pearson Education,Inc
- 29.E van Doorslaer, Koolman X, Jones A M. (2004) Explaining income-related inequalities in doctor utilisation in Europe. Health Econ. 629-647.
- 30.Brody C M, Bellows N, Campbell M, Potts M. (2013) The impact of vouchers on the use and quality of health care in developing countries: A systematic review. Glob Public Health.
- 31.Abuya T, Njuki R, Warren C E, Okal J, Obare F et al. (2012) A policy analysis of the implementation of a Reproductive Health Vouchers Program in Kenya. , BMC Public Health 12-540.
- 32.Witter S, Arhinful D K, Kusi A, Zakariah-Akoto S. (2007) The experience of Ghana in implementing a user fee exemption policy to provide free delivery care. , Reprod Health Matters 15, 61-71.
- 33.Paul V K. (2010) India: conditional cash transfers for in-facility deliveries. , Lancet 375, 1943-1944.
- 34.Sepulveda J, Bustreo F, Tapia R, Rivera J, Lozano R et al. (2006) Improvement of child survival in Mexico: the diagonal approach. , Lancet 368, 2017-2027.
- 35.Wax J R, Lucas F L, Lamont M, Pinette M G, Cartin A et al. (2010) Maternal and newborn outcomes in planned home birth vs planned hospital births: a metaanalysis. , Am J Obstet Gynecol 203, 241-243.
- 36.Feng X L, Shi G, Wang Y, Xu L, Luo H et al. (2010) An Impact Evaluation of the Safe Motherhood Program in China. Health Econ. 19, 69-94.
- 37.Liu Y, Rao K, Hsiao W C. (2003) Medical expenditure and rural impoverishment in China. , J Health Popul Nutr 21, 216-222.
- 38.Babiarz K S, Miller G, Yi H, Zhang L, Rozelle S. (2010) New evidence on the impact of China's New Rural Cooperative Medical Scheme and its implications for rural primary healthcare: multivariate difference-in-difference analysis. BMJ. 341-5617.