
Abstract
Aim of the Research
The aim of this study is to analyze a group of dogs of different breeds affected by osteosarcoma (OSA), to document any prevalence of this primary bone neoplasia in breeds that are phylogenetically close and to help with further research human medicine, as a model of study for prevalence and epidemiology of human OSA in multiple populations.
Study Design
Pilot study from two canine surgery databases between 2002 and 2013.
Materials and Methods
Breeds were classified in groups based on their phylogenetical proximity. Differences in prevalence of OSA between breeds and groups were evaluated with a permutation test. For each breed and each group, a ranking was made by calculating 95 % confidence intervals and counting the no-overlapping between breeds and groups. The relation between the dogs’ heights and the prevalence of OSA was analyzed using a logistic regression between the disease status and dog size.
Results
A total of 67 dogs with OSA, in 26 different breeds were included. Ten breeds were overrepresented and, the majority of these, were classified in 2 predisposed groups phylogenetically close to each other. The prevalence of OSA was associated with the dogs’ height within predisposed breeds, but, in general, taller breeds were not the most affected.
Conclusions and Clinical Relevance
In this study, despite the small number of dogs, we observed that the most commonly affected breeds with OSA are phylogenetically closely related. This highlights the importance of genetics in the aetiology of canine OSA . In this preliminary study, indications are given on breeds, samples and genome locations to be further investigated. This could allow identification of pathogenic alleles in dogs, and potentially in humans. Furthermore this pilot research can represent a model of epidemiologic study of human OSA.
Author Contributions
Academic Editor: Gabriela Toledo, Center of Health and Rural Technology (CSTR) - Federal University of Campina Grande, Brazil.
Checked for plagiarism: Yes
Review by: Double-blind
Copyright © 2020 Fabrizio di Virgilio, et al.
 This is an open-access article distributed under the terms of the Creative Commons Attribution License, which permits unrestricted use, distribution, and reproduction in any medium, provided the original author and source are credited.
Competing interests
The authors have declared that no competing interests exist.
Citation:
Introduction
Osteosarcoma (OSA) is the most frequent primary bone tumour in humans and dogs, representing 85-98% of bone canine tumours1,2,3 however the disease is significantly more common in dogs than people4, in which fewer on 1,000 new cases are diagnosed annually5. The estimated OSA incidence in dogs is at least 13.9/100,0006 as opposed to an incidence of 1.02/100,000 in humans (across all ages)5.
Canine OSA is associated with a poor prognosis compared to human OSA, and micro-metastases are present in 90% of the cases at the time of diagnosis. Reports describing prognosis show that when combining surgical excision and chemotherapy, 40% of the dogs can live up to 1 year and 20% up to 2 years7.
OSA in dogs and humans share many characteristics like similar response to treatments as chemotherapy and surgery, the presence of microscopic neoplasia spread at diagnosis and dysregulation of several important molecular pathway4. The exact aetiology of OSA is still unknown but some predisposing factors are suspected: age1,7,8, neutering9, height1,3, weight1,3,9,sex2,3, intensive sport7,10,fast growth11, gravity centre position11, and osteosynthesis10,12,13. The implication of each factor has been reported in the veterinary literature but their relative influence is still not proven. However, there is strong evidence for age, neutering and breed to be predisposing factors. Indeed, the incidence of OSA appears to be bimodal and is most frequently diagnosed in dogs between 7 and 10 years of age1,14 and less frequently between 18 and 24 months7,8. In humans after a low incidence in individuals between 25 and 59 years old of age, the incidence of OSA rises again in individuals over 60 years of age, and is most often associated with Paget’s disease5. Adding to these data it’s important to highlight that OSA in humansaffects children and adolescents, constituting about 5% of pediatric cancers15. In dogs neutering is associated with an increased prevalence of OSA in both genders15,16, and Scottish Deerhounds (15%)9,16, Rottweilers (3-12%)5, Irish Wolfhounds (8.9%)1, Greyhounds (6.2%)1, Leonbergers (5.8%)1 and Great Danes (4.4%)1 are more predisposed than other breeds. Given this breed predisposition, the hypothesis of a genetic aetiology can be considered. Over the years, breeders have selected canine breeds for specific phenotypical or behavioural criteria. This repetitive cross-breeding led to the creation of approximatively 350 different breeds with many interspecific and very few intraspecific genetic differences17.
During the artificial selection process, it is possible that some deleterious genetic variants were inadvertently selected and conserved into one specific breed or breeds with phylogenetic proximity7,17. It is therefore reasonable to consider that OSA is associated with genetic predisposition by transmission of mutated alleles in breeds with phylogenetic proximity. Moreover, it has been demonstrated that the OSA in the Scottish Deerhounds is compatible with a dominant autosomal gene segregation with a penetrance of 0.67 and is governed primarily by a single genetic variant, which we can call a genetic risk factor18.
The genetic structure of dog populations, that is, the presence of dog breeds, offers many advantages for genomic analysis. Breed creation has inadvertently selected for many “founder” mutations that are associated with specific traits and diseases; this translates into reduced disease and genetic heterogeneity.
Because linkage-disequilibrium is up to 100-fold greater in dogs than humans, single breeds are powerful subjects for broad genetic mapping, whereas related breeds that share a trait are ideal subjects for fine mapping6.
Furthermore, naturally occurring cancers in dogs have an intrinsic advantage as a model for human disease in that they mimic and represent biologically complex conditions in a way that is not possible using other animal models. Pet dogs are exposed to many of the same environmental factors as humans, as they share the same living environment. Similar environmental, nutrition, age, sex, and reproductive factors lead to tumor development and progression in human and canine cancers19 A unifying pathogenesis for the development and progression of OSA remains to be defined in either human or dog.
The described similarities in the biology of the disease between both species suggest the potential opportunity to clarify OSA pathogenesis through a comparative approach that studies the disease in both species. The value of such a comparative approach is reinforced though the consistent finding in both species of complex genetic landscapes (i.e., markedly aneuploid karyotypes) in this cancer20.
To our knowledge, the relation between predisposed breeds for OSA and the phylogenetic proximity of those breeds has not been reported, much less the comparison between human and canine breeds OSA epidemiology. The first null hypothesis (Ho1) was that there is an equal prevalence of OSA in all breeds The second null hypothesis (Ho2) was that the prevalence was equal across groups consisting of phylogenetically related dogs.
Materials and Methods
Data Collection
Data were collected from the surgery database of the veterinary referral centre Clinique Universitaire de Faculté de Médecine Vétérinaire de l’Université de Liège (BE) and from Vetocéane Referral Veterinary Clinic – Vertou, Nantes (FR) between 2002 and 2013. All breeds were recorded for dogs diagnosed with OSA (OSA group) and for the total number of dogs presented for surgeries/surgical consultations unrelated to OSA (control group) during the time of the study (11 years). Dogs diagnosed with any type of OSA based on histopathology were included in the study.
Statistical Analysis
Prevalence of OSA Between Breeds and Groups.
For each breed, the prevalence of OSA was calculated by dividing the number of dogs in the “OSA group” by the total number of dogs of this breed. The difference between the different breeds was assessed with a contingency table formed by two columns (OSA cases and controls) and one line per breed.
Breeds were then classified into different groups according to their phylogenetic proximity using a recent phylogenetic tree created by VonHoldt and Pollinger in 201021 (Table 1), to compare the difference in OSA prevalence between the groups.
Table 1. Breed classification groups. This classification has been made according to the phylogenetic proximity of the different breeds, using a recent phylogenetic tree created by VonHoldt and Pollinger in 2010 to compare the difference in OSA prevalence between the groups| Group 1 | Group 2 | Group 3 | Group 4 | Group 5 |
|---|---|---|---|---|
| Belgian shepherd | Newfoundland | Bernese mountain dog | Rottweiler | Bordeaux mastiff |
| Shetland sheepdog | Labrador | Saint Bernard | Great dane | German shepherd |
| Border collie | Golden retriever | Bull mastiff | Borzoi | Doberman |
| Australian shepherd | Bull terrier | Irish wolfhound | Schnauzer | |
| Shetland | American Staffordshire terrier | Greyhound | ||
| Beauceron | Boston terrier | Afghan wolfhound | ||
| Bulldog | Italian wolfhound | |||
| Boxer | Whippet | |||
| Group 6 | Group 7 | Group 8 | Group 9 | Group 10 |
| Poodle | Briard | Samoyed | Basset hound | Weimaraner |
| Butterfly spaniel | Jack russel terrier | Alaskan malamute | Beagle | Springer Spaniel |
| Chihuahua | Yorkshire terrier | Sharpei | Dashwood | Elglish cocker |
| Shih-tzu | Scotish terrier | Siberian Husky | Cavalier king charles spaniel | |
| Pekingese | West highland white terrier | Chowchow | Brittany spaniel | |
| Cairn terrier | ||||
| Fox terrier |
Because of the small size of subsamples, a permutation test was performed for the two null hypotheses. The link between the animals and their status (OSA case or control) was disrupted by randomly shuffling the status. This procedure leaves the number of OSA cases and controls unchanged, as well as the number of animals within each breed (Ho1) and within each group (Ho2). Due to the random nature of the status allocation, the status and breeds (or groups) in the shuffled dataset are generated under the null hypotheses. Computing statistic similar to a chi-square and repeating the procedure a large (1000) number of times provides a good estimate of the distribution of this statistics under the null hypotheses. Finally, chi-square tests were performed on the real (not shuffled) dataset comparing the statistics value to the generated distribution one. The null hypothesis was accepted if the p-value was above or equal to 0.05; meaning that an association between the status and the breeds (or groups) exists.
Ranking of the Most Affected Breeds and Groups
For each breed and group, the prevalence was estimated based on (sometimes small) samples. 95% confidence intervals were obtained using the exact binomial distribution.
Pmaxis the maximal prevalence for which a number of cases equal or inferior to the actual number of OSA cases by breed or by group was observed with a probability equal to 2.5%.
Pmin is the minimal prevalence for which a number of cases equal or superior to the actual number of OSA cases by breed or by group was observed with a probability equal to 2.5%.
Pmax = 
Pmin = 
r: number of cases observed
n: number of dogs that belong to a breed or a group
B( i |n, Pmax) and B(i |n, Pmin): probability to observe a “i” event in the binomial distribution and “n” is the repetition of events having individually a Pmax or Pmin probability.
If the confidence intervals between two breeds of two groups do not overlap, a significant difference in the OSA prevalence between the two breeds or groups is probably observed. For each breed and group, the number of breeds or groups not overlapping their confidence interval can be counted. Using these counts, ranking of the most frequently affected breeds and groups could be obtained.
Relation Between Height and OSA
The relation between the average dog heights and the OSA prevalence was reviewed because OSA prevalence could differ for larger animals with larger bones. This can be tested using a logistic regression of the disease status on the dog size. In addition, average heights were noted for both male and female dogs.
Results
Data
In total, 5373 dogs from 64 breeds were presented for surgical affections. Only 26 different breeds (Rottweiler (n= 14); Labrador Retriever (n=7); Belgian Shepherd; Golden Retriever, Dobermann, Beauceron (n=4 each); Bernese Mountain Dog, Pyrenean Mountain Dog, German Shepherd (n=3 each); Leonberger, Irish Wolfhound, Great Dane, Chow- Chow (n=2 each); Shar Pei, Scottish Terrier, Poodle, American Staffordshire Terrier, Bull Terrier, Irish Terrier, Brie Shepherd, Basset Fauve de Bretagne, Bordeaux Mastiff, Cavalier King Charles Spaniel, Lhasa Apso, Greyhound and Basset Hound (n=1 each) were retained, and a total of 67 cases of OSA were included in the study (Table 1).
The study included 39 cases of appendicular OSA (8 proximal humerus, 7 distal femur, 7 distal tibia, 5 proximal tibia, 4 distal radius, 3 olecranon, 2 distal ulna, 1 scapula, 1 ischium, 1 metacarpus), 12 cases of axial OSA (5 mandibular, 5 maxillary, 2 vertebral) and 6 costal (rib) OSA . In 10 cases, the location was not specified.
Statistical Results
Breeds
When comparing the OSA prevalence between breeds using a chi-square test and a permutation test, a significant difference between breeds was noted (P value permutation = 0.01). As a consequence, Ho1 was rejected and breed is potentially an important factor in the OSA aetiology (Table 2).
Table 2. Prevalence of OSA for each group. When comparing the OSA prevalence between breeds using a chi-square test and a permutation test, a significant difference between breeds was noted (P value permutation = 0.01). As a consequence, Ho1 was rejected and breed is potentially an important factor in the OSA aetiology| Breeds | osteosarcoma | Control group | Prevalence (%) |
|---|---|---|---|
| Afghan wolfhound | 0 | 10 | 0,00 |
| Italian wolfhound | 0 | 8 | 0,00 |
| Irish wolfhound | 2 | 10 | 16,67 |
| Great Pyrenean | 3 | 35 | 7,89 |
| Sharpei | 1 | 38 | 2,56 |
| Scottish terrier | 1 | 12 | 7,69 |
| Poodle | 1 | 190 | 0,52 |
| Brittany spaniels | 0 | 124 | 0,00 |
| Butterfly spaniels | 0 | 5 | 0,00 |
| Bulldogs | 0 | 440 | 0,00 |
| Fox terrier | 0 | 62 | 0,00 |
| Saint Bernard | 0 | 33 | 0,00 |
| Australian shepherd | 0 | 24 | 0,00 |
| German shepherd | 3 | 212 | 1,40 |
| Boxer | 0 | 173 | 0,00 |
| Jack Russel | 0 | 187 | 0,00 |
| Cocker | 0 | 197 | 0,00 |
| Yorkshire | 0 | 364 | 0,00 |
| Shih-tzu | 0 | 125 | 0,00 |
| Chihuahua | 0 | 59 | 0,00 |
| American staffordshire | 1 | 93 | 1,06 |
| Belgian shepherds | 4 | 86 | 4,44 |
| Border collie | 0 | 117 | 0,00 |
| Dashwood | 0 | 209 | 0,00 |
| Bichon frisé | 0 | 269 | 0,00 |
| Rottweiler | 14 | 174 | 7,45 |
| Labrador retriever | 7 | 539 | 1,28 |
| Golden retriever | 4 | 205 | 1,91 |
| Bernese mountain dog | 3 | 168 | 1,75 |
| Doberman | 4 | 69 | 5,48 |
| Beauceron | 4 | 91 | 4,21 |
| Chowchow | 2 | 20 | 9,09 |
| Bull terrier | 1 | 35 | 2,78 |
| Irish terrier | 1 | 1 | 50,00 |
| Brie shepherd | 1 | 11 | 8,33 |
| Fauve de Bretagne | 1 | 8 | 11,11 |
| Leonberger | 2 | 25 | 7,41 |
| Bordeaux Mastiff | 1 | 49 | 2,00 |
| Great Dane | 2 | 92 | 2,13 |
| Cavalier king charles spaniel | 1 | 98 | 1,01 |
| Lhassa apso | 1 | 66 | 1,49 |
| Basset hound | 1 | 60 | 1,64 |
| Alaskan malamute | 0 | 14 | 0,00 |
| Siberian husky | 0 | 34 | 0,00 |
| Samoyed | 0 | 8 | 0,00 |
| Pekingese | 0 | 24 | 0,00 |
| Springer spaniel | 0 | 14 | 0,00 |
| Weimaraner | 0 | 27 | 0,00 |
| Beagle | 0 | 182 | 0,00 |
| Schnauzers | 0 | 20 | 0,00 |
| Boston terrier | 0 | 2 | 0,00 |
| Bull mastiff | 0 | 22 | 0,00 |
| Cairn terrier | 0 | 21 | 0,00 |
| West highland white terrier | 0 | 39 | 0,00 |
| Whippet | 0 | 21 | 0,00 |
| Newfoundland | 0 | 25 | 0,00 |
| Greyhound | 1 | 3 | 25,00 |
| Korthals | 0 | 9 | 0,00 |
| Akita inu | 0 | 7 | 0,00 |
| Dalmatian | 0 | 15 | 0,00 |
| Shetland sheepdog | 0 | 7 | 0,00 |
| Colley | 0 | 13 | 0,00 |
| Borzoi | 0 | 2 | 0,00 |
| Pug | 0 | 4 | 0,00 |
Moreover, when comparing confidence intervals between breeds, an important overlap between breeds was noted; only 10 breeds were significantly different from other breeds: Rottweiler, Irish Wolfhound, Pyrenean Mountain dog, Dobermann, Beauceron, Belgian Shepherd, Irish Terrier, Chow Chow, Greyhound and Leonberger (Table 3).
Table 3. Comparison of Pmin-Pmax intervals between breeds| Breeds | Pmin (%) | Pmax (%) | Significant difference with other breeds |
| Afghan wolfhound | 0 | 55,60 | 0 |
| Italian wolfhound | 0 | 36,94 | 0 |
| Irish wolfhound | 2,08 | 48,41 | 7 |
| Great Pyrenean | 1,65 | 21,37 | 3 |
| Sharpei | 0,06 | 13,47 | 0 |
| Scottish Terrier | 0,19 | 36,02 | 0 |
| Poodle | 0,01 | 6,00 | 0 |
| Brittany spaniels | 0 | 2,90 | 0 |
| Butterfly spaniels | 0 | 52,18 | 0 |
| Bulldog | 0 | 0,83 | 0 |
| Fox terrier | 0 | 5,77 | 0 |
| Saint Bernard | 0 | 10,57 | 0 |
| Australian shepherd | 0 | 14,24 | 0 |
| German shepherd | 0,28 | 4,02 | 0 |
| Boxer | 0 | 2,10 | 0 |
| Jack Russel | 0 | 1,95 | 0 |
| Cocker | 0 | 1,85 | 0 |
| Yorkshire | 0 | 1,00 | 0 |
| Shih-tzu | 0 | 2,90 | 0 |
| Chihuahua | 0 | 6,06 | 0 |
| American staffordshire terrier | 0,02 | 5,78 | 0 |
| Belgian shepherd | 1,22 | 10,99 | 2 |
| Border collie | 0 | 3,10 | 0 |
| Dashwood | 0 | 1,74 | 0 |
| Bichon frisé | 0 | 1,36 | 0 |
| Rottweiler | 4,13 | 12,17 | 13 |
| Labrador retriever | 0,51 | 2,62 | 0 |
| Golden retriever | 0,52 | 4,82 | 0 |
| Bernese mountain dog | 0,36 | 5,04 | 0 |
| Doberman | 1,51 | 13,43 | 3 |
| Beauceron | 1,15 | 10,43 | 2 |
| Chowchow | 1,12 | 29,16 | 2 |
| Bull terrier | 0,07 | 14,52 | 0 |
| Irish terrier | 1,25 | 98,74 | 2 |
| Brie shepherd | 0,21 | 38,47 | 0 |
| Fauve de Bretagne | 0,28 | 48,24 | 0 |
| Leonberger | 0,91 | 24,28 | 1 |
| Bordeaux Mastiff | 0,05 | 10,64 | 0 |
| Great Dane | 0,25 | 7,47 | 0 |
| Cavalier king Charles spaniel | 0,02 | 5,49 | 0 |
| Lhassa apso | 0,03 | 8,03 | 0 |
| Basset hound | 0,04 | 8,93 | 0 |
| Alaskan malamute | 0 | 23,16 | 0 |
| Siberian husky | 0 | 10,28 | 0 |
| Samoyed | 0 | 36,94 | 0 |
| Pekingese | 0 | 14,24 | 0 |
| Springer | 0 | 23,16 | 0 |
| Weimaraner | 0 | 12,77 | 0 |
| Beagle | 0 | 2,00 | 0 |
| Schnauzers | 0 | 16,84 | 0 |
| Boston terrier | 0 | 84,18 | 0 |
| Bull mastiff | 0 | 15,43 | 0 |
| Cairn terrier | 0 | 16,10 | 0 |
| West highland white terrier | 0 | 9,02 | 0 |
| Whippet | 0 | 16,10 | 0 |
| Newfoundland | 0 | 13,71 | 0 |
| Greyhound | 0,84 | 90,57 | 1 |
| Korthal | 0 | 33,62 | 0 |
| Akita inu | 0 | 40,96 | 0 |
| Dalmatian | 0 | 21,80 | 0 |
| Shetland | 0 | 40,96 | 0 |
| Shetland sheepdog | 0 | 24,70 | 0 |
| Borzoi | 0 | 84,18 | 0 |
| Pug | 0 | 60,23 | 0 |
Groups
When comparing OSA prevalence between groups using a chi-square test and a permutation test, a significant difference between groups (group 1, OSA group and control group) was noted (P value permutation = <0.001), rejecting Ho2. Thus, there is a significant genetic effect in the OSA aetiology (Table 4).
Table 4. Groups osteosarcoma prevalence: this table has been create using a chi-square test and a permutation test, a significant difference between groups (group 1, OSA group and control group) was noted (P value permutation = <0.001), rejecting Ho2. Thus, there is a significant genetic effect in the OSA aetiology| Group | Osteosarcoma | Control group | Prevalence (%) |
|---|---|---|---|
| 1 | 4 | 243 | 1,62 |
| 2 | 14 | 967 | 1,43 |
| 3 | 3 | 610 | 0,49 |
| 4 | 19 | 319 | 5,62 |
| 5 | 10 | 336 | 2,89 |
| 6 | 1 | 672 | 0,15 |
| 7 | 4 | 187 | 2,09 |
| 8 | 1 | 687 | 0,15 |
| 9 | 1 | 450 | 0,22 |
| 10 | 1 | 461 | 0,22 |
In addition, when comparing confidence intervals between groups, an important overlap between groups was observed; only 2 groups were statistically different, namely groups 4 and 5. Group # 4 is composed of Rottweiler, Irish wolfhound, Greyhound, Barzoi, Whippet, Great Dane, Afghan hound, Italian hound and group # 5 is composed of Bordeaux Mastiff, Doberman, German Shepherd and Schnauzer (Table 5).
Table 5. Comparison of Pmin-PMax intervals between groups| Group | Pmin (%) | Pmax (%) | Significant difference with other breeds |
| 1 | 0,44 | 4,09 | 0 |
| 2 | 0,78 | 2,38 | 0 |
| 3 | 0,10 | 1,42 | 0 |
| 4 | 3,41 | 8,63 | 6 |
| 5 | 1,39 | 5,25 | 4 |
| 6 | 0 | 0,82 | 0 |
| 7 | 0,57 | 5,27 | 0 |
| 8 | 0 | 0,80 | 0 |
| 9 | 0 | 1,22 | 0 |
| 10 | 0 | 1,20 | 0 |
Height
The logistic regression showed a slight increase in prevalence of OSA in dogs with a height until 60-65 cm where we spot a major increase reaching a maximal OSA prevalence point at an average height of 75-80 cm. After this peak, OSA prevalence decreased slightly at the average height of 85-90 cm (Figure 1).
Figure 1.Logistic regression of the breed prevalence on the average size of the breed. There is a real difference between the smaller breeds (<65cm) and the taller breeds (>65cm) but there is a small difference in OSA prevalence between tall breeds (65-70cm; 70-75cm; 85-90cm). The tallest breeds have not the highest OSA prevalence (75-80cm > 80-85cm > 85-90cm)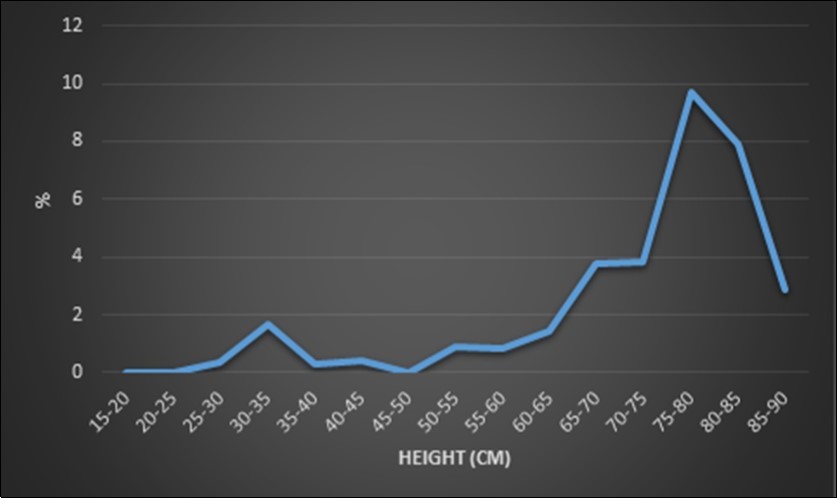
Discussion
An increasingly considered modeling approach in cancer biology and therapeutic development is the study of naturally occurring cancers in pet dogs (referred to as comparative oncology).
The higher incidence rate of canine OSA makes the pet dog population a good model for human disease. While there is potential for any dog to develop OSA, a subset of larger dog breeds are at increased risk of developing OSA22. Differences in disease prevalence and the more aggressive disease biology in the dog further argues the opportunity for this approach to inform our understanding of this highly aggressive pediatric and non pediatric cancer30.
A national canine cancer registry does not exist in the United States, European registries are extremely recent to provide accurate estimates, and most cases of suspected OSA are not definitively diagnosed histopathologically. Nevertheless, the incidence of OSA seems to be greater in dogs than in any other species, possibly 10–50 times higher than in humans5,22.
Although not as well characterized as in people, ample evidence exists implicating the involvement of genetic and heritable factors for the development of OSA in dogs. Currently the most thoroughly described gene mutation, which contributes to OSA formation and/or progression in dogs, is P5323.
The commonly affected p53 tumor suppressor pathway has similar alterations in human and canine OSA24. Because human TP53 is more similar to dog than mouse25, and because mutations occur naturally in dogs, the canine OSA model is presumably more relevant to humans than other animal models23.
This study included 67 dogs with OSA, and the demographic data of these dogs are similar to previous studies26.
Results show that there is a significant breed effect in OSA aetiology, particularly for Rottweilers and Irish Wolfhound and, to a lesser extent, for Pyrenean Mountain Dogs, Dobermanns, Beaucerons, Belgian Shepherds, Irish Terriers, Chow Chows, Greyhounds and Leonbergers9,16.
Cancer is a genetic disease characterized by a progressive accumulation of genomic aberrations that are sometimes augmented by predisposing germline mutations27. Although evolutionary theory has proven to be powerful for understanding cancer progression, evolutionary processes are quite different in cancers versus in speciesin ways that are important to phylogenetic inference28.
When regrouping breeds by phylogenetic proximity and comparing the prevalence confidence intervals between groups, it appears that groups 4 and 5 are significantly more affected than others29,30. This observation suggests that the effect of genetics in OSA prevalence and in phenotype cannot be rejected.
However, only 4 out of 10 most affected breeds (Rottweiler, Irish Wolfhound, Greyhound and Dobermann) were classified into groups 4 and 5. The phylogenetic tree used in order to construct groups was built using single nucleotide polymorphisms typed in 92 breeds, leading to the definition of the groups in Table 1, and leaving some breeds as not included in any group, among which the four referred to above28. This phylogenetic tree shows some differences with the group classifications of the American kennel club but also some concordances.
If we referred to the American kennel club (2018)31, Pyrenean Mountain Dogs and Leonbergers, which are among the most affected breeds, were not classified in our report, and could be classified into group 5. In consequence, this observation suggests that a large majority of the most affected breeds in our group studied, are phylogenetically close and classified in groups 4 and 5, but in the opinion of the authors more research is needed to confirm this hypothesis.
Our preliminary results strongly support the hypothesis that canine OSA has a major genetic aetiology. As OSA was reported in all groups, it is possible that one or many ancestral alleles involved in OSA development are old, preceding the groups differentiation, and thus transmitted to all groups of dogs, or that common environmental factors are involved. Furthermore some allele mutations increasing the OSA prevalence appeared later after the groups differentiation but before and after the split between groups 4 and 58,14. Indeed, even if this report does not demonstrate differences in OSA prevalence between breeds within a group (other publications show significant differences between breeds in the group 4, particularly between Greyhound and Rottweiler, hence occurrence of new mutations at breed differentiation cannot be rejected9,16.
Furthermore, in group 1 the prevalence of OSA was not significantly higher than in other groups, but Belgian Shepherd, which is one of the most affected breeds, is present in this group and Beauceron, which is among the most affected breeds and was not classified in any group in this study, even though it could be classified into group 1 following the American Kennel club recommendations (2018)31. Moreover, groups 1 and 5 are phylogenetically closer to each other than all others groups and no significant differences of OSA prevalence was observed between groups 1, 4 and 5. Those observations support that the group 1 could potentially be predisposed to OSA even if this report does not demonstrate it.
Breed creation inadvertently selected many “founder” mutations that are associated with specific traits and diseases; this translates into reduced disease and genetic heterogeneity, consistent with the fact that most breeds are predisposed to a distinct set of diseases. Because linkage disequilibrium is up to 100-fold greater in dogs than humans, single breeds are powerful subjects for broad genetic mapping23,33.
Dogs are an excellent example of high genetic diversity between breeds but low genetic diversity between dogs belonging to the same breed30,34,35. Even if the genetic diversity in humans is approximatively the same than in dogs, human populations or ethnic groups are open genetic pools, which leads to high genetic diversity between persons in a population or ethnic groups33,35. This is one of the reasons why it is difficult to find pathogenic alleles in humans.
In human medicine has been observed how OSA prevalence changes between different pools of populations, with a marked difference depending on their area of origin. Infact, OSA incidence is highest among Asian/Pacific Islanders (5.3 per million) followed by Africans and African-americans (5.1 per million), Hispanics (4.9 per million), whites (4.4 per million), and American Indian/Alaskan natives (3.0 per million)36.
Despite this, due to author’s knowledges there is still no sufficient data about the relationship between ethnicity and human OSA. In support of the potential importnce of this aspect, we think that canine breed model can be higly important as study model for human OSA epidmiology.
In dogs, the genetic diversity between individuals in one breed is low and it is less difficult to identify the pathogenic alleles. Therefore, when a genetic pathology is similar in humans and dogs, it can be more interesting to start research in dogs, and particularly in the most affected breeds32,33.
A study comparing the transcriptional profiles of canine and human OSA found them to be virtually indistinguishable30 and many of the key genes implicated in the pathogenesis or progression of OSA in children have also been characterized in the canine disease, notably PTEN: phosphatase and tensin homolog, Rb: retinoblastoma, ezrin; villin-2, c-met: mesenchymal-epithelial transition factor, erbB-2: v-erb-b2 erythroblastic leukemia viral oncogene homolog 2, neuro/glioblastoma derived oncogene homolog (avian) and tumor protein 5333
In 2005 the first public draft of the canine genome sequence was released37,38. This milestone provided the opportunity for dogs with tumors to lend additional insight into the biology of human cancers, and to more rigorously evaluate and translate novel approaches to human trials21.
Canine OSA resembles that of human in other several aspects. Both species species develop these tumors most commonly in the metaphysis of long bones, with micro metastases at the time of diagnosis, and overt lung metastases as the main cause of mortality39,40.
In our report, we demonstrated that 10 phylogenetically close breeds might have a higher OSA prevalence than other breeds, especially the Rottweiler and the Irish Wolfhound. A genome-wide comparison between affected dogs and non-affected dogs in those breeds could allow identification of pathogenic alleles in dogs, and potentially in humans.
Karison et al. (2013)41 compared the genome of affected dogs with the genome of a control group in Rottweilers, Irish Wolfhounds and Greyhounds. They found 33 loci implicated in heritable OSA. Moreover, loci were in majority located at regions of reduced heterozygosity, according to the hypothesis of selected pathogenic allele during the artificial selection33,35. Given the high number of loci involved in OSA prevalence, the hypothesis of a polygenic pathology could be considered41. In veterinary and human literature is possible to observe that the prevalence of OSAcan vary depending on breed, sex and age3.
As the biological behavior is similar in dogs and humans, common risk factors for developing the disease can be expected. Thus, data on incidence related to exact breeds of dogs might help define the supposed interaction between birth weight, growth rate, adult body weight or height, and the development of OSA. In this context, recognizing breeds of similar stature having significantly different incidence rates of OS is of particular interest22.
Indeed, the link between appendicular and axial OSA is higher for the bigger breeds than for the small breeds and appendicular OSA appear to be less aggressive in small breeds17. Costal (rib) OSA seems to be a different type of OSA, appearing in younger animals and, like axial OSA, preferably in female dogs19. Those differences associated with the different OSA prevalence inside groups support the existence of three different types of OSA, costal, axial and appendicular, which partially originate from mutations of different loci in the formation of groups and breeds. More precisely, in research of implicated loci, studies should be done in only one type of OSA.
Genetic similarity is the principal common point between most affected breeds, but other common factors were observed such as height14. In our report, there is a tendency to an increased OSA prevalence with increasing height but the real difference was noted between smaller (<65cm) and taller breeds (>65cm).
There is a small difference in OSA prevalence between tall breeds and it is not the tallest breeds that have the highest OSA prevalence. Some tall breeds have a lower OSA prevalence than some smaller ones. Nevertheless, in the veterinary literature, for a given breed, no correlation was reported between height and the OSA prevalence31. Our preliminary results associated to the literature do not allow us to considered height as a predisposing factor for OSA.
In humans, Longhi et al, suggested that hat OSA may be associated with a taller stature at least in growing individuals42. Despite these elements, it continuous to be hard for human epidemiological studies, to show a strong and significant correlation between body weight or height and risk of developing OSA43.
Fast growing has also been supposed to be a predisposing factor for OSA3. Indeed, in large breeds the appendicular skeleton is the most affected (85%)and is subject to high remodelling during growth4. This parameter is highly related to the height and, as observed previously, some dogs with higher height and higher bone remodelling during growth have lower OSA prevalence than other breeds which have lower height and bone remodelling during growth16.
Moreover, in small breeds, there is 66% of axial bone OSA even if the appendicular skeleton is subject to higher remodelling than axial skeleton during growth1. The effect of those phenotypic and physiologic parameters is ambiguous and not demonstrated11,12. According to our results, those parameters are potentially correlated with phylogenetic proximity rather than predisposing factors. It is also possible that the oncogenic alleles are located close to alleles involved in the high height and/or high weight and/or fast growing and are therefore preferentially transmitted at the same time41. This hypothesis is supported by the report of Karisson et al. (2013)41 which have found some loci involved in heritable OSA close to loci known to control bone remodelling. It could explain the fact that the most affected breeds were large breed dogs with no correlation between those parameters and OSA prevalence when comparing dogs for a given breed or when comparing the most affected breeds (taller) between them5,7.
OSA is an infrequent tumor11; hence, few cases per breed have been listed and other biases could make the prevalence lower or higher for some breeds. For example, the majority of affected dogs are geriatric, between 7 and 13 years, but dogs in the control group cover a larger span of ages, which means that some dogs from the control group might become affected later, leading to an underestimation of the observed prevalence per breed (late onset disease)3,7.
Due to this aspect, a smaller peak in age incidence at 18 to 24 months corresponds with the human peak incidence at late puberty, which has led to the hypothesis of skeletal growth parameters representing some of the possible etiological factors for developing this disease43,44.
Moreover this report is realised within a given geographical location where a significant difference in breed proportions could be observed in comparison with the overall population; thus it could be not representative for some breeds at a larger scale than the local scale, and should therefore be only considered as indicative. In consequence, differences between observed OSA prevalence should be considered with care due to the potentially biased nature of the sampling process9,15. Prevalence confidence intervals which takes into account the total number of dogs per breed, can lead to a better inter-breed comparison, although the biased sampling concerns remain.
These epidemiological aspects could be useful for establish as well as in veterinary medicine a parallelism in human medicine between OSA prevalence. In fact canine model and breeds epidemiology can represent the starting point for numerous investigations about prevalence of this bone cancer in different human populations heterogeneous for origin, ethnicity, geographical location ect.
Furthermore dogs and humans cohabit in the same environment and the push to select/hyper select some breeds could have consequently select resistant genes.
Conclusion
This preliminary report supports that OSA can be induced by one or many ancestral alleles segregating between breeds in different proportions, and is modulated by mutations occurring during the formation of groups and/or breeds and by external factors which are still misunderstood such as neutering, fast growing, intensive sport and bone fracture repair. We observed that the most affected breeds are phylogenetically closer than others and we highlighted the potential importance of genetics as an OSA aetiology. OSA in dogs shows striking similarities in tumour biology. Therefore, canine patients offer a unique opportunity for autochthonous tumour studies.
Further studies should be carried on in order to confirm these findings and to define potential oncogenic alleles and to confirm that research on canine breeds can be an important model of humane OSA research.
Availability of Data and Materials
All data generated or analysed during this study are included in this article
Consent for Publication
Not applicable
Ethics Approval and Consent to Participate
Not applicable
Funding
The authors declare that there were no funding and support.
References
- 1.Anfinsen K P, Grotmol T, Bruland O S. (2011) Breed specific incidence rates of canine primary bone tumors, a population based survey of dogs in Norway. , Can J Vet Res 75(3), 209-15.
- 2.Wayne R K, VonHoldt B M. (2012) Evolutionary genomics of dog domestication. , Mamm Genome,23(1-2): 3-18.
- 3.Schiffman J D, Breen M. (2015) Comparative Oncology: What dogs and other species can teach us about humans with cancer. Philos Trans R Soc Lond B boil Sci. 370-1673.
- 4.Fenger J M, London C A, Kisseberth W C. (2014) Canine osteosarcoma: a naturally occurring disease to inform pediatric oncologyILAR. , J 55(1), 69-85.
- 5.MirabelloL TroisiRJ, Savage S A. (2009) Osteosarcoma incidence and survival rates from 1973 to 2004: data from the Surveillance, Epidemiology, and End Results ProgramCancer. 115(7), 1531-43.
- 6.Rowell J L, McCarthy D O, Alvarez C E. (2011) Dog models of naturally occurring cancerTrends Mol Med. 17(7), 380-8.
- 7.Morello E, Martano M, Buracco P Biology. (2011) diagnosis and treatment of canine appendicular osteosarcoma: similarities and difference with human osteosarcoma. , Vet J 189(3), 268-7.
- 8.Leroy G, Verrier E, Meriaux J C. (2009) Genetic diversity of dog breeds: between-breed diversity, breed assignation and conservation approaches.Jun Anim Genet. 40(3), 333-43.
- 9.Cooley D M, Beranek B C, Schlittler D L. (2002) Endogenous gonadal hormone exposure and bone sarcoma risk. Cancer epidemiol Biomarkers Rev. 11, 1434-1440.
- 10.Burton A G, Johnson E G, Vernau W. (1983) Implant-Associated neoplasia in dogs: 16 cases. , J Am Vet Assoc 247(7), 778-85.
- 11.Simpson S, DunningMD deBrotS, Grau-Roma L, MonganNP. (2017) Rutland CSComparative review of human and canine osteosarcoma: morphology, epidemiology, prognosis, treatment and geneticsActaVetScand. 59(1), 71.
- 12.Kim R N, Kim D S, Choi S H, Yoon B H, Kang A et al. (2012) Park HSGenome analysis of the domestic dog (Korean Jindo) by massively parallel sequencingDNARes. 19(3), 275-8.
- 13.Arthur E G, Arthur G L, Keeler M R. (2016) Risk of osteosarcoma in dogs after open fracture fixation. Vet Surg. 45(1), 30-5.
- 15.Laitinen M, Parry M, Albergo J I, Jeys L, Grimer R et al. (2018) . , Outcome of Pelvic Bone Sarcomas in Children J Pediatr Orthop. Nov/Dec; 38(10), 537-542.
- 16.Streitberger K, Schweizer M, Kropatsch R. (2011) Rapid genetic diversification within dog breeds as evidenced by a case study on schnauzers. Anim Genet. 07743.
- 17.Amsellem P M, Selmic L E, Wypij J M. (2014) Appendicular osteosarcoma in small-breed dogs: 51 cases(1986-2011).J Am Vet Mes Assoc. 245(2), 203-10.
- 18.Lin Z X, Xu Z H, An Y H, Li X. (2016) In situ observation of fracture behavior of canine cortical bone under bendingMaterSciEng. , C Mater BiolAppl. May; 62, 361-7.
- 19.Gardner H L, Fenger J M, London C A. (2016) Dogs as a Model for Cancer Annu Rev Anim Biosci. 4, 199-222.
- 20.Fan T M, KhannaC. (2015) Comparative Aspects of Osteosarcoma Pathogenesis in Humans and DogsVetSci. 2(3), 210-230.
- 21.VonHoldt B, Pollinger J. (2010) Genome-wide SNP and halotype analyses reveal a rich history underlying dog domestication. Nature. 464(7290), 898-902.
- 22.K P Anfinsen, Grotmol T, O S Bruland, T J Jonasdottir. (2011) Breed-specific incidence rates of canine primary bone tumors—A population based survey of dogs in. 75, 209-215.
- 23.SakthikumarS ElversI, Kim J, Arendt M L, Thomas R, Turner-Maier J et al. (2018) SETD2 Is Recurrently Mutated in Whole-Exome Sequenced Canine OsteosarcomaCancerRes. , Jul 78(13), 3421-3431.
- 24.Zhang J, Chen X, Kent M S, Rodriguez C O, Chen X. (2009) Establishment of a dog model for the p53 family pathway and identification of a novel isoform of p21 cyclin-dependent kinase inhibitorMol CancerRes. 7(1), 67-78.
- 25.Russell D S, Kisseberth WC JaworskiL. (2018) Immunohistochemical detection of p53, PTEN, Rb, and p16 in canine osteosarcoma using tissue microarrayJVetDiagnInvest. , Jul; 30(4), 504-509.
- 26.MEK Trost, G D Brown, C, Irogoyen C S L, L F Fighera et al. (2012) Primary bone neoplasms in dogs: 90 cases. Presq Vet Bras. 32(12), 1329-35.
- 27.Hanks S, Coleman K, Reid S, Firth H PlajaA, Fitzpatrick D et al. (2004) Constitutional aneuploidy and cancer predisposition caused by biallelic mutations in (BUB1B). , Nat. Genet 36, 1159-1161.
- 29.Jacques C, Renema N, Ory B LezotF, WalkleyCR GrigoriadisAE, Heymann D. (2018) Small animal models for the study of bone sarcoma pathogenesis: characteristics, therapeuticinterests and limitationsJ Bone Oncol. 12, 7-13.
- 30.Sallander M, Hedhammar A, Rundgren M, Lindberg J E. (2001) Demographic data of a population of insured Swedish dogs measured in a questionnaire study. , Acta Vet Scand 42, 71-80.
- 31.American Kennel Club (2018) The complete dog book: official breed standards and profiles for over 200 breeds. I-5 Publishing, CA United States.
- 32.Rosenberger J A, Pablo N V, Crawford P C. (2007) Prevalence Of and risk factors for appendicular osteosarcoma in dogs: 179 cases (1996-2005). J Am Vet Med Assoc. 231(7), 1076-80.
- 34.Parker H G, Shearin A L, Ostrander E A. (2010) Man’s best friend becomes biology’s best in show: genome analyses in the domestic dog. , Annu Rev Genet 44, 309-36.
- 35.Yu L Q, Gao G L, Liu F J. (2012) Psychological stress effect on expression of P53 and NFkBp65 in human ovarian carcinoma in vivo. , Chin J Cancer Res 24(3), 245-8.
- 36.Geller D S, GorlickR. (2010) Osteosarcoma: a review of diagnosis, management, and treatment strategiesClin AdvHematolOncol. 8(10), 705-18.
- 37.Lindblad-Toh K, Wade C M, Mikkelsen T S, Karlsson E K, Jaffe D B et al. (2005) Genome sequence comparative analysis and haplotype structure of the domestic dog. , Nature 438(7069), 803-819.
- 38.Ostrander E A, Giger U, Lindblad-Toh K. (2006) The dog and its genome.Cold Spring,Harbor Laboratory Press.NY.
- 39.Withrow S J, Powers B E, Straw R C, Wilkins R M. (1991) Comparative aspects of osteosarcoma. Dog versus man. Clin Orthop Relat Res. 270, 159-568.
- 40.Bruland O S, Hoifodt H, Saeter G, Smeland S, Fodstad O. (2005) Hematogenous micrometastases in osteosarcoma patients. , Clin Cancer Res 11, 4666-4673.
- 41.Karisson E K, Sigurdsson S, Ivansson E. (2013) Genome-wide analyses implicate 33 loci in heritable dog osteosarcoma, including regulatory variants near CDKN2A/B. , Genome Biol 14(12), 132.