
Abstract
Lapatinib, a small molecule tyrosine kinase inhibitor is currently used in the treatment of HER2-positive breast cancer. The aim of this study was to further understanding of lapatinib response for the development of novel treatment lapatinib-focussed treatment strategies.
HER2-overexpressing SKBR3 breast cancer cells were treated with lapatinib for 12 hours and the resultant proteome analyzed by a comprehensive ion-current-based LC-MS strategy.
Among the 1224 unique protein identified from SKBR3 cell lysates, 67 showed a significant change in protein abundance in response to lapatinib. Of these, CENPE a centromeric protein with increased abundance, was chosen for further validation. Knockdown and inhibition of CENPE demonstrated that CENPE enhances SKBR3 cell survival in the presence of lapatinib.
Based on this study, CENPE inhibitors may warrant further investigation for use in combination with lapatinib.
Author Contributions
Academic Editor: Bobbie-Jo M. Webb-Robertson, Senior Research Scientist, Pacific Northwest National Laboratory, Computational biology and Bio-informatics, P.O. Box 999, K9-70 Richland, WA, USA.
Checked for plagiarism: Yes
Review by: Single-blind
Copyright © 2013 Kathleen O’Connell, et al.
 This is an open-access article distributed under the terms of the Creative Commons Attribution License, which permits unrestricted use, distribution, and reproduction in any medium, provided the original author and source are credited.
Competing interests
The authors have declared that no competing interests exist.
Citation:
Introduction
HER2, a member of the Human Epidermal growth factor Receptor (HER) family, is overexpressed in approximately 25% of breast cancers, resulting in the constitutive activation of tyrosine kinase signalling driving tumour cell growth 1. This plays a crucial role in cancer pathogenesis and is associated with increased tumour invasiveness and poor prognosis 2, 3, 4.
Lapatinib (GW572016, GlaxoSmithKline Kline, Research Triangle Park, NC), acts as a dual tyrosine kinase inhibitor of EGFR and HER-2 competing with adenosine triphosphate for its binding site on these receptors. This inhibits phosphorylation of EGFR and HER2, with downstream effects on cell survival and proliferation 5. In 2007, the US FDA approved lapatinib in combination with capecitabine for second line treatment of HER2-positive breast cancer patients 6.
Proteomics has been used to identify different breast cancer subtypes 7, 8, and to identify HER2 signalling proteins 9. Genomic profiles of lapatinib response in breast cancer have been carried out, however, no proteomic studies have been published to date 10, 11. Characterisation of cellular responses to lapatinib may have significant importance for the identification of markers of lapatinib response and to identify potential drug targets made available by lapatinib treatment thereby improving efficacy. Identification of drug-responsive proteins via proteomics approaches remains highly challenging, due to the wide dynamic range of a typical cellular proteome and the fact that most regulatory proteins are of lower abundance 12, 13. In order to achieve high proteomic coverage and accurate quantification, a comprehensive and reproducible ion-current-based proteomic expression profiling strategy developed in our lab 14, 15, 16, was employed for the quantification of the response of the SKBR3 cell line to lapatinib.
Materials and Methods
Cell Culture
The breast cancer cell lines SKBR3, BT474, EFM-192a, HCC1954, JIMT-1, UACC-732 and MDA-MB-453 were maintained in RPMI-1640 supplemented with 10% FBS. The SKBR3, BT474, and EFM-192a cell lines are lapatinib sensitive, with IC50 values below 1µM, while JIMT-1, UACC-732 and MDA-MB-453 are lapatinib-insensitive, with IC50 values >1µM 17.
Drug treatments were applied singly or in combinations as follows Laptinib 1µM (Sequoia Sciences, Saint Louis, MO, USA), 150 nM Herceptin (Roche IN, USA), 150 nM Afatinib (Sequoia Sciences) and 20 µM capecitabine (Sigma-Aldrich. St.Loius, MO, USA). Cell pellets were collected pre- and post-drug treatment and lysed in 50 mM Tris, pH 8, 150 mM NaCl, 2% NP-40, 0.5% sodium deoxycholate, and 0.1% SDS. For Western blot, cell lysates were centrifuged at 16,000 g for 20 minutes, after 12 hours of drug exposure. For mass spectrometry (MS), the protein lysate was clarified by ultracentrifugation (140,000g, 40 min, 4 °C). Protein concentration was determined by the BCA protein assay kit (Thermo Fischer Scientific, Rockford, IL USA).
IC50 assays were carried out on the SKBR3 cell line with UA62784 (Sigma-Aldrich) at concentrations of 25nM to 300nM and GSK2923295a (Cytokinetics Inc.) at concentrations of 6nM to 300nM. Combination assays were also carried out at these concentrations with 50nM Lapatinib. Drug treatments were carried out 24 hours after cells were seeded (4*104 cells/96 well) and cell survival measured 5 days later by acid phosphatase assays 18.
LC-MS/MS
Cell lysates from the SKBR3 cell line (+/- 12 hours 1µM lapatinib, n=6 biological replicates) were tryptically digested using an on-pellet-digestion procedure described previously 15. A customised nano-LC system 15, was used to separate peptides during a 5-hour LC gradient on a 50 cm 75 µm i.d, C18, 3 µm, 100A column. Mobile phase A was 0.1% formic acid in 2% acetonitrile and mobile phase B was 0.1% formic acid in 84% acetonitrile. The flow rate was 250 nL/min and the gradient profile was (i) a linear increase from 3% to 10% B over 5 min; (ii) an increase from 10 to 24% B over 115 min; (iii) an increase from 24 to 38% B over 70 min; (iv) an increase from 38 to 60% B over 50 min; (v) an increase from 60 to 97% B in 35 min, and finally (vi) isocratic at 97% B for 25 min. The optimal loading amount of peptide was identified experimentally and a loading mass of 6 µg per injection was employed per sample.
LTQ/ Orbitrap data was acquired over a period of 275 minutes, one scan cycle included an MS1 scan (m/z 300-2000) at a resolution of 60 000 followed by seven MS2 scans by LTQ, to fragment the seven most abundant precursors. The target value for MS1 by Orbitrap was 4 × 10⁶. The fragmentation type was CID with a normalized collision energy of 35%.
Relative Quantification of Protein Changes Via Ion-Current-Based Strategies.
Sieve (Fiona build, v. 1.2, Thermo Scientific), was used for quantitative data analysis. All peptides differing significantly between the control and treated (Fisher’s combined probability test, p-value < 0.05) were selected for protein identification. Relative abundance of an individual protein was calculated as the mean AUC ratio for all peptides derived from that protein. Protein ratios were defined as the average abundance of a protein in lapatinib treated samples/control samples. This number was divided into 1 to be converted into +/- fold changes. Identifications were matched against a non-redundant human database derived from the Swissprot database (Feb 2010). The precursor mass tolerance was set to 25 ppm and a mass tolerance of 1.0 Da; fixed modification was carbamidomethyl and variable modifications methionine oxidation. Requirements for a successful identification was matching of at least 2 unique peptides, a peptide probability of >95%, a protein probability of >99% and Sequest restrictions of deltaCn scores of greater than 0.10 and XCorr scores that achieves a 0.5% peptide FDR were employed.
Analysis of Protein Localisation and Cellular Processes
Raw LC/MS data was also analysed using Scaffold 3 software (Portland, OR) with protein identifications carried out through the Sequest server, as described above. GO annotations were retrieved from a human non-redundant Uniprot database and protein cellular localisation and cell processes represented as a percentage of the overall GO annotations retrieved.
Western Blotting
Equal quantities of protein lysates pre- and post-drug treatment (n=3 biological replicates) were subjected to Western blotting 19. Antibody binding was visualised by incubating the blot for 5 minutes with ECL Plus Western Blotting Detection substrate (RPN2132, GE Healthcare, PA, USA) and florescence emission captured by scanning blots at 457 nm excitation, 520 nm emission (PMT 450) on a Typhoon Variable Trio 9400 scanner. Antibodies for TET2 (S-13, sc-136926), HER2 (3B5, ab16901), CENPE (C-7488) and b-actin (A3854) were purchased from Santa Cruz Biotechnologies (CA, USA), Abcam (Cambridge, UK) and Sigma-Aldrich respectively.
qRT-PCR
qRT-PCR was carried out as previously described 10. RNA was isolated with Rneasy Mini kit (Qiagen, CA, USA, n=3 biological replicates). Primers, buffer and dNTPs were supplied by a High Capacity cDNA Reverse Transcription kit (Applied Biosystems). CENPE specific FAM-labelled primer (Hs0106824_m1, Applied Biosystems) was used to quantify CENPE cDNA by qPCR; GAPDH specific FAM label primer (Hs9999905_m1) was used to measure GAPDH cDNA, which acted as an endogenous control.
siRNA
3x10⁴ SKBR3 cells/well were transfected over 24 hours, in a 24 well plate, using 1 µl siPORT Neofx transfection reagent (Applied Biosystems). siRNA knockdown was performed using 30nM scrambled control (Negative Control #2, Applied Biosystems), and 30nM CENPE siRNA (S2917, Applied Biosystems). Neofx was incubated with serum free Optimem media for 10 minutes, mixed with diluted siRNA, and incubated for another 10 mins. The Neofx-siRNA mix was then applied to cells. Post-24 hours fresh media +/- 100nM lapatinib was added to transfected cells; drug treatments lasted 5 days. Cells were then trypsinised and incubated with 1 part cell suspension: 3 parts Guava viacount reagent and incubated in the dark for 5 minutes before viable cells were counted on a Guava Easycyte (EMD Millipore, MA, USA).
Results
Label-Free Profiling of the Response to Lapatinib
A comprehensive, in-depth proteomic investigation is essential for a study of this nature. As the whole cell lysate is highly complex, a large number of tryptic peptides are retrieved by the on-pellet digestion procedure. To achieve sufficient chromatographic separation, high run-to-run reproducibility of retention times we employed a custom nano-LC/nanospray configuration.
In total, 1224 unique proteins were identified with high confidence and subsequently quantified. The full list of the proteins analyzed in this study, as well as the information on the peptides identified, is shown in SI Table 1. Among the 1224 protein analyzed, quantitative proteomic profiling of the SKBR3 cell line revealed an altered abundance of 67 proteins in lapatinib-treated compared to untreated cells. Of these, 21 demonstrated an increased abundance and 46 a decreased abundance in the treated cells. The cut-off for biomarker discovery was based on the calculation of the false-positive biomarker discovery rate, as described in our previous publications 14, 15. Listed in Table 1, divided by function, are the protein names, number of peptides, p-values, and fold change of these proteins.
Table 1. List of proteins identified to have altered protein abundance in response to lapatinib, grouped according to biological function| Uniprot I.D | Protein | No of Unique Peptides | p-value | Fold Change | ||||||||||
| Metabolic | ||||||||||||||
| Q15111 | PLCL1 Inactive phospholipase C-like protein 1 | 2 | 1.60E-02 | 1.47 | ||||||||||
| O95861 | BPNT1 3_(2_),5_-bisphosphate nucleotidase 1 | 2 | 2.30E-02 | 1.37 | ||||||||||
| P30038 | AL4A1 Delta-1-pyrroline-5-carboxylate dehydrogenase, mitochondrial | 3 | 1.70E-03 | -1.36 | ||||||||||
| P07205 | PGK2 Phosphoglycerate kinase 2 | 4 | 4.90E-02 | -1.39 | ||||||||||
| Q9Y6M9 | NDUB9 NADH dehydrogenase ubiquinone 1 beta subcomplex subunit 9 | 2 | 4.70E-02 | -1.41 | ||||||||||
| P49327 | FAS Fatty acid synthase | 48 | 1.00E-05 | -1.44 | ||||||||||
| P06733 | ENOA Alpha-enolase | 12 | 1.90E-02 | -2.7 | ||||||||||
| Cytoskeletal | ||||||||||||||
| Q8IWC1 | MA7D3 MAP7 domain-containing protein 3 | 2 | 1.10E-02 | 1.61 | ||||||||||
| Q96JE9 | MAP6 Microtubule-associated protein 6 | 2 | 4.90E-03 | 1.5 | ||||||||||
| P09493 | TPM1 Tropomyosin alpha-1 chain | 9 | 4.70E-03 | -1.35 | ||||||||||
| P17661 | DESM Desmin | 3 | 9.90E-20 | -1.41 | ||||||||||
| P02538 | K2C6A Keratin, type II cytoskeletal 6A | 5 | 8.40E-06 | -1.35 | ||||||||||
| P48668 | K2C6C Keratin, type II cytoskeletal 6C | 4 | 1.50E-06 | -1.35 | ||||||||||
| P04259 | K2C6B Keratin, type II cytoskeletal 6B | 4 | 1.50E-06 | -1.35 | ||||||||||
| P41219 | PERI Peripherin | 2 | 9.90E-20 | -1.39 | ||||||||||
| Q27J81 | INF2 Inverted formin-2 | 2 | 9.60E-03 | -1.63 | ||||||||||
| Metabolic | ||||||||||||||
| Q15111 | PLCL1 Inactive phospholipase C-like protein 1 | 2 | 1.60E-02 | 1.47 | ||||||||||
| O95861 | BPNT1 3_(2_),5_-bisphosphate nucleotidase 1 | 2 | 2.30E-02 | 1.37 | ||||||||||
| P30038 | AL4A1 Delta-1-pyrroline-5-carboxylatedehydrogenase, mitochondrial | 3 | 1.70E-03 | -1.36 | ||||||||||
| P07205 | PGK2 Phosphoglycerate kinase 2 | 4 | 4.90E-02 | -1.39 | ||||||||||
| Q9Y6M9 | NDUB9 NADH dehydrogenase ubiquinone 1 beta subcomplex subunit 9 | 2 | 4.70E-02 | -1.41 | ||||||||||
| P49327 | FAS Fatty acid synthase | 48 | 1.00E-05 | -1.44 | ||||||||||
| P06733 | ENOA Alpha-enolase | 12 | 1.90E-02 | -2.7 | ||||||||||
| Cytoskeletal | ||||||||||||||
| Q8IWC1 | MA7D3 MAP7 domain-containing protein 3 | 2 | 1.10E-02 | 1.61 | ||||||||||
| Q96JE9 | MAP6 Microtubule-associated protein 6 | 2 | 4.90E-03 | 1.5 | ||||||||||
| P09493 | TPM1 Tropomyosin alpha-1 chain | 9 | 4.70E-03 | -1.35 | ||||||||||
| P17661 | DESM Desmin | 3 | 9.90E-20 | -1.41 | ||||||||||
| P02538 | K2C6A Keratin, type II cytoskeletal 6A | 5 | 8.40E-06 | -1.35 | ||||||||||
| P48668 | K2C6C Keratin, type II cytoskeletal 6C | 4 | 1.50E-06 | -1.35 | ||||||||||
| P04259 | K2C6B Keratin, type II cytoskeletal 6B | 4 | 1.50E-06 | -1.35 | ||||||||||
| P41219 | PERI Peripherin | 2 | 9.90E-20 | -1.39 | ||||||||||
| Q27J81 | INF2 Inverted formin-2 | 2 | 9.60E-03 | -1.63 | ||||||||||
| Chromatin Organization | ||||||||||||||
| P0C0S8 | H2A1 Histone H2A type 1 | 4 | 2.20E-16 | -2.05 | ||||||||||
| P20671 | H2A1D Histone H2A type 1-D | 4 | 2.20E-16 | -2.05 | ||||||||||
| Q16777 | H2A2C Histone H2A type 2-C | 4 | 2.20E-16 | -2.05 | ||||||||||
| Q6FI13 | H2A2A Histone H2A type 2-A | 4 | 2.20E-16 | -2.05 | ||||||||||
| Q96KK5 | H2A1H Histone H2A type 1-H | 4 | 2.20E-16 | -2.05 | ||||||||||
| Q99878 | H2A1J Histone H2A type 1-J | 4 | 2.20E-16 | -2.05 | ||||||||||
| Q9BTM1 | H2AJ Histone H2A.J | 4 | 2.20E-16 | -2.05 | ||||||||||
| P68431 | H31 Histone H3.1 | 4 | 1.50E-04 | -2.11 | ||||||||||
| P84243 | H33 Histone H3.3 | 4 | 1.50E-04 | -2.11 | ||||||||||
| Q16695 | H31T Histone H3.1t | 4 | 1.50E-04 | -2.11 | ||||||||||
| Q71DI3 | H32 Histone H3.2 | 4 | 1.50E-04 | -2.11 | ||||||||||
| P10412 | H14 Histone H1.4 | 5 | 4.10E-11 | -2.54 | ||||||||||
| P16402 | H13 Histone H1.3 | 5 | 4.10E-11 | -2.54 | ||||||||||
| P16403 | H12 Histone H1.2 | 5 | 4.10E-11 | -2.54 | ||||||||||
| P22492 | H1T Histone H1t | 2 | 3.60E-05 | -7.15 | ||||||||||
| Q02539 | H11 Histone H1.1 | 2 | 3.60E-05 | -7.15 | ||||||||||
| Chaperone | ||||||||||||||
| Q9H1H9 | KI13A Kinesin-like protein KIF13A | 2 | 4.20E-02 | 1.45 | ||||||||||
| Q92688 | AN32B Acidic leucine-rich nuclear phosphoprotein 32 family member B | 3 | 5.60E-03 | 1.33 | ||||||||||
| O75165 | DJC13 DnaJ homolog subfamily C member 13 | 2 | 2.20E-02 | -1.39 | ||||||||||
| P11142 | HSP7C Heat shock cognate 71 kDa protein | 20 | 9.90E-20 | -1.67 | ||||||||||
| Q15185 | TEBP Prostaglandin E synthase 3 | 3 | 9.00E-03 | -1.89 | ||||||||||
| Protein Biosynthesis and Degradation | ||||||||||||||
| P62195 | PRS8 26S protease regulatory subunit 8 | 2 | 6.00E-04 | 2.07 | ||||||||||
| P46778 | RL21 60S ribosomal protein L21 | 2 | 1.40E-10 | 1.36 | ||||||||||
| P36952 | SPB5 Serpin B5 | 1 | 3.90E-02 | 1.36 | ||||||||||
| P26641 | EF1G Elongation factor 1-gamma | 10 | 2.20E-04 | -1.36 | ||||||||||
| O00303 | EIF3F Eukaryotic translation initiation factor 3 subunit F | 2 | 2.60E-02 | -1.37 | ||||||||||
| P58546 | MTPN Myotrophin | 3 | 4.20E-03 | -1.42 | ||||||||||
| O75153 | EIF3X Putative eukaryotic translation initiation factor 3 subunit | 2 | 2.10E-02 | -1.43 | ||||||||||
| Q13310 | PABP4 Polyadenylate-binding protein 4 | 3 | 1.90E-04 | -1.48 | ||||||||||
| P62241 | RS8 40S ribosomal protein S8 | 6 | 6.60E-04 | -1.71 | ||||||||||
| RNA processing and Transcriptional Regulation | ||||||||||||||
| Q9UNQ2 | DIMT1 Probable dimethyladenosine transferase | 2 | 2.30E-02 | 2.32 | ||||||||||
| P17096 | HMGA1 High mobility group protein HMG-I/HMG-Y | 2 | 9.40E-07 | 1.68 | ||||||||||
| P42696 | RBM34 RNA-binding protein 34 | 2 | 3.60E-03 | 1.56 | ||||||||||
| P17844 | DDX5 Probable ATP-dependent RNA helicase DDX5 | 9 | 5.90E-03 | -1.36 | ||||||||||
| Q9BYG3 | MK67I MKI67 FHA domain-interacting nucleolar phosphoprotein | 2 | 4.10E-02 | -1.42 | ||||||||||
| Q9NYV4 | CD2L7 Cell division cycle 2-related protein kinase 7 | 5 | 5.00E-02 | -1.44 | ||||||||||
| P84090 | ERH Enhancer of rudimentary homolog | 2 | 5.00E-02 | -1.99 | ||||||||||
| Kinase activity | ||||||||||||||
| Q15303 | ERBB4 Receptor tyrosine-protein kinase erbB-4 | 2 | 2.70E-09 | 1.47 | ||||||||||
| P35590 | TIE1 Tyrosine-protein kinase receptor Tie-1 | 2 | 1.60E-02 | 1.36 | ||||||||||
| P30085 | KCY UMP-CMP kinase | 2 | 2.80E-02 | 1.34 | ||||||||||
| Homeostasis | ||||||||||||||
| P20073 | ANXA7 Annexin A7 | 3 | 4.30E-04 | 1.46 | ||||||||||
| P08195 | 4F2 4F2 cell-surface antigen heavy chain | 9 | 1.80E-02 | -1.45 | ||||||||||
| P62158 | CALM Calmodulin | 3 | 2.50E-02 | -1.58 | ||||||||||
| Cell adhesion | ||||||||||||||
| P09382 | LEG1 Galectin-1 | 3 | 1.20E-05 | 1.61 | ||||||||||
| Q9Y446 | PKP3 Plakophilin-3 | 3 | 3.20E-02 | -1.39 | ||||||||||
| Apoptosis | ||||||||||||||
| Q13501 | SQSTM Sequestosome-1 | 4 | 5.80E-05 | -1.46 | ||||||||||
| Methylation | ||||||||||||||
| Q6N021 | TET2_HUMAN Protein TET2 | 2 | 3.10E-03 | 1.92 | ||||||||||
| O95785 | WIZ Protein Wiz | 2 | 3.60E-02 | 1.47 | ||||||||||
| Centromeric | ||||||||||||||
| Q02224 | CENPE Centromeric protein E | 2 | 5.10E-02 | 2.31 | ||||||||||
| Q9Y6A5 | TACC3 Transforming acidic coiled-coil-containing protein 3 | 2 | 2.80E-03 | 1.75 | ||||||||||
| Unknown Function | ||||||||||||||
| Q15847 | APM2 Adipose most abundant gene transcript 2 protein | 2 | 1.50E-02 | -8.28 | ||||||||||
A Gene Ontology (GO) analysis of the identified proteins was performed using DAVID Bioinformatics Resources 6.7 (http://david.abcc.ncifcrf.gov/). A large number of proteins from plasma membrane and various organelles were identified indicating a comprehensive protein recovery by our gel-free sample preparation procedure 1A).
Figure 1A.Classifications of the 1224 unique proteins by Biological process, Cellular Compartment and Molecular function.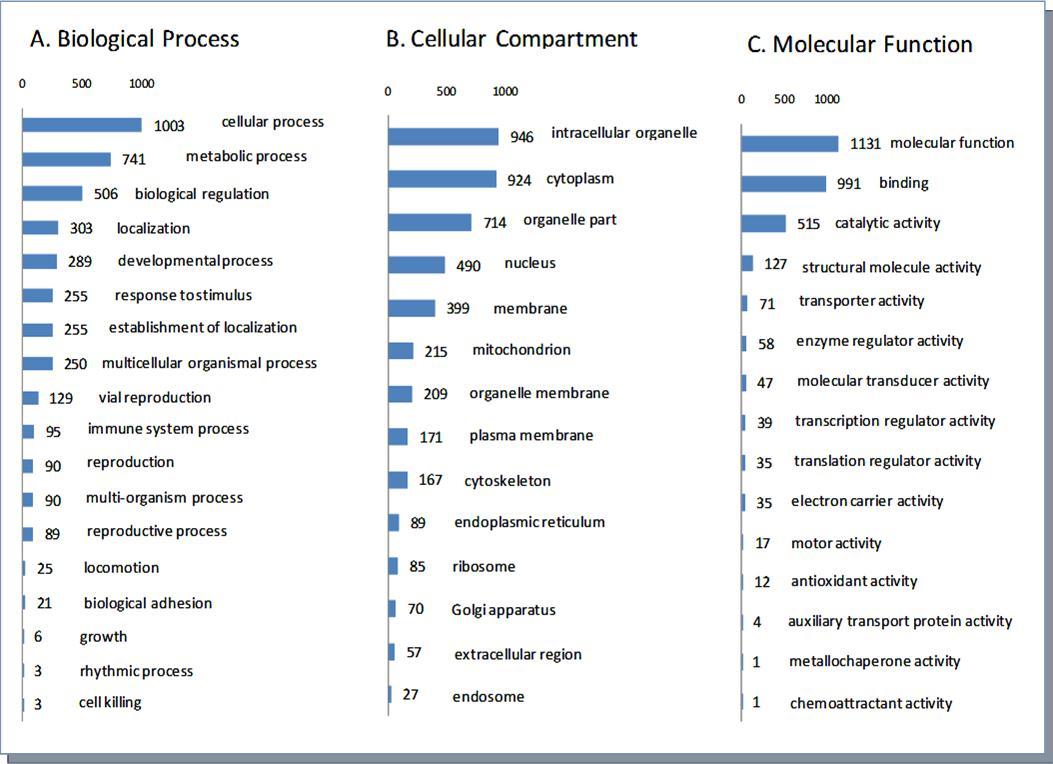
HER2 and TET2 were chosen for validation of LC-MS/MS data by Western blot. Both proteins were assessed in 7 cell lines (4 sensitive to lapatinib, 3 insensitive), Figure 1B. While TET2 was significantly changed in all 4 lapatinib sensitive cell lines, and not in the insensitive, HER2 only showed a significant increase in the SKBR3 cell line (p<0.05).
Figure 1B.TET2 and HER2 expression, in the absence (-) or presence (+) of 1µM lapatinib after 12 hours, in lapatinib sensitive cell lines and lapatinib insensitive cell lines (highlighted in bold) C) TET2 and D) HER2 densitometry. Fold change = Control vs. Lapatinib treated. * represents significance at p<0.05 by Students t-test.
Validation of Increased CENPE Protein
CENPE, a protein with increased abundance (2.3 fold) in lapatinib-treated cells was also chosen for validation as it represented a possible target for therapeutic intervention as a specific drug-based inhibitor was available. Changes to CENPE abundance were assessed by Western blot (Figure 2A) with significant increases found in 4 lapatinib-sensitive cell lines (p<0.05). Additionally, qRT-PCR analysis, carried out to assess if any related changes were occurring in mRNA expression (Figure 2B), showed significant increases in CENPE mRNA in 4 lapatinib-sensitive cell lines (Figure 2B).
Figure 2.Expression of CENPE, in the absence (-) or presence (+) of 1µM lapatinib after 12 hours, in lapatinib sensitive cell lines and lapatinib insensitive cell lines (highlighted in bold). A) By western blot including densitometric measurement of protein fold change (control vs. Lapatinib treated). B) qRT-PCR measurement of expression changes of mRNA (control vs. Lapatinib treated) * represents significance at p<0.05 ** at p<0.01 by Students t-test
Alterations in CENPE in Response to other HER2 Targeted Agents
To determine if this trend of increased CENPE abundance was purely a lapatinib drug response, or if CENPE could alter the toxicological response to lapatinib in a clinically-relevant manner, CENPE protein levels were tested in response to a) other HER2 targeting agents and b) clinically relevant combinations of lapatinib with other drugs. In the SKBR3 and BT474 cell lines both afatinib (irreversible HER2 and EGFR inhibitory small molecule agent) and trastuzumab (HER2-inhibitory monoclonal antibody) treatment alone resulted in significantly decreased CENPE protein abundance, in contrast to lapatinib alone treatment (Figure 3).
Figure 3.A).CENPE protein expression in response to a 12 hour treatment with 150nM Afatinib, 150nM Trastuzumab (Her), 150nM Trastuzumab + 1µM Lapatinib (Lap) and 1µM Lapatinib + 20µM Capecitabine (Cap) with densitometric measurement of fold change (control vs. drug treated) in B) the SKBR3 cell line and C) the BT474 cell line. * represents significance at p<0.05 ** at p<0.01 by Students t-test
In contrast to the decreases shown when cells were treated by trastuzumab alone, the combination of lapatinib and trastuzumab resulted in 2-3 fold increases in CENPE protein in both the SKBR3 and BT474 cell lines (Figure 3). The combination of lapatinib and capecitabine also resulted in a similar increase in CENPE protein in both cell lines (Figure 3).
CENPE Inhibition in Combination with Lapatinib
To evaluate if the combination of lapatinib and CENPE inhibition resulted in decreased cell growth, compared to either lapatinib alone or CENPE inhibition alone, siRNA knockdown of CENPE was carried out.
Knockdown of CENPE in SKBR3 cells resulted in approximately a 70% decrease in CENPE protein after 5 days (Figure 4A). This treatment had very little effect on cell survival (<1%). Lapatinib-treated cells showed a 63% decrease in cell survival. The combination of lapatinib and CENPE knockdown resulted in a even greater decrease in cell survival of 85% (Figure 4A).
Figure 4.A) The effect of CENPE knockdown by siRNA, with and without 100nM Lapatinib, on cell viability. Knockdown of CENPE expression confirmed by western blot. B) Effect on cell viability (after 5 days) by the CENPE inhibitor UA62784, alone and in combination with 50nM Lapatinib. C) Effect on cell viability (after 5 days) by the CENPE inhibitor GSK923295A, alone and in combination with 50nM Lapatinib. * represents significance at p<0.05 ** at p<0.01 by Students t-test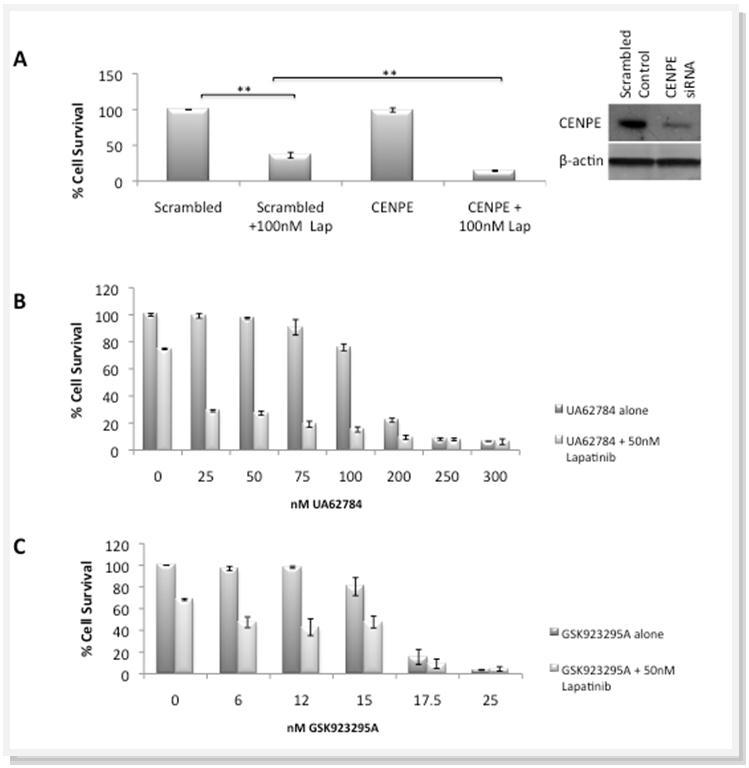
To determine if small molecule inhibitors would demonstrate a similar effect as siRNA, UA62784, a laboratory grade inhibitor of CENPE, was tested alone in the nM range (0-300nM) and in combination with 50nM lapatinib. The IC50 value of UA62784 in the SKBR3 cell line was 144nM, comparable but slightly higher than those published for other cancer cell lines 20. At the lower nM ranges of UA63784, the addition of lapatinib resulted in significant decreases in cell survival compared to lapatinib or UA63784 alone (Figure 4B); the IC50 value of UA63784 when in combination with lapatinib dropped to 15nM.
The IC50 for another CENPE inhibitor, GSK23295A alone was lower at 16nM, than for UA62784 alone. Combination of this agent with 50 nM lapatinib resulted in an IC50 of 5nM for GSK23295A. Again at the lower end of the treatment range the combination of lapatinib and GSK23295A displayed synergy (Figure 4C).
Discussion
In order to further understand how lapatinib treatment affects HER2 positive cells we studied lapatinib-sensitive SKBR3 cells, in the absence and presence of lapatinib, by LC-MS using a highly optimised and reproducible ion-current strategy 15.
This approach resulted in the identification of 67 proteins that had altered abundance in response to lapatinib treatment. Western blotting analysis of two proteins, HER2 and TET2, confirmed the accuracy of MS results for the SKBR3 and highlighted the importance of validating results in multiple cells lines. CENPE, a mitotic checkpoint protein, acts as a kinesin-like motor protein aiding in the segregation of chromosomes and plays a role in the mitotic checkpoint by binding to and regulating activation of BUBR1 21, 22. CENPE is present in normal cells at low levels during G1 and accumulates during late G2 and M-phases 23. It is over expressed in invasive breast tumours compared to normal breast tissue 24. There is no known association of CENPE with HER2 nor with lapatinib response. In this study, CENPE demonstrated increased protein and mRNA abundance in lapatinib sensitive breast cancer cells after treatment with Lapatinib. This CENPE response seems to be specific to lapatinib as other HER2 targeting drugs, namely afatinib and trastuzumab, did not result in increased CENPE expression. Lapatinib is currently administered with capecitabine 6 and is undergoing testing in combination with trastuzumab 25, the combination of either drug with lapatinib resulted in increased CENPE protein. This suggests that lapatinib, even when administered with additional anti-cancer agents, will result in increased CENPE expression.
Previous studies have shown that it is possible to target alterations that occur in a cell in response to a drug, further sensitising the treated cells to that drug 26, 27. As kinesins and kinesin-like proteins represent promising molecular targets in cancer it was decided to investigate the effect of CENPE inhibition on lapatinib-treated SKBR3 cells 28.
Reduction of CENPE expression has been implicated in tumour formation, however, it seems to have contradictory roles, both promoting tumourogensis at low levels of genomic instability (specifically ploidy) and inhibiting tumourogensis when a higher threshold is reached 29. siRNA knockdown of CENPE results in arrest at the G2/M phase of the cell cycle 30. CENPE inhibition by siRNA had a greater effect on lapatinib-treated cells than lapatinib alone. As small molecule inhibitors and monoclonal antibodies remain the current platform for targeted therapies, and may represent more efficient inhibition of target activity than siRNA, two small molecule drugs, UA62784 20 and GSK923295A 31 were applied to SKBR3 cells alone and in combination with lapatinib. Initial publication of UA62784 data suggest that it is a specific inhibitor of CENPE but this has subsequently been challenged 32; no such controversy exists with regards to GSK923295A. Both UA62784 and GSK923295A demonstrated synergy in combination with lapatinib. The data suggests CENPE inhibition in combination with lapatinib may, with further investigation, be a novel treatment strategy. Should UA62784 ultimately prove to be a microtubule inhibitor, as suggested, lapatinib may sensitise HER2 positive breast cancer cells to a wider range of microtubule and mitotic checkpoint protein inhibitors.
Acknowledgements
The authors wish to thank the Science Foundation Ireland, Strategic Research Cluster award to Molecular Therapeutics for Cancer Ireland (award 08/SRC/B1410) for funding this work.
References
- 1.Slamon D J, Leyland-Jones B, Shak S, Fuchs H, Paton V et al.Use of chemotherapy plus a monoclonal antibody against HER2 for metastatic breast cancer that overexpresses HER2. , N Engl J Med.2001Mar15; 344(11), 783-92.
- 2.Hudziak R M, Schlessinger J, Ullrich A.Increased expression of the putative growth factor receptor p185HER2 causes transformation and tumorigenesis of NIH 3T3 cells. Proc Natl Acad Sci U S A.1987Oct; 84(20), 7159-63.
- 3.Woods Ignatoski KM, Grewal N K, Markwart S, Livant D L, Ethier S P.p38MAPK induces cell surface alpha4 integrin downregulation to facilitate erbB-2-mediated invasion. , Neoplasia.2003Mar-Apr; 5(2), 128-34.
- 4.Toikkanen S, Helin H, Isola J, Joensuu H.Prognostic significance of HER-2 oncoprotein expression in breast cancer: a 30-year follow-up. , J Clin Oncol.1992Jul; 10(7), 1044-8.
- 5.Rusnak D W, Affleck K, Cockerill S G, Stubberfield C, Harris R et al.The characterization of novel, dual ErbB-2/EGFR, tyrosine kinase inhibitors: potential therapy for cancer. Cancer Res.2001Oct1;. 61(19), 7196-203.
- 6.Ryan Q, Ibrahim A, Cohen M H, Johnson J, Ko C W et al.FDA drug approval summary: lapatinib in combination with capecitabine for previously treated metastatic breast cancer that overexpresses HER-2. , Oncologist.2008Oct; 13(10), 1114-9.
- 7.Chen H, Pimienta G, Gu Y, Sun X, Hu J et al.Proteomic characterization of Her2/neu-overexpressing breast cancer cells. , Proteomics.Nov; 10(21), 3800-10.
- 8.Lu M, Whelan S A, He J, Saxton R E, Faull K F et al.Hydrophobic Proteome Analysis of Triple Negative and Hormone-Receptor-Positive-Her2-Negative Breast Cancer by Mass Spectrometer. Clin Proteomics.Sep;. 6(3), 93-103.
- 9.Bose R, Molina H, Patterson A S, Bitok J K, Periaswamy B et al.Phosphoproteomic analysis of Her2/neu signaling and inhibition. Proc Natl Acad Sci U S A.2006Jun27; 103(26), 9773-8.
- 10.O'Neill F, Madden S F, Aherne S T, Clynes M, Crown J et al.Gene expression changes as markers of early lapatinib response in a panel of breast cancer cell lines. , Mol Cancer.Jun18; 11(1), 41.
- 11.Hegde P S, Rusnak D, Bertiaux M, Alligood K, Strum J et al.Delineation of molecular mechanisms of sensitivity to lapatinib in breast cancer cell lines using global gene expression profiles. Mol Cancer Ther.2007May;. 6(5), 1629-40.
- 12.Qu J, Jusko W J, Straubinger R M.Utility of cleavable isotope-coded affinity-tagged reagents for quantification of low-copy proteins induced by methylprednisolone using liquid chromatography/tandem mass spectrometry. , Anal Chem.2006Jul1; 78(13), 4543-52.
- 13.Anderson D C, Campbell E L, Meeks J C.A soluble 3D LC/MS/MS proteome of the filamentous cyanobacterium Nostoc punctiforme. , J Proteome Res.2006Nov; 5(11), 3096-104.
- 14.Qu J, Lesse A J, Brauer A L, Cao J, Gill S R et al. (2010) Proteomic expression profiling of Haemophilus influenzae grown in pooled human sputum from adults with chronic obstructive pulmonary disease reveal antioxidant and stress responses. , BMC Microbiol 10, 162.
- 15.Duan X, Young R, Straubinger R M, Page B, Cao J et al.A straightforward and highly efficient precipitation/on-pellet digestion procedure coupled with a long gradient nano-LC separation and Orbitrap mass spectrometry for label-free expression profiling of the swine heart mitochondrial proteome. , J Proteome Res.2009Jun; 8(6), 2838-50.
- 16.Vagin Wohlschlegel J, Qu J, Jonsson Z, Huang X, Chuma S.Proteomic analysis of murine Piwi proteins reveals a role for arginine methylation in specifying interaction with Tudor family members. Genes Dev.2009Aug1;. 23(15), 1749-62.
- 17.O'Brien N A, Browne B C, Chow L, Wang Y, Ginther C et al. () Activated phosphoinositide 3-kinase/AKT signaling confers resistance to trastuzumab but not lapatinib. Mol Cancer Ther. 9(6), 1489-502.
- 18.Martin A, Clynes M.Acid phosphatase: endpoint for in vitro toxicity tests. In Vitro Cell Dev Biol.1991Mar;27A(3Pt1): 183-4.
- 19.O'Connell K, Prencipe M, O'Neill A, Corcoran C, Rani S et al.The use of LC-MS to identify differentially expressed proteins in docetaxel-resistant prostate cancer cell lines. , Proteomics.Jul; 12(13), 2115-26.
- 20.Henderson M C, Shaw Y J, Wang H, Han H, Hurley L H et al.UA62784, a novel inhibitor of centromere protein E kinesin-like protein. Mol Cancer Ther.2009Jan;. 8(1), 36-44.
- 21.Mao Y, Abrieu A, Cleveland D W.Activating and silencing the mitotic checkpoint through CENP-E-dependent activation/inactivation of BubR1. Cell.2003Jul11;. 114(1), 87-98.
- 22.Abrieu A, Kahana J A, Wood K W, Cleveland D W.CENP-E as an essential component of the mitotic checkpoint in vitro. , Cell.2000Sep15; 102(6), 817-26.
- 23.Brown K D, Coulson R M, Yen T J, Cleveland D W.Cyclin-like accumulation and loss of the putative kinetochore motor CENP-E results from coupling continuous synthesis with specific degradation at the end of mitosis. , J Cell Biol.1994Jun; 125(6), 1303-12.
- 24.Bieche I, Vacher S, Lallemand F, Tozlu-Kara S, Bennani H et al.Expression analysis of mitotic spindle checkpoint genes in breast carcinoma: role of NDC80/HEC1 in early breast tumorigenicity, and a two-gene signature for aneuploidy. , Mol Cancer 10, 23.
- 25.Baselga J, Bradbury I, Eidtmann H, S Di Cosimo, E de Azambuja et al.Lapatinib with trastuzumab for HER2-positive early breast cancer (NeoALTTO): a randomised, open-label, multicentre, phase 3 trial. , Lancet.Feb18; 379(9816), 633-40.
- 26.Astsaturov I, Ratushny V, Sukhanova A, Einarson M B, Bagnyukova T et al.Synthetic lethal screen of an EGFR-centered network to improve targeted therapies. , Sci Signal 3(140), 67.
- 27.Azorsa D O, Gonzales I M, Basu G D, Choudhary A, Arora S et al. (2009) Synthetic lethal RNAi screening identifies sensitizing targets for gemcitabine therapy in pancreatic cancer. , J Transl Med 7, 43.
- 28.Huszar D, Theoclitou M E, Skolnik J, Herbst R.Kinesin motor proteins as targets for cancer therapy.Cancer Metastasis Rev.2009Jun;28(1-2),197-208.
- 29.Weaver B A, Silk A D, Montagna C, Verdier-Pinard P, Cleveland D W.Aneuploidy acts both oncogenically and as a tumor suppressor. Cancer Cell.2007Jan;. 11(1), 25-36.
- 30.Tanudji M, Shoemaker J, L'Italien L, Russell L, Chin G et al.Gene silencing of CENP-E by small interfering RNA in HeLa cells leads to missegregation of chromosomes after a mitotic delay. , Mol Biol Cell.2004Aug; 15(8), 3771-81.
Cited by (1)
- 1.Peippo Minna, Gardberg Maria, Kronqvist Pauliina, Carpén Olli, Heuser Vanina D., 2023, Characterization of Expression and Function of the Formins FHOD1, INF2, and DAAM1 in HER2-Positive Breast Cancer, Journal of Breast Cancer, 26(6), 525, 10.4048/jbc.2023.26.e47