
Abstract
Colorectal cancer is one of the most commonly diagnosed cancers worldwide and its prevalence can be reduced by changes to lifestyle and diet. Fermentation of dietary fibre by the gut microbiota and formation of short chain fatty acids, in particular butyrate, is widely thought to play a role in preventing development of the disease. Despite butyrate’s known pro-apoptotic effects, a subpopulation of cancer cells is able to overcome these anti-neoplastic effects of colonic luminal butyrate to proliferate and establish tumours in vivo. In this study, a time course analysis of HT29 and HT29-BR cells treated with butyrate was conducted and global gene expression analysis was used to identify novel mechanisms associated with butyrate-induced apoptosis and in the acquisition of butyrate resistance. Bioinformatic analysis of the data identified deregulated O-GlcNAcylation activity and disruption to gene transcription by BRD4 as possible factors involved with butyrate-induced apoptosis. EGF signalling was identified as being potentially involved in the acquisition of butyrate resistance. Furthermore, the expression of the minichromosome maintenance protein family was significantly reduced in the HT29-BR cell line reflecting disruptions to the DNA replication process. Together, this may confer a unique survival advantage for cells with acquired butyrate resistance.
Author Contributions
Academic Editor: Hem D Shukla, Faculty, Department of Biology, University System of Maryland.
Checked for plagiarism: Yes
Review by: Single-blind
Copyright © 2014 Kim YC Fung, et al.
 This is an open-access article distributed under the terms of the Creative Commons Attribution License, which permits unrestricted use, distribution, and reproduction in any medium, provided the original author and source are credited.
Competing interests
The authors have declared that no competing interests exist.
Citation:
Introduction
Colorectal cancer (CRC) is one of the most commonly diagnosed cancers and the fourth most common cause of cancer death worldwide 1. It is also regarded as one of the most preventable cancers where diet and lifestyle are believed to play an important role in its prevention 2. Short chain fatty acids (SCFA) generated by fermentation of dietary fibre, in particular resistant starch, by the gut microbiota is believed to be protective against the development of CRC. Of the SCFA produced, butyrate has been consistently demonstrated to have potent anti-tumorigenic effects in vitro 3, 4, 5. Although butyrate has been shown to reduce tumour burden in animal models of CRC 6, 7, the results of human studies involving administration of resistant starch have been variable 8, 9.
Butyrate is an established histone deacetylase inhibitor (HDI) and induces apoptosis via activation of both the mitochondrial-dependent and –independent pathways. Many studies have attempted to identify the mechanisms involved in butyrate-induced apoptosis and have highlighted the complexities involved in the cellular pathways potentially responsible for butyrate’s effects 10, 11, 12, 13, 14, 15. More recently, butyrate transporters and receptors have been proposed to play a key role in mediating signalling events related to butyrate’s effects. For example, loss of expression of the SLC5A8 transporter has been reported to occur in CRC cells and this has been linked with reduced histone deacetylase activity and inversely linked with apoptosis 16. Furthermore, G protein receptors (GPR), such as GPR43 and GPR109A, with affinity for SCFA, are expressed in the colon and loss of expression occurs in CRC. Activation of GPR43 by SCFA is believed to mediate inflammation in the colon by regulating chemotaxis and migration of immune cells 17, 18 and loss of GPR43 expression has been observed in CRC 18. Similarly, GPR109A is silenced in CRC and loss of expression has been attributed to DNA methylation 19. In vitro studies have also concluded that activation of both of these receptors by butyrate inhibits proliferation and induces apoptosis 18, 19.
There is also growing interest in understanding the cellular mechanisms involved with the development or acquisition of resistance to butyrate’s pro-apoptotic effects. By circumventing apoptosis, it has been shown in vitro that tumorigenic cells are able to proliferate in the presence of butyrate 20, 21, 22, 23 and may give rise to more aggressive tumours in vivo 24, 25. In vitro models such as these are useful tools to further understand how colorectal tumours may establish in vivo, i.e., how a subset of cancer cells are able to overcome the apoptotic effects of butyrate to proliferate and form colorectal tumours in the presence of colonic luminal butyrate. These studies have proposed mechanisms of resistance that include induction of ABC transporter expression 22, development of a stress-resistant phenotype 24, 26, effects on cell cycle regulatory proteins 27, 28, suppression of Wnt signalling 29, and alterations in cellular metabolism that may occur as a consequence of butyrate transport kinetics 23.
In this study, we have conducted gene expression analysis to understand the early events in butyrate-induced apoptosis and the potential mechanisms involved in the acquisition of butyrate resistance in HT29 cells. This will provide insight into factors unique to butyrate resistant cells that enable tumorigenic potential in this subpopulation of cells.
Materials and Methods
Cell Culture
HT29 colorectal cancer cells (ATCC, Rockville, MD) were maintained in Dulbecco’s Modified Eagle’s Medium/F-12 Nutrient Mixture Media with L-glutamine (1:1; 370C; 5% CO2; Invitrogen) containing 5% fetal calf serum (FCS; Invitrogen) and 1% penicillin/streptomycin. HT29-BR cells were generated and maintained as previously described 12. For all experimental work, cells were seeded at the appropriate densities and maintained in fresh media containing 3% FCS for 48 hrs prior to harvesting at 0, 0.5, 6, 15 and 48 hrs. Cell counts were performed with a haemocytometer following trypsinisation and staining with trypan blue. At 48 hrs, apoptosis was measured using the Apo-ONE homogeneous Caspase 3/7 Assay Kit (Promega) as previously described 12. Measurements were performed in triplicate and statistical analysis of the data was performed using Prism 5.0 Software (Graph Pad, San Diego, USA).
Gene Expression Analysis
Cell culture experiments and subsequent gene expression analyses were performed in triplicate for each time point to minimize technical variability. At the appropriate time points following butyrate addition, HT29 and HT29-BR cells were harvested and RNA extracted. Untreated HT29 cells were used as the control group. Total RNA was prepared using the QIAGEN RNeasy Plus Mini Kit (QIAGEN, Valencia, CA) according to the manufacturer protocols. The RNA integrity and concentration for each sample was assessed using the Agilent BioAnalyzer. Samples with RNA integrity greater than 7 were used for analysis.
Human Exon 1.0ST arrays (Affymetrix Inc., Santa Clara, CA) were used for gene expression analysis and processed according to manufacturer protocols. Analysis of microarray data was performed using the Partek Genomics Suite (v6.6, Partek Inc., St Louis, MO) as previously described30. Differential gene expression was considered significant when the false discovery rate (FDR) <1% and when the fold change in expression was greater than ±2. Ingenuity Pathway Analysis (Ingenuity Systems, Inc., Redwood City, CA) was used to identify potential relationships between differentially expressed genes.
Results
Gene Expression Analysis
Butyrate-induced apoptosis was observed in the parental HT29 cells but not in the HT29-BR cells (data not shown), consistent with our previously published results 12 and confirms that the HT29-BR cell line is resistant to the apoptotic effects of butyrate. Principle component analysis of the array data revealed clear delineation of the transcriptional profiles between untreated HT29 cells and HT29-BR cells and indicated that changes in gene expression profiles occur most significantly with butyrate treatment of HT29 cells (Supplementary figure 1). In the untreated HT29 cells, no genes were identified as being differentially expressed at 0.5, 6 and 15 hrs when compared to 0 hr control. At 48 hrs, only 95 genes (0.4%) were identified as being differentially expressed indicating that observed effects were attributed to butyrate treatment (Supplementary table 1). The list of differentially expressed genes for HT29 cells treated with butyrate and HT29-BR cells at each time point is included as Supplementary tables 2 and 3 respectively.
Bioinformatic Analysis of Differentially Expressed Genes
Time Course Analysis of HT29 Cells Treated with 5mm Butyrate
To identify early responding genes involved in butyrate-induced apoptosis, we compared the expression of genes at 0.5 and 6 hrs with that of untreated control cells. At 0.5 hr, no changes in gene expression were detected (FDR <1%, fold change >±2). At 6 hrs, 476 genes were identified as being differentially expressed. However, 1516 and 1091 genes were differentially expressed at 15 hrs (intermediate response) and 48 hrs (late responding) respectively when compared with the control population (Supplementary table 2). Further analysis determined that 227 genes were common to all three time points. A Venn diagram showing the distribution of the number of genes differentially expressed at each time point is shown in Figure 1.
Figure 1.Venn diagram showing the breakdown of differentially expressed genes for HT29 cells treated with 5mM butyrate at 6, 15 and 48 hrs time points when compared with control untreated HT29 cells (0 hr).
Bioinformatic analysis (Ingenuity Pathway Analysis) was conducted to determine possible relationships between differentially expressed genes and revealed deregulated activity of several regulatory molecules which can potentially influence the expression of their respective downstream targets including transcription regulators, enzymes, translation regulators, transporters and kinases. The activity of several regulatory molecules were predicted to be deregulated at specific time points including MGEA5 at 6 hrs, the kinase BRD4 at 15 hrs, and FOXO1, CCNK, S100A6 and CD24 which were deregulated at 48 hrs only (Table 1). In addition to those deregulated uniquely at each time point, TGM2 was predicted to be activated across all three time points. Five molecules, which include TP53, CDKN1A, FOXM1, E1F4G1 and KDM5B were predicted to be deregulated at both 15 and 48 hrs.
Table 1. Predicted activity of regulatory molecules in HT29 cells and HT29-BR cells treated with butyrate. Regulatory molecules and their downstream targets were identified by bioinformatic analysis using Ingenuity Pathway Analysis. The target molecules of interest were identified as being differentially expressed in HT29 cells following butyrate treatment and in the HT29-BR cells when compared with the control cells. Detailed information for these target genes can be found in the Supplementary Information. A negative z-score indicates that the gene is predicted to be inhibitory, whereas a positive z-score indicates that the gene is predicted to be activated. Abbreviations: Bu, butyrate.| z-score | ||||||
| Regulatory molecule | Functional classification | 5 mM Bu for 6hr in HT29 cells | 5 mM Bu for 15hr in HT29 cells | 5 mM Bu for 48hr in HT29 cells | HT29-BR cells after 48hr | Target molecules in dataset |
| TGM2 | enzyme | 2.058 | 2.813 | 2.630 | BCL6,CFLAR,HIP1,MERTK,POR,PTGS1,SMPD1,TTC27,UBXN8 | |
| MGEA5 | enzyme | -3.317 | AKT1S1,CAV1,CREB3L2,CYFIP2,EPHB3,KREMEN1,RAP2A,SERPINB9,TAF5L,TIMP2,TUBA1A | |||
| KDM5B | transcription regulator | 3.330 | 3.970 | 3.601 | AURKA,BUB1B,CCNB1,CDCA3,DLGAP5,FBXO5,HMMR,KIF2C, MCM2,MCM3,NCAPH,NDC80,SAT1,SWAP70,TTK | |
| TP53 | transcription regulator | 4.517 | 5.012 | 5.745 | AURKA,BIRC5,BUB1,BUB1B,CCNB1,CDC20,CDC25A,CDC6,CDKN1A,CHEK1,FEN1,HMMR,KIF23,MCM2,MCM3,MCM4,MCM6,MCM7,NDC80,NDRG1,PEG10,PRC1,PROM1,RFC3,TNFRSF10B,TNFSF9 | |
| CDKN1A | kinase | 2.183 | 2.395 | BIRC5,CCNB1,CDC25A,CDKN1A,CHEK1,DUSP1,FOXM1,RRM1 | ||
| FOXM1 | transcription regulator | -2.583 | -3.075 | -3.075 | BIRC5,BUB1B,CCNB1,CDC20,CDKN1A,FOXM1,PRC1 | |
| EIF4G1 | translation regulator | -2.000 | -2.236 | -2.449 | BIRC5,BRCA2,CHEK1,RAD51 | |
| BRD4 | kinase | -2.236 | CDC25A,MYB,SLC38A5,SRM,TTC27 | |||
| FOXO1 | transcription regulator | -2.891 | -3.302 | BIRC5,CCNB1,CENPF,DLGAP5,KIF11,KIF18A,MCM5,NEK2,NUSAP1,PRC1,SPC25,TXNIP | ||
| CCNK | other | -2.376 | -2.376 | BRCA1,FANCD2,FANCI,POLA2,RFC5,UBE2T | ||
| S100A6 | transporter | -2.236 | -2.236 | AURKA,CENPA,NCAPH,NEK2,TYMS | ||
| CD24 | other | -2.236 | -2.236 | DEPDC1B,HMMR,KIF18A,SMC4,TOP2A | ||
| UXT | other | 2.214 | BUB1,CDC6,CHEK1,GTSE1,TTK | |||
| NCOA3 | transcription regulator | -2.000 | CCDC80,CDC25A,CDC6,MCM7 | |||
Comparison between HT29 cells and HT29-BR cells at 0 hr
ANOVA analysis of gene expression profiles indicated that 942 genes were differentially expressed at 0hr between HT29 and HT29-BR cells (FDR <1%, fold change >±2) (Supplementary table 3). Gene ontology analysis classified these genes into the four functional categories including enzyme activity (19%), transporter activity (9%), transcription regulation (8%), and kinase activity (5%) (Supplementary figure 2). This indicates that a range of different cellular processes are involved in the acquisition of butyrate resistance in HT29 cells. A large proportion of differentially expressed genes (43%) could not be accurately classified into any known functional category.
Pathway analysis determined that the majority of genes were involved in tumorigenesis (125 genes, 13%) and that 40 genes (4%) were involved in CRC specifically (Supplementary table 4). Furthermore, EGF was identified as a core node, implicating the EGF signalling network as a potentially significant factor in the acquisition of butyrate resistance in HT29 cells (Figure 2). The expression of EGF was up-regulated 3.5 fold in the HT29-BR cells. The expression of a number of downstream targets of EGF signalling were also identified as being up-regulated in the HT29-BR cells indicating hyperactivity of the EGF signalling network in this cell line.
Figure 2.Gene expression network indicating EGF as a central node and switched on in HT29-BR cells when compared with HT29 cells. Green and red shading indicate genes that are up- and down-regulated in HT29-BR cells respectively when compared to HT29 cells.
Time Course Analysis of HT29-BR Cells
ANOVA analysis revealed that for HT29-BR cells at 15 and 48 hrs, 17 genes and 227 genes were differentially expressed respectively when compared to HT29-BR cells at 0 hr (FDR <1%, fold change >±2) (Supplementary table 3). Comparison of the 0.5 and 6 hr time points to 0 hr, showed no significant differences in gene expression. These results indicate that the greatest observable difference in gene expression occurs between HT29 and HT29-BR cells (i.e. t=0 hr) and that minimal change in gene expression occur over time (i.e. up to t=48 hr) in the HT29-BR cells under the cell culture conditions used in this study (Supplementary figure 1).
Of the 17 genes differentially expressed at 15 hrs, 11 of these are involved in DNA replication and the DNA damage response, including 6 genes that are components of the minichromosome maintenance complex (MCM) (Figure 3). Other DNA repair genes identified include CDC45, CHEK1, TYMS, UNG and UHRF1. All 11 genes were down-regulated to a greater extent at 48 hrs in the HT29-BR cells with the exception of UNG where a minimal change in expression was detected.
Figure 3.Fold change in the expression of DNA repair genes and cell cycle regulators in HT29-BR cells over 48 hrs. Comparisons are with control HT29-BR cells (0 hr). The change in expression of these genes were not significant at 0.5 or 6 hrs, but were found to be significant at t=15 and 48 hrs only (FDR <1%, fold change >±2).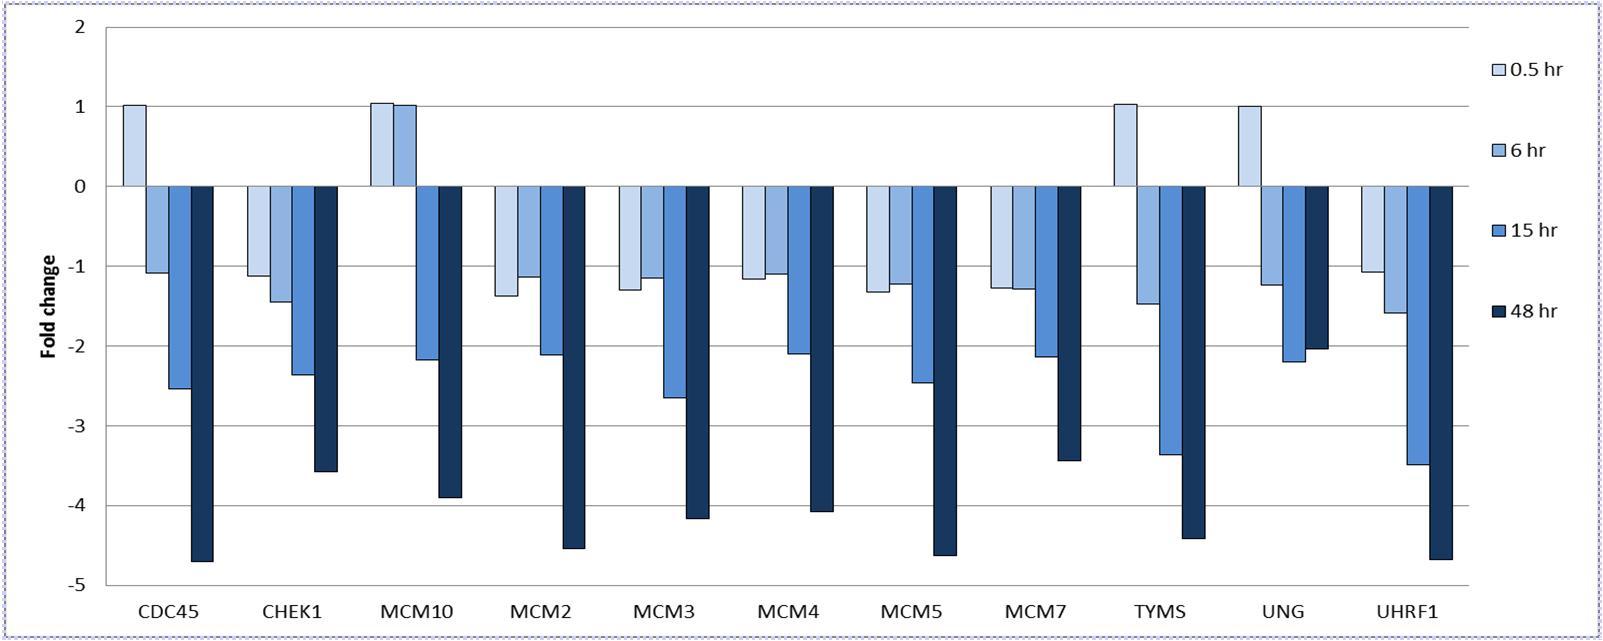
In addition to those genes involved in DNA repair and replication at 15 hrs, the expression of three genes was up-regulated: GPR155 (up-regulated 2.1 fold at 15 hrs and 2.3 fold at 48 hrs), LAMP3 (up-regulated 2.1 fold at 15 hrs and 2 fold at 48 hrs) and SYT11 (up-regulated 2.1 fold at 15hrs and 2.6 fold at 48 hrs). Down-regulated genes include FAM111B (down-regulated 3.2 fold at 15 hrs and 4.1 fold at 48 hrs) and SLC26A9 (down-regulated 2.3 fold at 15 hrs and 1.8 fold at 48 hrs).
Of the 227 genes identified as being differentially expressed at 48 hrs, 137 (61%) were nuclear proteins, 42 genes (19%) localised to the cytoplasm, 16 genes (7%) were located at the plasma membrane, 13 genes (6%) were confined to the extracellular space and the remaining 16 genes (7%) could not be classified (Supplementary figure 3). Of the nuclear proteins, the expression of nine (6.5%) genes was up-regulated, and the remaining genes were down-regulated. Thirty-one genes (23%) were classified as enzymes, 14 genes (10%) were transcription regulators while 78 genes (57%) could not be classified into any functional category (Supplementary figure 4).
Further bioinformatic analysis also revealed that the activity of seven regulatory molecules to be potentially altered at 48 hrs (Table 1), including the transcription regulators TP53 and KDM5B, and UXT which were all activated. Another seven molecules were predicted to be inhibited including FOXM1, FOXO1, NCOA3, EIF4G1, S100A6, CCNK and CD24.
Discussion
Mechanisms Involved in Butyrate-Induced Apoptosis
At 6 hrs, 476 genes were differentially expressed in response to butyrate (FDR <1%, fold change >±2), and over 1000 genes were differentially expressed over the 48 hrs time period. Based on gene expression changes, bioinformatic analysis predicted that the activity of 12 regulatory molecules was deregulated with butyrate treatment. Of note, the activity of MGEA5 was predicted to be inhibited early in the apoptotic process (6 hrs) only, i.e., its activity had returned to levels comparable with the control group at 15 hrs. MGEA5 is a highly conserved enzyme that catalyses the removal of the O-GlcNAc functional group from serine and threonine residues of proteins. Regulation of O-GlcNAcylation of proteins is highly dependent on the hexosamine biosynthetic pathway where it requires metabolic intermediates such as glutamine, glucose and acetyl-CoA to generate the donor sugar, UDP-N-acetylglucosamine, and it is therefore intimately linked with a cell’s nutritional status. Reduced activity of MGEA5, as observed at 6 hrs, may be indicative of low turnover of O-GlcNAcylated proteins. Perturbed cycling of protein O-GlcNAcylation has been implicated in the development of a number of malignancies, including CRC 31, 32. Many proto-oncogenes, tumour suppressors, cell cycle regulators and signal transducers are O-GlcNAcylated 33, and it has been recently shown that b-catenin is stabilised by O-GlcNAcylation 32. Aberrant Wnt/b-catenin signalling is a hallmark of colorectal tumorigenesis and elevated levels of b-catenin is associated with tumour progression. Additionally, cancer cells preferentially utilise glucose as an energy source (Warburg effect) and enhance the uptake of glucose by over-expressing glucose transporters such as GLUT1. Whether there is a link between this increase in glucose flux and altered cycling of O-GlcNAcylation in cancer cells to influence tumorigenesis or apoptosis presents a novel avenue for further investigation.
The activity of BRD4 was down-regulated by butyrate at 15 hrs specifically. BRD4 regulates gene transcription by binding to acetylated H3 and H4 histone proteins; however, its role in tumorigenesis is not understood. Inhibition of BRD4 by small molecule inhibitors has been shown to have anti-tumour effects and BRD4 has been identified as a potential therapeutic target in cancer 34, 35. Inhibition of BRD4 has been shown to reduce the expression and transcriptional activity of c-MYC in cancer cells 36. BRD4 has also been shown to stabilise and promote the transcriptional activity of NFkb in cancer cells by binding to the acetylated form of RelA, a subunit of NFkb, to maintain its nuclear localisation and prevent its degradation 37. Deregulation of BRD4, and the potential subsequent downstream effects on NFkb and MYC transcriptional targets, may represent novel mechanisms involved with the anti-tumorigenic effect of butyrate. Deregulated activity of CDKN1A, FOXM1, KDM5B and CCNK is possibly linked to regulation of cell cycle events, which is a well described effect of butyrate. FOXO1, EIF4G1, S100A6 and TGM2, however, have diverse roles in maintaining cellular function and their roles in tumorigenesis are not clearly defined.
Mechanisms Involved in Butyrate Resistance
Our analysis identified 942 genes as being differentially expressed in the HT29-BR cells that potentially contribute to the development of butyrate resistance (Supplementary table 3), including 40 genes specifically involved in CRC development (Supplementary table 4). Of particular interest is the possible activation of the EGF signalling network in the HT29-BR cell line which may also have implications in cancer therapeutics. Recent reports indicate potential synergistic effects of combined HDI and tyrosine kinase inhibitor therapy, including EGF receptor (EGFR) inhibitors, in cancer patients with EGFR-expressing tumours 38, 39. The role of EGF signalling in tumour cell proliferation and survival is well known, and over expression of EGFR has been documented in many different cancers although the mechanisms involved with its hyperactivation are not well understood. Reports on the effect of HDIs, including butyrate, on the expression and activity of EGF signalling are inconsistent and may be dependent on the in vitro model being investigated. For example, Chou et al reported that EGFR expression is decreased by HDI in CRC cells, and that this occurred at the transcriptional level 40. Conversely, Song et al reported enhanced activation of EGFR with HDI and that this was associated with concurrent phosphorylation and acetylation of EGFR at three specific lysine residues (K684, K836 and K843) 41. Our results are supportive of those reported by Song et al where EGF signalling by butyrate in HT29 cells likely leads to enhanced cell survival and development of butyrate resistance. Bongers et al have also described elevated EGFR signalling in colorectal polyps and adenomas in comparison to surrounding normal mucosa, and this may be particularly important in the development of polyps derived from the serrated pathway 42.
Our studies have also indicated an association between butyrate resistance and down-regulated expression of members of the MCM protein family. This is supported by a recent report indicating down-regulation of MCM proteins in CRC cell lines in response to trichostatin A 43. Low expression levels of these proteins are seen in quiescent, senescent or differentiated cells and deregulation of the MCM protein complex, composed of MCM2, 3, 4, 5, 6 and 7, is believed to result in genomic instability and ultimately lead to tumorigenesis 44. For example, cells that are deficient in MCM protein expression and/or activity have been associated with hypersensitivity to genotoxic stress and display higher intrinsic levels of DNA damage, even in the absence of genotoxic agents 45. Furthermore, MCM deficient mice have been shown to have a higher incidence of cancer that is believed to be result in higher levels of gene mutations, and mice that are deficient in MCM2 or MCM7 have been shown to develop tumours with high penetrance and that have short latency periods 45. CDC45, whose expression was down-regulated in the HT29-BR cell line, is also a critical part of this process as recruitment of this protein to the MCM complex is required for the initiation of DNA synthesis 46. Lower levels of MCM proteins and CDC45, coupled with reduced levels of CHK1, a protein that regulates the DNA damage response and which was also observed to be down-regulated in the HT29-BR cells, may provide a survival advantage to these cells that enables them to overcome apoptosis in the presence of butyrate.
Conclusion
Understanding the mechanisms involved with the acquisition of resistance to butyrate’s apoptotic effects will provide novel insights into the development of CRC. Using gene expression analysis, we have described novel processes regulated by butyrate which may be important in the development of butyrate resistance and that potentially contributes to the tumorigenic process. Activation of the EGF signalling network may enhance proliferation and cell survival in cancer cells and deregulated expression of members of the MCM protein family may contribute to genomic instability. In addition, we have identified possible mechanisms contributing to butyrate’s pro-apoptotic effects. Further studies in vivo are required to define the role of these processes in CRC progression.
Supplementary Materials:
Acknowledgements
This work was funded by the CSIRO Preventative Health National Research Flagship.
References
- 1.Ferlay J, H R Shin, Bray F, Forman D, Mathers C. (2011) Estimates of worldwide burden of cancer in 2008: GLOBOCAN2008. , Int J Cancer 127(12), 2893-2917.
- 2.Food nutrition.physical activity, and the prevention of cancer: a global perspective,2007. World Cancer Research Fund and American Institute for Cancer Research:Washington,DC.
- 3.K Y Fung, Cosgrove L, Lockett T, Head R, D L Topping. (2012) A review of the potential mechanisms for the lowering of colorectal oncogenesis by butyrate. , Br J Nutr 108(5), 820-831.
- 4.H M, Jonkers D, Venema K, Vanhoutvin S, F J Troost. (2008) Review article: the role of butyrate on colonic function. Aliment Pharmacol Ther. 27(2), 104-119.
- 5.Havenaar R. (2011) Intestinal health functions of colonic microbial metabolites: a review. Benef Microbes. 2(2), 103-114.
- 6.J M Clarke, D L Topping, A R Bird, G P Young, Cobiac L. (2008) Effects of high-amylose maize starch and butyrylated high-amylose maize starch on azoxymethane-induced intestinal cancer in rats. Carcinogenesis. 29(11), 2190-2194.
- 7.Leu R K Le, Hu Y, I L Brown, G P Young. (2009) Effect of high amylose maize starches on colonic fermentation and apoptotic response to DNA-damage in the colon of rats. , Nutr Metab (Lond) 6, 11-10.
- 8.J C Mathers, Movahedi M, Macrae F, J P Mecklin, Moeslein G. (2012) Long-term effect of resistant starch on cancer risk in carriers of hereditary colorectal cancer: an analysis from the CAPP2 randomised controlled trial. Lancet Oncol. 13(12), 1242-1249.
- 9.J M Clarke, A R Bird, D L Topping, Cobiac L. (2007) Excretion of starch and esterified short-chain fatty acids by ileostomy subjects after the ingestion of acylated starches. , Am J Clin Nutr 86(4), 1146-1151.
- 10.Daly K, Shirazi-Beechey S P. (2006) Microarray analysis of butyrate regulated genes in colonic epithelial cells. , DNA Cell Biol 25(1), 49-62.
- 11.K Y Fung, G V Brierley, Henderson S, Hoffmann P, S R McColl. (2011) Butyrate-induced apoptosis in HCT116 colorectal cancer cells includes induction of a cell stress response. J Proteome Res. 10(4), 1860-1869.
- 12.K Y Fung, Lewanowitsch T, S T Henderson, Priebe I, Hoffmann P. (2009) Proteomic analysis of butyrate effects and loss of butyrate sensitivity in HT29 colorectal cancer cells. J Proteome Res. 8(3), 1220-1227.
- 13.Iacomino G, M F Tecce, Grimaldi C, Tosto M, G L Russo. (2001) Transcriptional response of a human colon adenocarcinoma cell line to sodium butyrate. Biochem Biophys Res Commun. 285(5), 1280-1289.
- 14.H T Tan, Tan S, Lin Q, T K Lim, C L Hew. (2008) Quantitative and temporal proteome analysis of butyrate-treated colorectal cancer cells. Mol Cell Proteomics. 7(6), 1174-1185.
- 15.Tan S, T K Seow, R C Liang, Koh S, C P Lee. (2002) Proteome analysis of butyrate-treated human colon cancer cells (HT-29). Int. 98(4), 523-531.
- 16.Thangaraju M, Cresci G, Itagaki S, Mellinger J, Browning D D. (2008) Sodium-coupled transport of the short chain fatty acid butyrate by SLC5A8 and its relevance to colon cancer.J.Gastrointest.Surg,12(10):. 1773-1781.
- 17.Sina C, Gavrilova O, Forster M, Till A, Derer S. (2009) G protein-coupled receptor 43 is essential for neutrophil recruitment during intestinal inflammation. , J Immunol 183(11), 7514-7522.
- 18.Tang Y, Chen Y, Jiang H, G T Robbins, Nie D. (2011) G-protein-coupled receptor for short-chain fatty acids suppresses colon cancer. , Int 128(4), 847-856.
- 19.Thangaraju M, G A Cresci, Liu K, Ananth S, J P Gnanaprakasam. (2009) GPR109A is a G-protein-coupled receptor for the bacterial fermentation product butyrate and functions as a tumor suppressor in colon. Cancer Res. 69(7), 2826-2832.
- 20.J M Blouin, Penot G, Collinet M, Nacfer M, Forest C. (2011) Butyrate elicits a metabolic switch in human colon cancer cells by targeting the pyruvate dehydrogenase complex. , Int 128(11), 2591-2601.
- 21.Borthakur A, Saksena S, R K Gill, W A Alrefai, Ramaswamy K. (2008) Regulation of monocarboxylate transporter 1 (MCT1) promoter by butyrate in human intestinal epithelial cells: involvement of NF-kappaB pathway. , J Cell Biochem 103(5), 1452-1463.
- 22.Goncalves P, Gregorio I, Martel F. (2011) The short-chain fatty acid butyrate is a substrate of breast cancer resistance protein. , Am J Physiol Cell Physiol 301(5), 984-994.
- 23.Lecona E, Olmo N, Turnay J, Santiago-Gomez A, Silanes I Lopez de. (2008) Kinetic analysis of butyrate transport in human colon adenocarcinoma cells reveals two different carrier-mediated mechanisms. Biochem J. 409(1), 311-320.
- 24.Lopez de Silanes, N Olmo I, Turnay J, Buitrago G Gonzalez de, Perez-Ramos P. (2004) Acquisition of resistance to butyrate enhances survival after stress and induces malignancy of human colon carcinoma cells. Cancer Res. 64(13), 4593-4600.
- 25.Serpa J, Caiado F, Carvalho T, Torre C, L G Goncalves.Butyrate-rich colonic microenvironment is a relevant selection factor for metabolically adapted tumor cells. , J Biol Chem 285(50), 39211-39223.
- 26.Olmo N, Turnay J, Lecona E, Garcia-Diez M, Llorente B. (2007) Acquisition of resistance to butyrate induces resistance to luminal components and other types of stress in human colon adenocarcinoma cells. Toxicol In Vitro. 21(2), 254-261.
- 27.Chai F, Evdokiou A, G P Young, P D Zalewski. (2000) Involvement of p21(Waf1/Cip1) and its cleavage by DEVD-caspase during apoptosis of colorectal cancer cells induced by butyrate. Carcinogenesis. 21(1), 7-14.
- 28.Chiaro C, D L Lazarova, Bordonaro M. (2012) Tcf3 and cell cycle factors contribute to butyrate resistance in colorectal cancer cells. Biochem Biophys Res Commun. 428(1), 121-126.
- 29.Bordonaro M, Tewari S, C E, Atamna W, D L Lazarova. (2011) A switch from canonical to noncanonical Wnt signaling mediates drug resistance in colon cancer cells. PLoS One. 6(11), 27308.
- 30.Caruso M, K Y Fung, Moore J, G V Brierley, L J Cosgrove. (2014) . Claudin-1 Expression Is Elevated in Colorectal Cancer Precursor Lesions Harboring the BRAF V600E Mutation. Transl Oncol .
- 31.Mi W, Gu Y, Han C, Liu H, Fan Q. (2011) O-GlcNAcylation is a novel regulator of lung and colon cancer malignancy. Biochim Biophys Acta. 1812(4), 514-519.
- 32.S Olivier-Van, Guinez C, Mir A M, Perez-Cervera Y, Liu C.The hexosamine biosynthetic pathway and O-GlcNAcylation drive the expression of beta-catenin and cell proliferation. , Am J Physiol Endocrinol Metab 302(4), 417-424.
- 33.Slawson C, R J Copeland, G W Hart. (2010) O-GlcNAc signaling: a metabolic link between diabetes and cancer? Trends Biochem Sci. 35(10), 547-555.
- 34.Lockwood W W, Zejnullahu K, Bradner J E, Varmus H. (2012) Sensitivity of human lung adenocarcinoma cell lines to targeted inhibition of BET epigenetic signaling proteins. , Proc Natl Acad Sci U S A 109(47), 19408-19413.
- 35.Zuber J, Shi J, Wang E, A R Rappaport, Herrmann H. (2011) RNAi screen identifies Brd4 as a therapeutic target in acute myeloid leukaemia. Nature. 478(7370), 524-528.
- 36.Mertz J A, Conery A R, Bryant B M, Sandy P, Balasubramanian S. (2011) Targeting MYC dependence in cancer by inhibiting BET bromodomains. , Proc Natl Acad Sci U S A 108(40), 16669-16674.
- 37.Zou Z, Huang B, Wu X, Zhang H, Qi J. (2013) Brd4 maintains constitutively active NF-kappaB in cancer cells by binding to acetylated RelA. Oncogene.
- 38.M C Chen, C H, J C Wang, A C Tsai, J P Liou. (2013) The HDAC inhibitor, MPT0E028, enhances erlotinib-induced cell death in EGFR-TKI-resistant NSCLC cells. Cell Death Dis. 4, 810.
- 39.Zhou Q, P G Shaw, N E Davidson. (2009) Inhibition of histone deacetylase suppresses EGF signaling pathways by destabilizing EGFR mRNA in ER-negative human breast cancer cells. Breast Cancer Res Treat. 117(2), 443-451.
- 40.Chou C W, Wu M S, Huang W C, Chen C C. (2010) . HDAC Inhibition Decreases the Expression of EGFR in Colorectal Cancer Cells. PLoS One 6(3), 18087.
- 41.Song H, Li C W, Labaff A M, Lim S O, Li L Y. (2011) Acetylation of EGF receptor contributes to tumor cell resistance to histone deacetylase inhibitors. Biochem Biophys Res Commun. 404(1), 68-73.
- 42.Bongers G, L R Muniz, M E Pacer, A C Iuga, Thirunarayanan N. (2012) A role for the epidermal growth factor receptor signaling in development of intestinal serrated polyps in mice and humans. Gastroenterology. 143(3), 730-740.
- 43.Liu Y, He G, Wang Y, Guan X, Pang X. (2013) MCM-2 is a therapeutic target of Trichostatin A in colon cancer cells. Toxicol Lett. 221(1), 23-30.
- 44.Lei M. (2005) The MCM complex: its role in DNA replication and implications for cancer therapy. Curr Cancer Drug Targets. 5(5), 365-380.