Abstract
Estimates of the genetic diversity of Large Japanese field mouse Apodemusspeciosus populations and identification of their plant food resources were conducted in an industrial green space, where were constructed on reclaimed land and belonged to the Aichi Refinery of Idemitsu Kosan Co., Ltd., in Aichi Prefecture, Japan. A total of six mitochondrial D-loop haplotypes were identified in 50 mice. Habitat condition with the highest number of captured individuals had abundant broad-leaved trees and understory vegetation. A minimum spanning network, which did not form a ring-shaped network, revealed that the hereditary population structure was weak. The low genetic diversity observed in the study area was thus attributed to isolation from other populations once the population in the study area by sea and road, which is more than 30 m wide. In order to identify which plant food resources were utilized by mice captured inside the industrial green space, partial chloroplast rbcL sequences were amplified by PCR from DNA extracted from 43 feces samples. Calculations of sample completeness curve revealed that 25 of the taxa identified in this study comprised approximately 90% of the food plant resources in the study area. Of the 21 plant families identified from the obtained rbcL sequences, members of the Rosaceae (28.0%), Fagaceae (17.2%), Lauraceae (14.2%) and Oleaceae (7.7%) were dominant. To ensure the continued survival of A. speciosuspopulation in this industrial green space would be to preferentially conserve plant species that are used as food resources by this species.
Author Contributions
Academic Editor: Narcisa Vrinceanu, Faculty of Engineering, Lucian Blaga†University of Sibiu /4 Emil Cioran Street, 550025 Sibiu, Romania.
Checked for plagiarism: Yes
Review by: Single-blind
Copyright © 2018 Taichi Fujii
 This is an open-access article distributed under the terms of the Creative Commons Attribution License, which permits unrestricted use, distribution, and reproduction in any medium, provided the original author and source are credited.
Competing interests
The authors have declared that no competing interests exist.
Citation:
Introduction
In industrial areas, green spaces are primarily used as buffers for industrial pollution and for accident prevention. Since industrial green spaces also function as habitats for local wildlife, these areas are considered to contribute positively towards regional biodiversity conservation. Given this background, we previously surveyed the wildlife species that inhabit the industrial green space of the Aichi Refinery of Idemitsu Kosan Co., Ltd. in Aichi Prefecture, Japan 1. This industrial green space comprises a very large forest zone connected to smaller industrial green spaces, which are the favored habitats of native medium-sized mammals, such as the Raccoon dog (Nyctereutesprocyonoides), Japanese hare (Lepus brachyurus), andthe Japanese red fox(Vulpes vulpes japonica) reported once local extinction in the southern part of the Aichi Prefecture, which are representative mammal species of Japan 1. Considering that the native mammals of Japan are threatened by extensive habitat destruction, mainly due to urbanization, this industrial green space have contributed positively towards maintaining viable populations of mammals from this region. Since Idemitsu Kosan Co., Ltd. has never experienced any loss due to these mammals inhabiting its property, the company has promoted the utilization of this industrial green space for native medium-sized mammal conservation.
Of the small mammals in Japan, Large Japanese field mouse Apodemusspeciosus is dominant in this industrial green space 1. Consequently, in order to ensure the successful conservation of the carnivores in this industrial green space, it is important to understand the ecological status of the murids that are preyed upon by these predators. Maintaining genetic variation, the most basic level of biological diversity, is at the center of conserving species, populations, and ecosystems. This is because maintaining high levels of genetic diversity is crucial for ensuring the fitness and survival of a species and its ability to adapt to environmental change 2. In addition, to increase the potential of this industrial green space for supporting populations of A. speciosus, it is important to understand their food resources, especially plants. However, the genetic diversity and diets of this murid species in the industrial green space have not yet been investigated in any detail.
We inferred the genetic diversity of A. speciosuspopulations by examining sequence variation in the mitochondrial D-loop region; the most variable mitochondrial DNA region3. In addition, we identified the plant food resources utilized by A. speciosuspopulations in this industrial green space by DNA barcoding of the chloroplast rbcL gene. To predict the ratio of the number of identified plant species to the number of plant species used for food in this industrial green space, a sample completeness curve was calculated for this species. Consequently, our genetic approach proposed manage the population of A. speciosus in this industrial green space.
Materials and Methods
Trapping
The industrial green space of the study area were constructed on reclaimed land and belonged to the Aichi Refinery of Idemitsu Kosan Co., Ltd. (34°58’30”N, 136°50’28”E) (Figure 1). Since this industrial area opened in the 1970s, this industrial green space has been separated from the surrounding areaby Ise Bay to the west and the Chita industrial road, which is more than 30 m wide, to the east. The industrial green space is belt-shaped, with a total length of ca. 2 km and a width of ca. 100 m. Approximately 450,000 trees were planted when the refinery was built; the vegetation at the industrial green space currently consists of a mixture of typical evergreen broad-leaved forest and deciduous broad-leaved trees. In addition, bamboo groves and artificial grasslands have been established on part of the area. The footpaths (width ca. 2 to 5 m) for business activities and nature observation are maintained.
Figure 1.Map and aerial photograph of the industrial green space examined in this study: Aichi Refinery of Idemitsu Kosan Co., Ltd. Solid line and dotted line indicates the industrial green space and the Chita industrial road, respectively. Map data were extracted from Google, DigitalGlobe.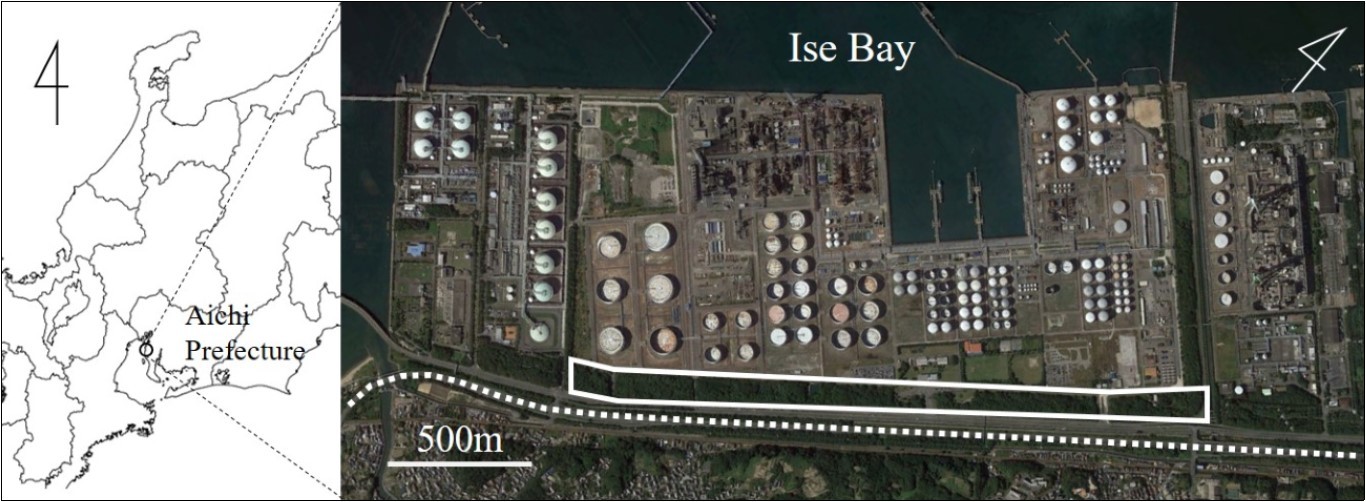
Trapping was conducted at approximately 2-month intervals from May 2012 to November 2014 using Sherman-type live traps (6.5 × 5.5 × 16.0 cm, H. B. Sherman Traps, FL) baited with a mixture of barley and walnuts (15:1 w/w). Nine trapping sites (sites ID-1 to 9) were a set at intervals of 200 to 320 m, and five traps were set at 10-m intervals on each side of the footpaths at each trapping site to give a total of ten traps at each trapping site.
Immediately after capture, body hair for D-loop analysis, and feces for identifying food plants, were collected from the mice and traps, respectively. The trapped individuals were then released at the site of capture. All body hairs (including hair roots) and feces samples were frozen at -20°C until total DNA was extracted.
This study was conducted in full compliance with the guidelines for the treatment of animals proposed by the Mammal Society of Japan and a license for capturing Large Japanese field mice was obtained from the Aichi Prefectural government.
Detection of DNA Polymorphisms
Total DNA was isolated from body hair using a DNeasy Blood & Tissue Kit (Qiagen, Germany) and purified using a Geneclean Spin Kit (MP-Biomedicals, CA). PCR reactions were performed in reaction mixtures of 50 μl containing 1 unit of MightyAmp DNA Polymerase Ver. 2 (Takara, Japan) and 0.32 µM of each primer according to the manufacturer’s instructions. Primers flanking the D-loop region were M15997 (5'-TCCCCACCATCAGCACCCAAAGC-3') and H16401 (5'-TGGGCGGGTTGTTGGTTTCACGG-3')3. PCR amplification was performed using a DNA Thermal Cycler (GeneAmp PCR System 9700, Applied Biosystems, Foster City, CA) using an initial denaturation step of 98°C for 2 min, followed by 30 cycles of denaturation for 10 s at 98°C, annealing for 15 s at 60°C, and extension for 30 s at 68°C. All PCR products were purified using a QIAquick PCR Purification Kit (Qiagen) and subjected to dye-terminator cycle sequencing using DTCS Quick Start Mix (Beckman Coulter, CA) and an automatic sequencer (CEQ 2000XL, Beckman Coulter).
To detect DNA polymorphisms in the D-loop, the obtained DNA sequences were aligned using the MEGA 6.06 software package 4. Calculation of haplotype diversity and construction of the minimum spanning network (MSN) was performed using ARLEQUIN ver. 3.5.1.2 5.
Plant Food Resource Identification by DNA Barcoding
To identify plant-derived food resources, total plant DNA was isolated from the dried feces (5.9 to 60.8 mg) using a DNeasy Plant Mini Kit (Qiagen) and purified using a Geneclean Spin Kit (MP-Biomedicals). PCR reactions were performed in reaction mixtures of 50 μl containing 1 unit of MightyAmp DNA Polymerase Ver. 2 (Takara) and 0.32 µM of each primer, according to the manufacturer’s instructions.Primers flanking the rbcL region were F3 (5'- TATCTTGGCAGCATTCCGAGTAACTCC -3') and R3 (5'- GATTCGCAGATCCTCCAGACGTAGAGC -3') 6. PCR amplification was performed using a DNA Thermal Cycler (GeneAmp PCR System 9700, Applied Biosystems) using an initial denaturation step of 98°C for 2 min, followed by 30 cycles of denaturation at 98°C for 10 s, annealing at 60°C for 15 s, and extension at 68°C for 20 s.
Each PCR product was then cloned into a plasmid (pGEM-T Easy Vector System I, Promega, WI), which was then transformed into JM109 competent cells (Toyobo, Japan), as described by the manufacturer. After incubation, we selected a maximum of 30 colonies per Petri dish and checked for insertion of the PCR product. Preparing the DNA for sequencing was performed using a NucleoSpin Plasmid QuickPure (Macherey-Nagel, Germany), as described by the manufacturer, and DNA was subjected to dye-terminator cycle sequencing using DTCS Quick Start Mix (Beckman Coulter) with an automatic sequencer (CEQ 2000XL, Beckman Coulter).
To identify food plants, homology searches were performed by comparing the DNA sequences obtained from the feces samples against all of the published sequences deposited in the DDBJ using the BLASTN program. To ensure that the accuracy of the identification was sufficiently robust, plant species detected only once and plant species with a homology of less than 98% were excluded after the homology search. In the event that a given sequence was identified as assigned to two or more taxa with the same score, then that sequence was assigned to the highest taxonomic level that included both ofthose taxa 6. As a result, some of the obtained sequences were assigned to the rank of genus and others to family 6. In order to predict the ratio of the number of identified plant food resources to the total number of plant food resources in this industrial green space, a sample completeness curve was calculated using iNEXT package 7,8.
Results
Number of Captured Individuals and Haplotype Diversity
The number of captured individuals and intraspecific DNA D-loop polymorphisms observed at each trapping site are summarized in Table 1. A total of 50 mice were caught at nine trapping sites. The trapping site with the highest number of captured individuals was site ID-6 (n=15). Conversely, the trapping sites with the lowest number of captured individuals were sites ID-1, ID-2, and ID-4 (n=2 at each site).
Table 1. Number of captured individuals and haplotype frequencies of DNA polymorphisms in the mitochondrial D-loop region of Apodemus speciosus at nine trapping sites in the industrial green space of Aichi Refinery of Idemitsu Kosan Co., Ltd., Aichi Prefecture, Japan.| Nucleotide positionb) | Haplotype frequencies | ||||||||||||||||||||||||||||
| Haplotype | 1 | 1 | 1 | 1 | 1 | 1 | 1 | 1 | 1 | 1 | 1 | 1 | 2 | 2 | 2 | ID-1 | ID-2 | ID-3 | ID-4 | ID-5 | ID-6 | ID-7 | ID-8 | ID-9 | Total number of haplotypes | ||||
| 7 | 8 | 8 | 0 | 2 | 4 | 5 | 5 | 5 | 7 | 7 | 8 | 8 | 8 | 9 | 0 | 2 | 6 | ||||||||||||
| 8 | 0 | 2 | 6 | 8 | 3 | 5 | 1 | 7 | 9 | 6 | 8 | 2 | 3 | 4 | 2 | 0 | 3 | 2 | |||||||||||
| Hap 1a) | C | T | T | T | T | A | T | T | C | A | T | T | C | - | - | T | C | G | A | 1 | 2 | 0 | 0 | 3 | 5 | 0 | 1 | 4 | 16 |
| Hap 2 | .c) | . | . | . | C | . | . | C | T | . | . | C | . | - | - | C | . | . | . | 0 | 0 | 0 | 0 | 3 | 10 | 4 | 5 | 6 | 28 |
| Hap 3 | . | . | C | . | . | . | C | . | . | . | . | C | . | - | - | . | . | A | . | 0 | 0 | 0 | 1 | 0 | 0 | 0 | 0 | 0 | 1 |
| Hap 4 | . | . | . | . | . | . | . | . | . | T | . | . | T | A | T | . | . | A | . | 0 | 0 | 2 | 1 | 0 | 0 | 0 | 0 | 0 | 3 |
| Hap 5 | . | . | . | . | . | . | . | . | . | . | . | . | . | - | - | . | T | . | . | 0 | 0 | 1 | 0 | 0 | 0 | 0 | 0 | 0 | 1 |
| Hap 6 | . | . | . | . | . | . | . | . | T | . | . | . | . | - | - | . | . | . | . | 1 | 0 | 0 | 0 | 0 | 0 | 0 | 0 | 0 | 1 |
| Total number of captured individuals | 2 | 2 | 3 | 2 | 6 | 15 | 4 | 6 | 10 | 50 | |||||||||||||||||||
A total of six different D-loop haplotypes (Hap 1 to 6, 299-301 bp) were detected in the 50 mice. The Hap 1 sequence was deposited in the DDBJ under accession no. LC228478. The dominant haplotypes were Hap 2 (n=28, 56%) from sites ID-5, ID-6, ID-7, ID-8, and ID-9, and Hap 1 (n=16, 32%) from sites ID-1, ID-2, ID-5, ID-6, ID-8, and ID-9. The structure of the total haplotype diversity in the industrial green space was 0.59. The MSN structure of this population was not ring-shaped and had a radial form (Figure 2).
Figure 2.Minimum spanning network of haplotypes based on the D-loop region of mitochondrial DNA of Apodemus speciosus in industrial green space of the Aichi Refinery of Idemitsu Kosan Co., Ltd. in Aichi Prefecture, Japan. Each haplotype name in the square is shown in Table 1. The number of vertical lines on branches represents the number of different bases (polymorphisms) between haplotypes.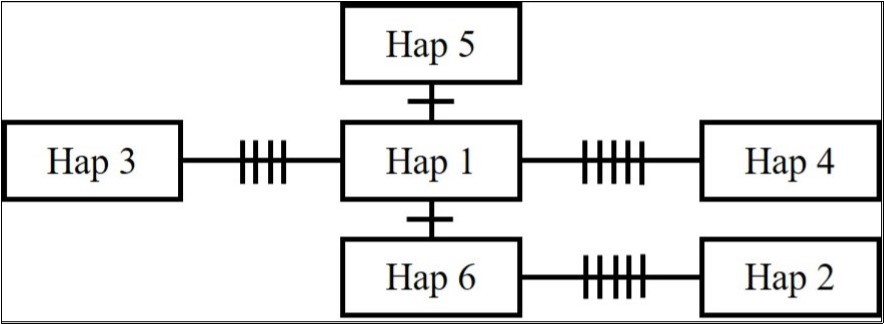
Plant Food Resources Identification
The BLASTN search results obtained for the food plant sequences are summarized in Table 2. A total of 46 feces samples could be collected from 50 captured individuals. Of these samples, DNA from 43 samples could be amplified. The size range of the amplified PCR products was 257 to 263 bp (excluding primers). The number of plant species per feces sample ranged from 1 to 9. A total of 325 rbcL sequences belonging to 25 plant taxa were obtained. Of these, 66 (20.3%) rbcL sequences could be assigned to six species. The species included Aphananthe aspera, Elaeagnus umbellata, Cocculus trilobus, Platanus occidentalis, Pyrus ussuriensis, and Rubus parvifolius. Of the remaining 259 rbcL sequences, 115 (35.4%) could be assigned to genus level (11 genera), and 144 (44.3%) to family level (eight families). Of the 21 families identified from the rbcL sequences, Rosaceae (28.0%), Fagaceae (17.2%), Lauraceae (14.2%), and Oleaceae (7.7%) were dominant.
Table 2. Homology search of obtained for the rbcL region of chloroplast DNA (257 – 263 bp) in food plants utilized by in Apodemus speciosus in the industrial green space of Aichi Refinery of Idemitsu Kosan Co., Ltd., Aichi Prefecture, Japan.| Family | Candidate taxon | Level of identification | No. of sequences | No. of individuals | Homology |
| Adoxaceae | Adoxaceae | Family | 4 | 1 | 262/262~262/263 |
| Aquifoliaceae | Ilex sp. | Genus | 2 | 1 | 262/262 |
| Araliaceae | Araliaceae | Family | 3 | 2 | 261/262-262/262 |
| Asteraceae | Asteraceae | Family | 14 | 8 | 260/262-262/262 |
| Cannabaceae | Aphananthe aspera | Species | 2 | 1 | 260/263-261/262 |
| Convolvulaceae | Ipomoea sp. | Genus | 2 | 2 | 261/262-262/262 |
| Daphniphyllaceae | Daphniphyllum sp. | Genus | 3 | 3 | 261/262-262/262 |
| Elaeagnaceae | Elaeagnus umbellata | Species | 7 | 4 | 259/261-262/262 |
| Elaeocarpaceae | Elaeocarpus sp. | Genus | 3 | 2 | 261/262-262/262 |
| Fagaceae | Fagaceae | Family | 44 | 13 | 257/262-262/262 |
| Quercus sp. | Genus | 12 | 7 | 260/262-262/262 | |
| Lardizabalaceae | Akebia sp. | Genus | 12 | 3 | 260/260-262/262 |
| Lauraceae | Lauraceae | Family | 4 | 3 | 259/261-262/262 |
| Cinnamomum sp. | Genus | 42 | 18 | 259/262-262/262 | |
| Menispermaceae | Cocculus trilobus | Species | 4 | 1 | 261/262-262/262 |
| Oleaceae | Oleaceae | Family | 25 | 11 | 259/262-262/262 |
| Papaveraceae | Papaveraceae | Family | 8 | 6 | 259/262-261/262 |
| Platanaceae | Platanus occidentalis | Species | 4 | 2 | 259/262-262/262 |
| Polygonaceae | Persicaria sp. | Genus | 21 | 9 | 260/261-262/262 |
| Rosaceae | Rosaceae | Family | 42 | 12 | 258/262-262/262 |
| Pyrus ussuriensis | Species | 7 | 1 | 260/262-262/262 | |
| Rubus parvifolius | Species | 42 | 4 | 260/261-262/262 | |
| Sapindaceae | Acer sp. | Genus | 10 | 4 | 260/262-262/262 |
| Solanaceae | Solanum sp. | Genus | 6 | 4 | 259/262-262/262 |
| Theaceae | Camellia sp. | Genus | 2 | 2 | 261/262 |
| total | 325 | 124 |
The most frequently encountered plant taxa in the feces samples were Cinnamomum sp. (n=18 feces samples), Fagaceae (n=13), and Rosaceae (n=12). Sample completeness curve results revealed that 25 plant taxa detected in this study covered approximately 90% of the plant food resources in this industrial green space (Figure 3).
Figure 3.Sample completeness curve for rarefied samples (solid line segment) and extrapolation (dotted line segments) sampling curves with 95% confidence intervals (shaded areas) for the food resource data of Apodemus speciosus in industrial green space of the Aichi Refinery of Idemitsu Kosan Co., Ltd. in Aichi Prefecture, Japan.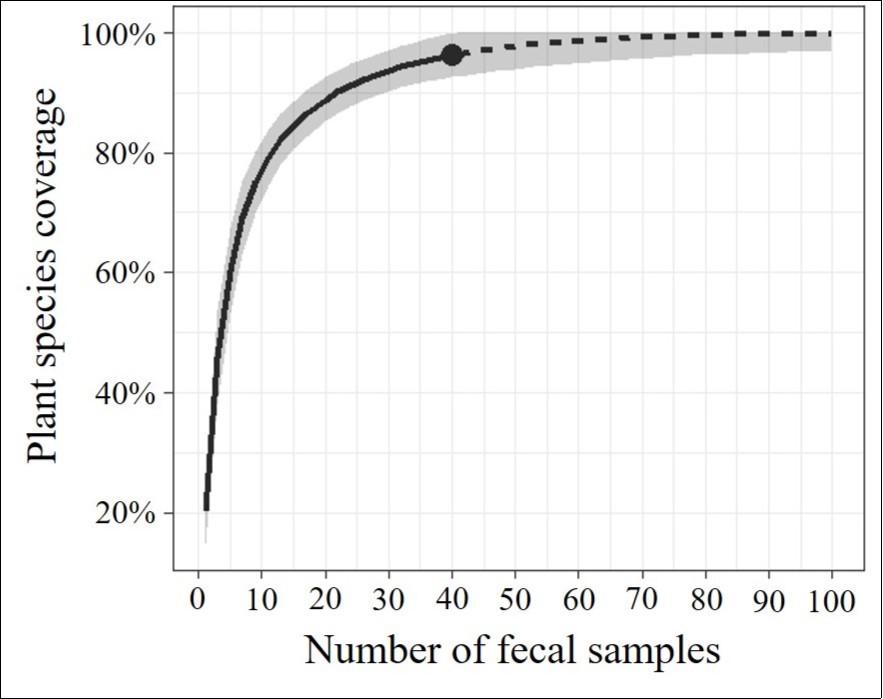
Discussion
The areas around sites ID-5 to ID-9 (including site ID-6 with the highest number of captured individuals) had abundant broad-leaved trees and understory vegetation. These sites also had large amounts of organic litter in the form of fallen leaves and branches from cladoptosis that covered the ground, which would be used by the mice to find food and cover 9. The food plant analysis showed that members of the Rosaceae, Fagaceae, and Lauraceae were extensively utilized as food by A. speciosus in this industrial green space. The number of captured individuals from sites ID-1 to ID-4 were the lowest of all the sites; these sites were characterized by having bamboo groves and evergreen forests, which are not typically used as food plants by A. speciosus. These findings imply that measures focusing on the maintenance of food plants, such as Rosaceae, Fagaceae, and Lauraceae, need to be implemented to ensure that A. speciosus remains in this industrial green space. Our study appears to be the first application of the sample completeness curve to the identification of food plants that are utilized by A. speciosus. Calculating sample completeness curve revealed that 25 of the plant taxa identified in this study accounted for approximately 90% of the food plants in this industrial green space. Combining DNA barcoding with the sample completeness curve is thus useful for estimating plant food resources. However, the methods employed in this study have several limitations; for example, 79.7% of the obtained rbcL sequences could not be identified to species level. This occurred because the sequences of the short rbcL region examined in this study were comprised mainly of closely related species with no polymorphisms and high levels of homology 6. However, obtaining long PCR fragments from the degraded DNA samples typically found in feces can be difficult 10. It is therefore not preferable, when using feces, to amplify long fragments for analysis. To resolve this problem, a comprehensive database of rbcL sequences for the plant species that occur in the study area needs to be compiled.
The dominant haplotypes, Hap 1 and Hap 2, were almost evenly distributed in this industrial green space. It was therefore considered that the roads and pipelines (ca. 10 m) in the study area did not restrict the migration of A. speciosus in the industrial green space. In addition, Hap 3 to 6, which were captured from sites ID-1 to 4, were not captured at sites ID-5 to ID-9. It was therefore considered that migration between sites ID-4 and ID-5 was restricted by the widest road (ca. 30 m). The previous reports showed that the haplotype diversity of A. speciosus populations in suburban landscape of West Tokyo, Japan 11,and in the forest region, where migration is restricted 12, ranged from 0.77 to 0.86 and 0.83 to 0.88, respectively. On the other hand, in this study the haplotype diversity of A. speciosus population was 0.59, and the MSN structure had not ring-shaped form. Generally, ring-shaped MSN networks are considered to indicate the existence of a stable and diverse genetic structure 11. The industrial green space examined in this study is isolated by Ise Bay to the west and the Chita industrial road (ca. 30 m) to the east (Figure 1). Although A. speciosus has been shown to be highly migratory 13, it is considered that both of these physical barriers have severely restricted migration of individuals between the study area and areas further away. The relatively low genetic diversity observed in the study area was thus attributed to isolation from other populations once the population in the study area became established. Since the population of A. speciosus inthis industrial green space is isolated from populations elsewhere, there is a risk of a decrease in genetic diversity due to genetic drift 11,12.
Consequently, it is expected that the absence of further migration will result in a decrease in the genetic diversity of A. speciosuspopulation in the study area. Indeed, this isolation will likely be exacerbated as it is not possible to create a corridor for migration between the study area and areas further away. Thus, maintaining the extant mice population in the study area is an important issue. To ensure the continued survival of A. speciosuspopulation in this industrial green space will require connecting smaller industrial green spaces using green corridors each other, or reducing the width of the road dividing the smaller industrial green spaces less than 30 m, if possible. In addition, the most feasible method would be to preferentially conserve plant species that are used as food resources by this species.
Acknowledgments
We thank the staff of Aichi Refinery, Idemitsu Kosan Co., Ltd. for access to the study area, and Mr. Kitou Nobuyuki and Ms. Shibata Akane of Chubu University for their assistance with capturing mice. The work was supported by a subsidy for Environmental activities and education from Aichi Forest and Greenery in Aichi Prefecture, Japan (No. 24-122, No. 25-57, and No. 26-105), and the Challenge Site at Chubu University (No. 12-9168, No. 13-9168, and No. 14-9168).
References
- 1.Kawamoto H, Tasaki S, Ishizawa Y, Shirako M, Ueno K. (2013) Preliminary notes on Mammal fauna evaluation at green belt in Aichi Refinery of Idemitsu. , Kosan Co., Ltd., Aichi Prefecture, Japan, Annual Report of Research Institute for Biological Function.(in Japanese with English Summary) 13, 85-107.
- 2.Kellermann V, Heerwaarden B, Sgrò C, Hoffmann A. (2009) Fundamental evolutionary limits in ecological traits drive drosophila species distributions. 10-1126.
- 3.J E Stacy, P E Jorde, Steen H, R A Ims, Purvis A.(October31,1997) Lack of concordance between mtDNA gene flow and population density fluctuations in the bank vole.doi: 10.1046/j.1365-294X.1997.d01-470.x.Mol Ecol.
- 4.Tamura K, Stecher G, Peterson D, Filipski A, Kumar S. (2013) MEGA6: molecular evolutionary genetics analysis version 6.0, doi: 10.1093/molbev/mst197. , Mol. Bio. Evol
- 5.Excoffier L, Smouse P E, Quattro J M. (1992) Analysis of molecular variance inferred from metric distances among DNA haplotypes: application to human mitochondrial DNA restriction data. Genetics131 479-491.
- 6.Shirako M, Ajioka Y, Aichi M, Ueno K, D T Hoa et al. () 31,2015) Identification of Muridae species and their food resources using DNA barcoding in Cat Tien National Park, Vietnam,doi: 10.3106/041.040.0403.Mammal Study.
- 7.Chao A, N J Gotelli, T C Hsieh, E L Sander, K H Ma. (2014) Rarefaction and extrapolation with Hill numbers: A framework for sampling and estimation in species diversity studies. 10-1890.
- 8.T C Hsieh, K H Ma, Chao A. (2016) iNEXT: iNterpolation and EXTrapolation for species diversity. R package version2.0.12. (http://chao.stat.nthu.edu.tw/blog/software-download/),Accessed by2018Feb06
- 9.Nakata K, Saitoh T, M A Iwasa. (2009) Apodemus speciosus (Temminck,1844): The Wild Mammals of Japan Secondedition. , Shoukadoh, Kyoto
- 11.Hirota T, Hirohata T, Mashima M, Satoh T, Obara Y. (2004) Population structure of the large Japanese field mouse, Apodemus speciosus (Rodentia: Muridae), in suburban landscape, based on mitochondrial D-loop sequences,doi: 10.1111/j.1365-294X.2004.02324.x. Mol Ecol.
Cited by (1)
- 1.Carpintero Soledad, Reyes-López Joaquin, 2020, Indirect effect of the invasive exotic fungus Ophiostoma novo-ulmi (Dutch elm disease) on ants, Community Ecology, 21(2), 133, 10.1007/s42974-020-00023-6