
Abstract
Introduction.
Obesity often coexists with insulin resistance, which is related to cardiometabolic risk. However, some obese individuals exhibit comparable insulin sensitivity (IS) to that of normal-weight subjects, a state associated with a reduced cardiometabolic risk. We aimed to determine the efficacy of a panel of surrogate markers of insulin sensitivity (IS) for the identification of insulin sensitive obese (ISO) vs. insulin resistant obese (IRO) with similar total fat mass (FM) and body mass index (BMI).
Methods.
This is a cross-sectional analysis among 144 overweight and obese post-menopausal women. IS was determined by the hyperinsulinemic-euglycemic clamp (HEC) and by surrogate indices such as Matsuda index, the simple index assessing insulin sensitivity using oral glucose tolerance test (SIisOGTT), Abdul-Ghani liver IS index, HOMA-IR and Abdul-Ghani muscle IR index.
Results.
When using upper and lower quartiles values or the median as cut-off for IS determined by the reference HEC to define ISO vs. IRO, Matsuda index, SIisOGTT and Abdul-Ghani indices classification identified ISO vs. IRO individuals with similar FM and BMI. With HOMA-IR, the two groups were similar for FM and had borderline significant difference in BMI. Using, receiver operating characteristic curves, Matsuda index AUC was similar to that of SIisOGTT and both indices AUCs were significantly higher than Abdul-Ghani indices AUCs. The best cut-off value for the Matsuda index was 2.5 (83.1% specificity, 54.2% sensitivity) and 0.25 for SIisOGTT (64.8% specificity, 70.8% sensitivity).
Conclusion.
Whole body IS indices, Matsuda and SIisOGTT indices seem to be reliable indices for the identification of ISO vs. IRO individuals.
Author Contributions
Academic Editor: Dragan Nikolic, University of Belgrade, School of Medicine, dr Subotica 9, 11000 Belgrade, Serbia
Checked for plagiarism: Yes
Review by: Single-blind
Copyright © 2017 Belinda Elisha, et al
 This is an open-access article distributed under the terms of the Creative Commons Attribution License, which permits unrestricted use, distribution, and reproduction in any medium, provided the original author and source are credited.
Competing interests
The authors have declared that no competing interests exist.
Citation:
Introduction
Obesity is recognized as a worldwide epidemic (Haidar and Cosman 2011). The impact of excess body weight on public health is considerable, due to its association with a higher risk of type 2 diabetes, cardiovascular diseases and premature death(Adams et al. 2006). Insulin resistance (IR) defined as a reduced ability of insulin to undertake its biological effects on glucose, lipid and protein metabolism (e.g. glucose utilisation) in fat, muscle and liver(Lebovitz 2001), is a central component of cardiometabolic risk(Leiter et al.). However a sub-group of obese individuals who do not display IR, are characterized by a low prevalence of metabolic abnormalities and called Metabolically healthy but obese or insulin-sensitive obese (ISO) (Karelis et al. 2005). Identification of these individuals is interesting both for clinic and research since this obesity phenotype offers a unique ability to investigate the impact of IR on metabolic risk as it dissociates IR from its usual correlate: total fat mass (FM). For this reason, it is important to identify insulin-sensitive obese (ISO) vs. insulin -resistant obese (IRO) individuals despite comparable body mass index (BMI) and total FM. The European Group for the Study of IR (EGIR) analysis showed that nearly 25% of obese individuals (BMI >35 kg/m2) were insulin sensitive based on the reference method to measure IR: the euglycemic-hyperinsulinemic clamp (HEC)(Ferrannini et al. 1997).However, this method is not routinely used since it is time consuming, laborious and requires experienced staff(Antuna-Puente et al. 2011). Thus, in most studies, ISO individuals have been identified based on surrogate markers reflecting hepatic, muscle or global insulin sensitivity (IS) rather than using the gold standard HEC technique. The ability of these surrogate markers to discriminate ISO vs. IRO individuals (with similar total FM and BMI but showing a different IS and cardiometabolic profile) has not been investigated yet. Most of these indices are based on various mathematical combinations of fasting and stimulated insulin and glucose values to estimate global or predominantly regional tissue-specific (muscle or liver) IS and thus all formulas may capture differently the various aspects of multifaceted insulin actions (Antuna-Puente et al. 2011).
Therefore, in the present study, we sought to determine the efficacy of a panel of surrogate markers of IS when compared to the HEC for the identification of ISO vs. IRO individuals matched for BMI and total FM among a sample of well phenotyped post-menopausal overweight and obese women. We also investigated whether the classification using the extreme quartiles of IS will be different to the one using the median value of IS as cut-off.
Subjects and Methods
Subjects
For the present secondary cross-sectional analysis, the cohort examined was pooled from baseline data of two lifestyle modification intervention studies in comparable populations. Participants to the two studies: the Montreal-Ottawa New Emerging Team (MONET) Study (N=137)(Brochu et al. 2009) and the Complications Associated with Obesity (CAO) Study (N=59)(Lavoie et al. 2010)werenon-diabetic overweight and obese postmenopausal women. The studies were approved by the University of Montreal ethics committee. Subjects from both studies were recruited through newspaper advertisements and examined by our research team from 2003 to 2007. As described previously(Brochu et al. 2009, Lavoie et al. 2010), women were included in the two studies if they met the following criteria: 1) BMI≥27kg/m2, 2) biological confirmation of the menopause status and no hormone replacement therapy, 3) physical activity levels < 3h of structured exercises per week for the CAO study and <2h for the MONET study), 4) non-smokers and 5) free of known inflammatory disease. The exclusion criteria were as follows: 1) diabetes, 2) untreated thyroid disease, 3) chronic liver or renal disease, 4) asthma requiring therapy with steroids, 5) cardiovascular or peripheral vascular disease, 6) previous 3 months use of hormone replacement therapy, oestrogen, narcoleptics, steroids, or lipid-lowering or antihypertensive agents, 7) dyslipidaemia or hypertension requiring immediate medical intervention, 8) history of alcohol or drug abuse, 9) abnormal blood laboratory values (haematocrit <32 or >48%; creatinine >130μmol/l), 10) use of drugs or medications to stimulate weight loss, psychoactive drugs and adrenergic agonists by any route, 11) body-weight fluctuation ±3kg in the last 3 months (±2kg for the MONET study) and 12) known history of inflammatory disease as well as cancer.
Among the 196 subjects recruited in the two studies, 144 subjects had a complete set of baseline data for the oral glucose tolerance test (OGTT) and the HEC clamp and were thus included in the present analysis.
Oral Glucose Tolerance Test
A 2-hour 75-g OGTT was performed after 12 hours of fasting according to the guidelines of the American Diabetes Association(Sacks et al. 2011). Blood samples were collected at 0, 30, 60, 90 and 120 min. Plasma glucose was measured on the COBAS INTEGRA 400+ (Roche Diagnostic, Montreal, Canada). Radioimmunoassay kits (RIA, Medicorp, Montreal, Canada) were used to measure insulin levels in duplicate.
Fasting and OGTT-Derived Indices of IS
The fasting and OGTT-derived IS indices were calculated as previously published (Table 1)(Matthews et al. 1985, Matsuda and DeFronzo 1999, Katz et al. 2000, Abdul-Ghani et al. 2007, Bastard et al. 2007, Tousignant et al. 2008). The simple index assessing IS using OGTT (SIisOGTT) was previously developed and validated using data from 107 participants of the present study(Bastard et al. 2007). Among the overweight and obese postmenopausal women, the SIisOGTT was highly correlated with whole body insulin sensitivity assessed by HEC (Bastard et al. 2007). The ISI-Matsuda index is a composite estimate of both hepatic and muscle IS, which was correlated with whole-body IS determined by the HEC among men and women with a wide range of BMI and varying degrees of glucose tolerance(Matsuda and DeFronzo 1999). The Homeostasis Model of Assessment - IR (HOMA-IR) which derived from fasting insulin and glucose levels reflects rather hepatic IS (Matthews et al. 1985). In addition, Abdul-Ghani et al. proposed an hepatic IS index estimating both basal and OGTT-suppressed hepatic glucose production and a muscle IS index calculated as the rate of glucose decline from peak to nadir during OGTT and reflecting both muscle glucose uptake and insulin secretory response to hyperglycemia (Abdul-Ghani et al. 2007).
Table 1. Formulas of insulin sensitivity/resistance derived indices from fasting glucose and insulin or OGTT values.| Indices | Formulas |
|---|---|
| HOMA-IR(Matthews et al. 1985) | (fasting glucose)(mmol/l)*(fasting insulin)(μUI/ml)/22.5 |
| ISI-Matsuda(Matsuda and DeFronzo 1999) | 10000/square(fasting glucose(mg/dl)*fasting insulin(μUI/ml)*mean glucose(mg/dl)*mean insulin(μUI/ml) |
| SIisOGTT(Bastard et al. 2007) | 1/[log(sum glucose t0–30–90–120) (mmol/l) + log(sum insulin t0–30–90–120) (μUI/ml)] |
| Vangirapurapu liver IR index(Vangipurapu et al. 2011) | -0.091 + (log insulin AUC 0–120 min * 0.400) + (log fat mass % * 0.346) ) (log HDL-C* 0.408) + (log BMI *0.435) |
| Abdul-Ghani liver IS Index(Abdul-Ghani et al. 2007) | (insulin AUC 0–30 min)*(glucose AUC 0–30 min) |
| Abdul-Ghani muscle IR index(Abdul-Ghani et al. 2007) | (dG/dt )/mean plasma insulin concentrationdG/dt is the rate of decline in plasma glucose concentration and is calculated as the slope of the least square fit to the decline in plasma glucose concentration from peak to nadir. |
Hyperinsulinemic-euglycemic clamp
IS was assessed by the HEC technique (DeFronzo et al. 1979).Details on the technique have been previously described (Tousignant et al. 2008, Brochu et al. 2009). Briefly, at baseline 3 blood samples were taken over 40 min, after which insulin was infused at a prime constant rate of 75 mU/m2·min for 180 min. Plasma glucose was measured every 5-10 min with a glucose analyzer and maintained at the fasting level using variable infusion rates of 20% dextrose. IS was measured as glucose infusion rate (GIR) during the last 30 min of the steady state of the clamp and expressed as milligrams of infused glucose per minute per kilogram of lean body mass (mg/min/kg of LBM).
Body Composition and Body Fat Distribution
As previously described (Karelis et al. 2005, Messier et al. 2008, Lavoie et al. 2010), body weight, LBM and total FM were measured using dual-energy x-ray absorptiometry (General Electric Lunar Corporation version 6.10.019, Madison, WI). A wall stadiometer (Perspective Enterprises, Portage, MI) was used to measure standing height. BMI was calculated as follows: BMI (kg/m-2) = [body weight/height2]. Waist circumference (WC) was measured with a non-extendable linear tape measure at the mid-distance between the lowest rib and the iliac crest (Strychar et al. 2009).
Visceral Fat Measurement and Estimation
A GE High Speed Advantage CT-scanner (General Electric Medical Systems, Milwaukee, WI, USA) was used to measure visceral fat (VAT) area expressed in cm². The subjects were examined in supine position with both arms stretched above their head. The position of the scan was established at L4-L5 vertebral disc using a scout image of the body. VAT area was quantified by delineating the intra-abdominal cavity at the internal most aspect of the abdominal and oblique muscle walls surrounding the cavity and the posterior aspect of the vertebral body. The cross-sectional areas of adipose tissue were highlighted and computed with an attenuation range of - 190 to - 30 Hounsfield Units (HU). VAT distribution was estimated by the visceral adiposity index (VAI) as: VAI= (WC/36.58+1.89*BMI)*(TG/0.81)*(1.52/HDL-C) (Amato et al. 2010).
Biochemical measurements
After 12 hours overnight fast, venous blood samples were collected. Fasting total cholesterol, HDL-C, triglycerides (TG), apoliprotein-B (ApoB), and liver enzymes were measured as previously described (Karelis et al. 2005, 2008, Brochu et al. 2008, Messier et al. 2008, Strychar et al. 2009, Lavoie et al. 2010, 2012). Serum high-sensitivity c-reactive protein (hs-CRP) was assessed by immunonephelometry on an Image analyser (Beckman Coulter). Using TG levels and WC measurement, we calculated the lipid accumulation product (LAP= (WC- 58) * TG), which was suggested as a novel index of lipid over accumulation among adult to predict the risk of metabolic syndrome (Kahn and Valdez 2003). According to previous studies, the LAP is better than BMI for diabetes and cardiovascular risk prediction (Kahn 2006) and has been associated with increased mortality in normal weight postmenopausal women (Wehr et al. 2011).
Hepatic fat accumulation was estimated using the fatty liver index (FLI= (e 0.953*log (TG) + 0.139*BMI + 0.718*log (ggt) + 0.053*WC - 15.745) / (1 + e 0.953*log (TG) + 0.139*BMI + 0.718*log (ggt) + 0.053*WC - 15.745) * 100), which is an equation based on BMI, WC, TG and GGT. The FLI algorithm has been developed and validated against liver ultrasonography results among 216 subjects with and 280 without suspected liver disease. The index had an accuracy of 0.84 (95%CI 0.81–0.87) for fatty liver detection. A FLI < 30 rules out and a FLI ≥ 60 rules in fatty liver (Bedogni et al. 2006).
Statistical Analyses
The data were expressed as mean ± SD. Subjects were classified into quartiles, according to HEC results and then using each of the surrogates IS indices. IRO and ISO individuals were defined as those categorised in the lowest and upper IS quartile, respectively. Student's t-test was used for comparisons between groups (ISO vs. IRO). We determined the best fitting surrogate IS indices to discriminate ISO and IRO individuals with similar BMI and total FM, using HEC results as the reference method for categorisation. After that, we determined whether median cut-off values were just as much discriminating, as extreme quartile values to categorize ISO and IRO individuals. Thus, the best discriminating surrogate indices for IS quartile categorisation were tested for median categorisation. Finally, we used a Receiver operating characteristic (ROC) curves analysis to determine the sensitivity and the specificity of each surrogate IS indices to identify IRO individuals, using HEC as the reference method. Area under the curve (AUC) ROC comparisons were performed using Student's t-test(Hanley and McNeil 1983). Statistical analysis was performed using SPSS Version 17.0 for Windows (Chicago, IL, USA) and MedCalc Version 11.6.1.0 (Mariakerke, Belgium). Statistical significance was set at p < 0.05.
Results
Physical and metabolic characteristics of the 144 participants are described in Table 2. Classification of ISO vs. IRO individuals according to quartiles of HEC results, whole body IS indices (SIisOGTT and Matsuda) and muscular IS index (Abdul-Ghani) are presented in Table 3. Using classification according to the HEC results, ISO and IRO individuals exhibited similar BMI (ISO: 32.4±4.3.4 kg/m2, IRO: 33.9±3.4 kg/m2; p=0.19) and total FM (ISO: 38.9±7.3 kg, IRO: 41.3±7.4; p=0.16). Similar results were obtained with SIisOGTT, Matsuda Index and Abdul-Ghani muscle IR index. On the other hand, the IS classification based on HEC demonstrated that ISO individuals displayed significantly lower WC (ISO: 101.0±7.3cm, IRO: 108.1±8.9cm; p=0.001) and VAT area (ISO: 172.9±50.8cm2, IRO: 222.5±59.5 cm2; p<0.001). Classification based on the SIisOGTT or the Matsuda Index quartiles showed similar results.
Table 2. Characteristics of participants (n=144).| Parameters | Mean±SD | Range |
| Weight (kg) | 85.5±12.8 | 63.8-130.3 |
| BMI (kg/m2) | 32.9±4.0 | 27.0-48.5 |
| Waist circumference (cm) | 104.3±10.7 | 81.5-153.0 |
| Lean body mass (kg) | 43.0±5.6 | 32.6-59.6 |
| Fat mass (kg) | 40.1±8.6 | 25.2-73.1 |
| VAT (cm2) | 187.9±52.8 | 80.2-345.6 |
| Fasting glucose (mmol/l) | 5.3±0.5 | 4.1-6.8 |
| Fasting insulin (µUI/ml) | 16.1±6.1 | 5.3-39.5 |
| TG (mmo/l) | 1.6±0.7 | 0.5-4.4 |
| HDL-C (mmol/l) | 1.4±0.3 | 0.9-2.5 |
| Total Cholesterol (mmol/l) | 5.4±0.9 | 3.1-7.5 |
| Glucose 2h (mmo/l) | 6.4±1.8 | 3.0-11.0 |
| Insulin 2h (µUI/ml) | 87.6±69.0 | 7.4-567.8 |
| GIR (mg/min/kg of LBM) | 11.8±3.2 | 5.3-22.9 |
| hs-CRP (g/l) | 3.2±2.2 | 0.4-9.6 |
| AST (IU/l) | 21.0±6.7 | 10.8-45.3 |
| ALT(IU/l) | 25.7±14.0 | 6.0-96.0 |
| GGT(IU/l) | 27.4±26.3 | 6.7-214.2 |
| Systolic Blood Pressure (mmHg) | 122±14 | 92-159 |
| Diastolic Blood pressure (mmHg) | 77±8 | 61-99 |
However, using the classification of IS according to the Abdul-Ghani muscle IR index, groups were comparable for WC (p=0.13) even though IRO individuals displayed significantly higher VAT area than ISO individuals (p<0.001).
Table 3. Classification of insulin sensitive obese vs. insulin resistant obese using extreme quartiles hyperinsulinemic-euglycemic clamp values, indices of whole body insulin or muscle insulin sensitivity.| Glucose infusion rates | SIisOGTT | ISI-Matsuda | Abdul-Ghani muscle insulin resistance index | |||||
| ISO(≥13.6; N=35) | IRO(≤9.7; N=36) | ISO(≥0.27;N=35) | IRO(≤0.25;N=35) | ISO(≥3.9;N=35) | IRO (≤2.0;N=36) | ISO(≥8.7.10-4; N=35) | IRO (≤3.4.10-4; N=35) | |
| BMI (kg/m2) | 32.2±3.4 | 33.9±3.4 | 32.2±4.5 | 33.1±3.4 | 32.2±4.3 | 33.4±3.2 | 32.3±4.2 | 33.5±4.2 |
| WC (cm) | 101.0±7.3 | 108.1±8.9** | 100.5±11.7 | 106.4±9.7* | 101.9±11.5 | 107.1±9.2* | 102.3±10.5 | 106.2±10.7 |
| LBM (kg) | 41.2±4.3 | 46.0±6.2# | 41.6±4.5 | 43.8±5.2 | 41.2±4.8 | 44.1±5.2* | 42.8±6.0 | 43.4±6.0 |
| Fat mass (kg) | 38.9±7.3 | 41.3±7.4 | 39.0±9.8 | 39.3±5.9 | 39.1±9.2 | 40.5±5.7 | 38.4±9.1 | 42.0±9.4 |
| VAT (cm2) | 172.9±50.8 | 222.5±59.5# | 161.5±37.4 | 211.3±61.9# | 167.2±44.5 | 211.3±60.8** | 167.8±36.1 | 215.1±51.0# |
| VAI | 1.7±0.9 | 3.2±1.0# | 1.7±0.7 | 3.4±1.6# | 1.9±0.77 | 3.3±1.6# | 2.0±1.2 | 2.7±1.3* |
| Fasting glucose (mmol/l) | 5.3±0.5 | 5.5±0.5 | 5.1±0.4 | 5.6±0.6# | 5.1±0.4 | 5.7±0.5# | 5.2±0.5 | 5.3±0.5 |
| Fasting insulin (µUI/ml) | 13.4±4.0 | 21.1±6.7# | 11.5±3.5 | 22.5±6.4# | 10.1±2.5 | 23.5±5.4# | 12.3±4.6 | 21.2±6.8# |
| Glucose 2h (mmol/l) | 5.6±1.3 | 7.5±1.8# | 5.3±1.2 | 7.6±2.0# | 5.6±1.5 | 7.9±2.1# | 5.8±1.8 | 6.8±1.9* |
| Insulin 2h (µUI/ml) | 54.5±36.3 | 136.2±102.2# | 38.1±14.9 | 172.2±91.0# | 42.5±18.2 | 162.7±95.2 | 46.5±23.8 | 132.2±106.0# |
| TG (mmo/l) | 1.3±0.5 | 2.1±0.9# | 1.3±0.4 | 2.1±0.9** | 1.4±0.5 | 2.1±0.9# | 1.5±0.7 | 1.8±0.7 |
| HDL-C (mmol/l) | 1.6±0.3 | 1.3±0.3** | 1.5±0.3 | 1.3±0.3** | 1.5±0.3 | 1.3±0.3* | 1.5±0.3 | 1.3±0.2* |
| ApoB (g/l) | 0.9±0.2 | 1.1±0.2** | 0.9±0.2 | 1.1±0.2** | 0.9±0.2 | 1.1±0.2** | 1.0±0.2 | 1.0±0.3 |
| SBP (mmHg) | 123±15 | 124±13 | 120±11 | 124±16 | 120±12 | 124±15 | 123±13 | 125±14 |
| DBP (mmHg) | 77±9 | 77±7 | 77±8 | 78±9 | 76±8 | 77±8 | 77±8 | 78±8 |
| hs-CRP (mg/l) | 2.5±1.7 | 4.1±2.0# | 2.1±1.4 | 4.0±2.0# | 2.5±1.8 | 4.4±1.9# | 2.7±2.0 | 3.9±1.8* |
| AST (IU/l) | 20.0±6.1 | 22.1±7.0 | 19.5±6.3 | 24.4±8.4** | 19.8±7.2 | 24.1±8.3* | 20.1±7.1 | 23.0±8.1 |
| ALT (IU/l) | 21.8±10.5 | 29.8±13.2** | 19.9±9.4 | 33.7±19.6# | 20.28±9.3 | 33.8±19.2# | 21.3±9.2 | 30.9±17.8** |
| GGT (IU/l) | 21.5±13.2 | 35.2±40.6 | 22.5±19.4 | 39.6±41.9* | 23.2±19.9 | 42.1±41.8* | 22.5±18.9 | 35.4±30.5* |
| LAP | 56.8±24.5 | 03.4±46.0# | 54.9±17.5 | 103.4±46.3# | 61.0±22.6 | 102.2±45.9# | 64.1±28.8 | 85.6±36.0** |
| FLI | 63.5±19.4 | 82.5±14.6# | 61.8±18.8 | 81.1±17.8# | 65.5±17.0 | 83.1±15.9# | 66.0±16.7 | 78.8±16.7** |
Considering glucose homeostasis, fasting insulin and 2h-OGTT glucose and insulin levels were significantly lower in ISO vs IRO individuals defined with HEC results, SIisOGTT, Matsuda or Abdul-Ghani muscle IR indices. However, fasting glucose was lower in ISO individuals only when ISO was defined using SIisOGTT or Matusda index. ISO individuals displayed more favourable lipid and inflammatory profiles than IRO individuals. No significant difference was observed for systolic and diastolic blood pressure whatever the quartiles classification. Elevated alanine aminotransferase (ALT) values were observed in IRO individuals defined with HEC results or global IS indices. Finally, ISO individuals demonstrated significant lower FLI, LAP and VAI compared to IRO individuals whatever the quartiles classification.
Table 4 shows ISO vs. IRO classification according to liver IS surrogate indices. Using the HOMA-IR index, IS groups displayed similar FM but different BMI (p=0.047). Similar differences in cardiometabolic parameters between ISO and IRO individuals were observed with the Abdul-Ghani liver IS index and HEC results quartiles classifications except for fasting and 2h-OGTT glucose. As shown in the Table 5, individuals were then defined as ISO and IRO depending on the median cut-off value of HEC results, Matsuda index, SIisOGTT and Abdul-Ghani muscle and liver index. ISO and IRO individuals were matched for BMI, total FM as well as for WC whatever the median value classification but ISO individuals displayed significantly lower VAT area than IRO individuals (from p<0.05 to p<0.001). Cardiometabolic markers differences observed in quartile value classification (Table 3 and Table 4) remain significant between ISO and IRO individuals whatever the median value classification.
Table 4. Classification of insulin sensitive obese vs. insulin resistant obese according to extreme quartiles of liver insulin resistance/sensitivity.| HOMA-IR | Abdul-Ghani Liver IS index | |||
| Parameters | ISO(≤2.5;N=36) | IRO(≥4.2;N=35) | ISO(≤20.103 N=39) | IRO(≥41.103 N=39) |
| BMI (kg/m2) | 32.3±4.5 | 34.2±3.1* | 31.3±3.0 | 32.5±3.6 |
| WC (cm) | 103.4±12.4 | 107.7±8.9 | 98.9±8.5 | 104.0±8.9* |
| LBM (kg) | 41.1±5.1 | 46.1±5.4# | 40.3±4.2 | 43.0±4.6* |
| Fat mass (kg) | 39.8±10.1 | 41.9±7.0 | 37.3±7.0 | 38.4±6.3 |
| VAT (cm2) | 172.3±47.7 | 219.3±58.0** | 164.3±47.5 | 206.3±52.7** |
| VAI | 1.8±0.9 | 3.3±1.7# | 2.0±1.1 | 2.9±1.7** |
| Fasting glucose (mmol/l) | 5.1±0.3 | 5.5±0.5** | 5.2±0.4 | 5.5±0.5* |
| Fasting insulin (µUI/ml) | 11.3±3.7 | 22.6±5.6# | 11.5±2.9 | 21.3±6.3# |
| Glucose 2h (mmol/l) | 5.9±1.5 | 7.7±2.0# | 6.1±1.4 | 6.8±2.2 |
| Insulin 2h (µUI/ml) | 56.4±24.7 | 141.9±105.1# | 56.3±29.4 | 132.8±99.4# |
| TG (mmo/l) | 1.4±0.5 | 2.1±0.9** | 1.5±0.6 | 1.9±0.9* |
| HDL-C (mmol/l) | 1.5±0.3 | 1.3±0.2** | 1.5±0.3 | 1.3±0.3* |
| ApoB (g/l) | 0.9±0.2 | 1.1±0.2* | 0.9±0.2 | 1.1±0.2** |
| SBP (mmHg) | 121±14 | 125±15 | 120±11 | 125±16 |
| DBP (mmHg) | 76±8 | 78±8 | 76±7 | 78±9 |
| hs-CRP | 2.6±1.8 | 4.2±2.3** | 2.7±2.2 | 3.9±2.0 |
| AST (IU/l) | 19.5±5.4 | 22.3±7.5 | 18.9±4.8 | 23.6±8.3** |
| ALT (IU/l) | 21.7±7.6 | 31.4±15.9** | 21.8±10.4 | 32.2±19.2** |
| GGT (IU/l) | 21.7±14.5 | 39.1±41.6* | 23.2±15.1 | 37.7±42.2 |
| LAP | 60.2±22.9 | 102.5±47.9# | 61.8±29.3 | 87.7±48.6** |
| FLI | 65.4±17.0 | 84.4±13.2# | 63.0±17.0 | 74.3±19.4* |
A ROC curve analysis was performed (Figure 1) to determine the ability of IS surrogate indices to discriminate ISO vs. IRO individuals using HEC as the reference method and the median GIR value as cut-off (median=11.59 mg/min/kg of LBM). Matsuda and SIisOGTT ROC AUCs were similar (0.73± 0.04 and 0.74± 0.04; p=0.57, respectively) and significantly higher than Abdul-Ghani liver and muscle indices AROCs(0.65± 0.05 and 0.63±0.05, respectively), which were equivalent (p=0.62). The best cut-off values were 2.5 for Matsuda index (sensitivity: 54.2% and specificity: 83.1%) and 0.26 for SIisOGTT (sensitivity: 70.8% and specificity: 64.8%).
Table 5. Classification of insulin sensitive obese vs. insulin resistant obese individuals using hyperinsulinemic euglycemic clamp values, indices of whole body insulin or muscle insulin sensitivity according to median values.| Glucose infusion rates | ISI-Matsuda | SIisOGTT | Abdul-Ghani muscle IR index | Abdul-Ghani Liver IS index | ||||||
| ISO (≥11.6; =72) | IRO (<11.6; N=72) | ISO (≥2.8; N=72) | IRO (<2.8; N=72) | ISO (≥0.26;N=72) | IR (<0.26;N=72) | ISO(≥5.8.104;N=72) | IRO (<5.8.10-4;N=72) | ISO (<28.104; N=72) | IRO (≥28.104; N=72) | |
| BMI (kg/m2) | 33.1±4.3 | 32.6±4.6 | 32.4±4.3 | 33.3±3.7 | 32.9±4.4 | 32.8±3.5 | 32.6±3.9 | 33.1±4.1 | 32.6±3.8 | 33.1±4.2 |
| WC (cm) | 104.5±11.4 | 104.1±10.1 | 102.9±11.6 | 105.7±9.6 | 103.6±12.1 | 105.1±9.1 | 103.2±10.8 | 105.3±10.5 | 103.5±11.6 | 105.1±9.7 |
| Fat free mass (kg) | 42.5±4.8 | 43.6±6.3 | 42.0±5.4 | 44.1±5.6* | 42.4±5.6 | 43.7±5.6 | 43.3±5.3 | 42.7±5.8 | 42.5±5.4 | 43.6±5.8 |
| Fat mass (kg) | 41.1±9.6 | 39.1±7.5 | 39.6±9.2 | 40.5±8.1 | 40.7±10.1 | 39.5±6.8 | 39.3±8.4 | 40.7±8.8 | 40.1±8.7 | 40.0±8.6 |
| VAT (cm2) | 177.4±46.5 | 198.3±56.7* | 168.7±42.5 | 206.3±55.3# | 173.5±45.9 | 202.1±55.5** | 176.5±49.6 | 198.0±53.6* | 178.1±50.3 | 197.6±53.7* |
| VAI | 1.9±0.9 | 2.8±1.5# | 1.8±0.8 | 2.8±1.6# | 1.8±0.7 | 2.8±1.6# | 2.0±1.2 | 2.6±1.4* | 2.0±1.0 | 2.7±1.5** |
| Fasting glucose (mmol/l) | 5.2±0.5 | 5.4±0.5 | 5.1±0.4 | 5.5±0.5# | 5.1±0.4 | 5.5±0.5# | 5.3±0.4 | 5.3±0.5 | 5.2±0.4 | 5.4±0.5* |
| Fasting insulin (µUI/ml) | 13.9±4.6 | 18.2±6.7* | 11.9±3.1 | 20.2±5.6# | 13.0±3.9 | 19.1±6.4# | 13.6±4.3 | 18.4±6.7# | 12.6±3.6 | 19.5±6.2# |
| Glucose 2h (mmol/l) | 5.8±1.4 | 7.0±1.9* | 5.7±1.4 | 7.1±1.9# | 5.6±1.3 | 7.2±1.8# | 6.3±1.7 | 6.5±1.8 | 6.1±1.5 | 6.8±1.9* |
| Insulin 2h (µUI/ml) | 66.1±41.9 | 108.8±82.8* | 53.2±21.8 | 121.5±81.8# | 51.0±20.5 | 123.7±80.2# | 63.2±36.9 | 112.3±84.0# | 60.1±27.6 | 115.5±85.5# |
| TG(mmo/l) | 1.4±0.5 | 1.9±0.8* | 1.4±0.5 | 1.8±0.8** | 1.4±0.5 | 1.8±0.8** | 1.5±0.7 | 1.7±0.7* | 1.4±0.5 | 1.8±0.8** |
| HDL-C (mmol/l) | 1.5±0.3 | 1.4±0.3* | 1.5±0.3 | 1.4±0.3** | 1.5±0.3 | 1.4±0.3* | 1.5±0.3 | 1.4±0.3 | 1.5±0.3 | 1.4±0.3* |
| ApoB (g/l) | 0.9±0.2 | 1.1±0.2** | 0.9±0.2 | 1.0±0.2** | 0.9±0.2 | 1.0±0.2* | 1.0±0.2 | 1.0±0.2 | 0.9±0.2 | 1.1±0.2** |
| SBP (mmHg) | 121±13 | 122±14 | 120±13 | 124±14 | 121±13 | 122±15 | 121±13 | 123±14 | 122±12 | 122±15 |
| DBP (mmHg) | 76±8 | 77±7 | 76±7 | 77±8 | 77±8 | 77±8 | 76±8 | 77±8 | 77±7 | 77±9 |
| hs-CRP (mg/l) | 2.9±2.1 | 3.6±2.2 | 2.7±2.1 | 3.7±2.1** | 2.8±2.0 | 3.6±2.2* | 2.6±2.1 | 3.8±2.1** | 2.7±2.0 | 3.8±2.2** |
| AST (IU/l) | 20.6±6.4 | 21.4±7.0 | 19.7±6.3 | 22.3±7.0* | 19.6±5.7 | 22.4±7.4* | 19.7±5.8 | 22.4±7.3* | 19.7±5.5 | 22.3±7.6* |
| ALT (IU/l) | 23.3±12.4 | 28.2±15.0* | 22.0±11.1 | 29.4±15.5** | 22.1±10.6 | 29.3±15.9** | 21.6±9.3 | 29.9±16.5# | 22.1±9.8 | 29.4±16.5** |
| GGT (IU/l) | 23.1±15.9 | 31.7±33.1* | 23.0±18.3 | 31.8±31.8* | 22.5±17.2 | 32.3±32.2* | 21.7±17.1 | 33.1±32.*3 | 23.1±17.1 | 31.8±32.6* |
| LAP | 63.1±26.1 | 85.5±42.9* | 61.8±23.0 | 86.8±43.9# | 62.0±23.4 | 76.2±17.3# | 65.7±33.3 | 82.2±38.6** | 65.2±27.4 | 83.6±43.3** |
| FLI | 68.4±19.5 | 74.7±17.8* | 66.2±18.0 | 76.9±18.3** | 66.9±19.4 | 76.2±17.3** | 66.4±19.3 | 76.5±17.0* | 68.4±17.8 | 74.8±19.5* |
Figure 1.Receiver operating characteristic curves of Abdul-Ghani liver insulin sensitivity index, Abdul-Ghani muscle insulin resistance index, Matsuda index and the simple index for insulin sensitivity (SIisOGTT) for classification of insulin sensitive obese vs. insulin resistant obese individuals among postmenopausal women (N=144).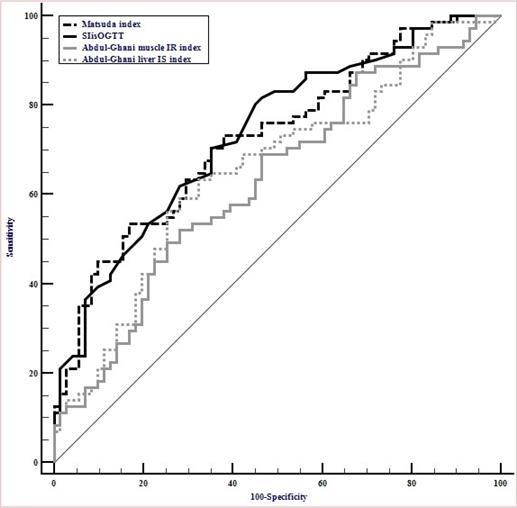
Discussion
The aim of the present investigation was to determine the ability of surrogate indices of IS to identify ISO vs. IRO individuals in a postmenopausal overweight and obese women population with similar BMI and total FM but with a large variation in IS according to the classification obtained using the gold standard HEC technique.
Comparison of ISO vs IRO individuals is useful to investigate cardiometabolic risk markers abnormalities related to IR regardless of the confounding effect of major differences in weight/adiposity. The relationship between body fat distribution and IS is well established. It was demonstrated in a sample of morbidly obese individuals (BMI = 45 ± 1.3 kg/m2) that independently of BMI and total FM, increased VAT area was associated with IRO obesity (Klöting et al. 2010). Accordingly, the LAP index was significantly higher in IRO than ISO individuals. Indeed, LAP has been demonstrated to be closely related to IR and reflect increase in WC and TG over time (Xia et al. 2012). We also found that IRO individuals presented significantly higher fat accumulation in the liver as estimated by FLI than ISO individuals.
Using HOMA-IR to define the quartile of IRO individuals, we observed that IRO and ISO individuals were not matched for BMI and total FM indicating that differences observed in cardiometabolic risk markers could be partly attributed to the difference in FM between groups. The HOMA-IR is a simple surrogate index of IR requiring only fasting insulin and glucose levels. Due to its simplicity, this index is widely used to estimate IR for research purposes and in clinical practice. Using a HOMA-IR cut-off value ≥2.5, Calori et al. (Calori et al. 2011) categorized ISO and IRO individuals with similar BMI. However, IRO individuals were older, and 28% had type 2 diabetes. In another study using the same HOMA-IR cut-off value, ISO and IRO individuals’ categorization leaded to significant different BMI between groups (Kuk and Ardern 2009). For both studies, neither sex nor FM measurements were considered to match the individuals. Discrepancies between results might be due to differences between studies samples and the absence of standardisation for insulin assay (Antuna-Puente et al. 2011). Categorization of ISO and IRO individuals using quartiles of Abdul-Ghani liver IS index values, leaded to similar BMI and body FM between groups. These anthropometric parameters are not included in the index formula. Thus, Abdul-Ghani liver IR index is probably a relevant liver IS surrogate index to identify hepatic IR among obese individuals independently of fat mass.
The Abdul-Ghani muscle IR index demonstrated a good ability to discriminate ISO vs. IRO groups for comparable BMI and total FM. Muscle is considered as the major site of insulin-stimulated glucose uptake and has an important contribution to GIR (Kahn and Flier 2000). We then speculated that the accumulation of ectopic lipids in muscle could have impaired insulin signalling and lead to IR (Kelley and Mandarino 2000).
The two whole body IS surrogate indices showed a reasonable ability to define ISO vs. IRO individuals matched for BMI and total FM. Using a ROC analysis, these IS indices exhibited better performance than Abdul-Ghani liver and the muscle IS indices to identify IRO individuals. The higher sensitivity and specificity of SIisOGTT could be due to the fact that this index has been developed and validated against the HEC results in 107 participants included in the present study cohort. However, the Matsuda index, which validation was determined in another cohort, showed similar results as the SIisOGTT. Moreover, it is interesting to note that both SIisOGTT and Matsuda index have been recently proposed as reliable index to predict IS in non-diabetic population (Pisprasert et al. 2012). In our study, IRO individuals demonstrated higher estimated liver fat accumulation than ISO individuals. A previous cross-sectional investigation showed that ISO individuals had less liver fat (direct measure) than IRO subjects and the two groups were distinguished on the basis of lipid accumulation in liver but not subcutaneous or visceral fat (Stefan et al. 2008). Moreover, Fabbrini and et al. (Fabbrini et al. 2009), reported that intrahepatic triglyceride content was associated to IR and increased TG secretion. Surprisingly, we found that liver IR indices were less effective than the muscle and whole body indices to differentiate these two groups. Our results could be explained by a possible disconnection between liver fat and IS. It should also be emphasized that we performed the HEC technique using relatively high dose of insulin. Thus, our measurement of whole body insulin probably reflected more skeletal muscle than liver glucose utilization. Indeed, HEC performed with classical low insulin rate (i.e. 40 MU/m2/min) are more likely to show liver IS.
The correlation of adipokines such as adiponectin, resistin and leptin with visceral obesity as well as IR is now well established. We could therefore speculate that the prediction of IS/IR by the surrogate indices of IR might be strengthened by adding those biomarkers in the algorithms. Indeed, a recent sub study using as sample of postmenopausal overweight and obese women from the MONET population has shown promising results by using indices integrating adipokines to estimate IR/IS (Vatier et al. 2017). However, future studies are needed on a wider scale and more diverse populations to validate those indices.
We acknowledge several limitations of our study. IS indices were used to discriminate ISO vs. IRO groups of individuals without allowing defining single individuals as IS or IR obese. Our sample was composed of non-diabetic, obese and overweight postmenopausal women, limiting our conclusions to this population. Indeed, we identified cut-off points for Mastsuda and SIisOGTT indices but they need to be confirmed by independent research teams in other cohort of subjects including men and using other reliable insulin measurement’s kits allowing the surrogate indices calculation. Nevertheless, such “biological tool” is particularly interesting in non-diabetic overweight and obese subjects susceptible to be ISO or IRO. We performed HEC with high dose of insulin and therefore might be more consistent with muscle glucose disposal rate. However, many previous studies found similar excellent correlation between HEC tests with lower insulin infusion dose and the best surrogate indices highlighted in the present study (Patarrão et al. 2014). In addition, most indices used are based on stimulated glucose and insulin concentrations and thus results can be confounded by endogenous insulin secretion as well as variable insulin clearance. However, this is also the case for fasting indices whose do not permit to clearly make the difference in IR, IS and insulin clearance, which are all inter-related in insulin resistance subjects. Hepatic fat infiltration has been estimated and not directly measured. Moreover, it should be stressed that the cut-off numerical values of Matsuda and SlisOGTT indexes reported in this paper are valid only in our lab. Both Matsuda and SlisOGTT indices heavily depend on insulin concentration values, and unfortunately the insulin assay is still not standardized (Borai et al. 2010).Thus, validating cut-off values will need both the standardization of insulin assay as well as prospective cohorts with accepted cardiometabolic end-points. It should also be noticed that we do not have a comparison group of a non-obese non-diabetic healthy postmenopausal women. Thus whether the ISO group based on HEC technique displayed similar insulin sensitivity with such control group remains to be clarified. However, in a previous independent study among non obese non diabetic healthy individuals, authors found similar mean value of glucose infusion rates when compared to our ISO group (Pisprasert et al. 2012). Finally, the cross-sectional design of our study does not allow to determine any causal association between the IS status and related cardiometabolic risk markers independently of BMI and total FM. Longitudinal studies may improve this point in the future. Nevertheless, our results are strengthened by the use of gold standard HEC for IS measurement as well as CT-scan for VAT quantification.
In conclusion, our results confirmed that despite similar BMI and total FM, IRO patients exhibited more VAT accumulation and cardiometabolic risk markers than ISO individuals. Moreover, some surrogate indices of IS/IR are not valid index to identify ISO and IRO individuals because the presence of cardiometabolic risk factors need to be assessed independently of BMI and total fat mass. In our sample of postmenopausal obese and overweight women, despite some limitations, whole body surrogate indices of IS are more in line with the classification based on the golden-standard GIR results compared to regional IS surrogates indicators.
Authors Contributions
Design and conduct the study: BE, DP, RRL, JPB
Data collection and analysis: BE, KC, NT, ADK, DP, RRL
Data interpretation: BE, KC, SF, NT, ED, RRL, JPB
Manuscript writing: BE, KC, RRL, JPB
Funding
Funding was obtained from CIHR (MONET project) & Genome Canada (CAO project) operating grants as well from the J-A DeSève research chair awarded to RRL. BE is supported by a Vanier scholarship. KC is supported by a CIHR scholarship. RRL is supported by a FRQ-S (Fonds de Recherche en Santé du Québec) scholarship.
Statement of Human Rights
All procedures followed were in accordance with the ethical standards of the responsible committee on human experimentation (institutional and national) and with the Helsinki Declaration of 1975, as revised in 2008.
Statement of Informed Consent
Informed consent was obtained from all patients for being included in the study.
Abbreviations
ALT, Alanine aminotransferase; ApoB, apoliprotein-B; AST, Aspartate aminotransferase; AUC, Area under the curve, BMI, body mass index; CAO, the Complications Associated with Obesity; DBP, diastolic blood pressure; FLI, Fatty liver index; FM, total fat mass; GIR, glucose infusion rate; GGT, Gamma-glutamyl transpeptidase; HDL-C, high density lipoprotein cholesterol; HEC, hyperinsulinemic-euglycemic clamp; HOMA-IR, homeostasis model assessment- insulin resistance; hs-CRP, high sensitive c-reactive protein; IR, insulin resistance; IRO, insulin resistant obese; IS, insulin sensitivity; ISI, Insulin sensitivity index; ISO, insulin sensitive obese; LAP, lipid accumulation product; LBM, lean body mass; MONET, the Montreal-Ottawa New Emerging Team; OGTT, oral glucose tolerance test; ROC, Receiver operating characteristic; SBP, Systolic blood pressure; SIisOGTT: simple index assessing insulin sensitivity using oral glucose tolerance test;TG, triglycerides; VAI, the visceral adiposity index; WC, Waist circumference.
Acknowledgements
We sincerely thank patients for their participation in this study.
References
- 1.M A Abdul-Ghani, Matsuda M, Balas B, R A DeFronzo. (2007) Muscle and liver insulin resistance indexes derived from the oral glucose tolerance test. , Diabetes Care 30(1), 89-94.
- 2.K F Adams, Schatzkin A, T B Harris, Kipnis V, Mouw T et al. (2006) Overweight, obesity, and mortality in a large prospective cohort of persons 50 to 71 years old. , N. Engl. J. Med 355(8), 763-78.
- 3.M C Amato, Giordano C, Galia M, Criscimanna A, Vitabile S et al. (2010) Visceral Adiposity Index: a reliable indicator of visceral fat function associated with cardiometabolic risk. , Diabetes Care 33(4), 920-2.
- 4.Antuna-Puente B, Disse E, Rabasa-Lhoret R, Laville M, Capeau J et al. (2011) How can we measure insulin sensitivity/resistance? Diabetes Metab. 37(3), 179-88.
- 5.J P Bastard, J M Vandernotte, Faraj M, A D Karelis, Messier L et al. (2007) Relationship between the hyperinsulinemic-euglycaemic clamp and a new simple index assessing insulin sensitivity in overweight and obese postmenopausal women. , Diabetes Metab 33(4), 261-8.
- 6.Bedogni G, Bellentani S, Miglioli L, Masutti F, Passalacqua M et al. (2006) The Fatty Liver Index: a simple and accurate predictor of hepatic steatosis in the general population.doi: 10.1186/1471-230X-6-33.BMC. , Gastroenterol 6, 33.
- 7.Borai A, Livingstone C, Farzal A, Kholeif M, Wang T et al. (2010) Reproducibility of HOMA and QUICKI among individuals with variable glucose tolerance. , Diabetes Metab 36(3), 247-9.
- 8.Brochu M, M F, Messier V, Doucet E, Strychar I et al. (2009) Resistance training does not contribute to improving the metabolic profile after a 6-month weight loss program in overweight and obese postmenopausal women. , J. Clin. Endocrinol. Metab 94(9), 3226-33.
- 9.Brochu M, Mathieu M-E, A D Karelis, Doucet E, Lavoie M-E et al. (2008) Contribution of the lean body mass to insulin resistance in postmenopausal women with visceral obesity: a Monet study. Obesity (Silver Spring). 16(5), 1085-93.
- 10.Calori G, Lattuada G, Piemonti L, M P Garancini, Ragogna F et al. (2011) Prevalence, metabolic features, and prognosis of metabolically healthy obese Italian individuals: the Cremona Study. , Diabetes Care 34(1), 210-5.
- 11.R A DeFronzo, J D Tobin, Andres R. (1979) Glucose clamp technique: a method for quantifying insulin secretion and resistance. Am.J.Physiol.Available from http://www.ncbi.nlm.nih.gov/pubmed/382871 [accessed on24January2013] 237(3), 214-23.
- 12.Fabbrini E, Magkos F, B S Mohammed, Pietka T, N A Abumrad et al. (2009) Intrahepatic fat, not visceral fat, is linked with metabolic complications of obesity. , Proc. Natl. Acad. Sci. U. S. A 106(36), 15430-5.
- 13.Ferrannini E, Natali A, Bell P, Cavallo-Perin P, Lalic N et al. (1997) Insulin resistance and hypersecretion in obesity. , European Group for the Study of Insulin Resistance (EGIR). J. Clin. Invest 100(5), 1166-73.
- 15.J A Hanley, B J McNeil. (1983) A method of comparing the areas under receiver operating characteristic curves derived from the same cases. Radiology. Available from http://www.ncbi.nlm.nih.gov/pubmed/6878708 [accessed on28January2013] 148(3), 839-43.
- 16.Kahn B B, Flier J S. (2000) Obesity and insulin resistance. , J. Clin. Invest. American Society for Clinical Investigation 106(4), 473-81.
- 17.H S Kahn. (2006) The lipid accumulation product is better than BMI for identifying diabetes: a population-based comparison. Diabetes Care. Available from http://www.ncbi.nlm.nih.gov/pubmed/16373916 [accessed on31March2014] 29(1):. 151-3.
- 18.H S Kahn, Valdez R. (2003) Metabolic risks identified by the combination of enlarged waist and elevated triacylglycerol concentration. Am.J.Clin.Nutr. Available from,http://www.ncbi.nlm.nih.gov/pubmed/14594778 [accessed on31March2014] 78(5), 928-34.
- 19.A D Karelis, Faraj M, Bastard J-P, D H St-Pierre, Brochu M et al. (2005) The metabolically healthy but obese individual presents a favorable inflammation profile. , J. Clin. Endocrinol. Metab 90(7), 4145-50.
- 20.A D Karelis, Fontaine J, Messier V, Messier L, Blanchard C et al. (2008) Psychosocial correlates of cardiorespiratory fitness and muscle strength in overweight and obese post-menopausal women: a MONET study. , J. Sports Sci 26(9), 935-40.
- 21.Katz A, Nambi S S, Mather K, Baron A D, Follmann D A et al. (2000) Quantitative insulin sensitivity check index: a simple, accurate method for assessing insulin sensitivity in humans. J.Clin.Endocrinol.Metab. Available from http://www.ncbi.nlm.nih.gov/pubmed/10902785 [accessed on26January2013] 85(7): 2402-10.
- 22.LJ Kelley DE and Mandarino. (2000) Fuel selection in human skeletal muscle in insulin resistance: a reexamination. , Diabetes 49(5), 677-683.
- 23.Klöting N, Fasshauer M, Dietrich A, Kovacs P, M R Schön et al. (2010) Insulin-sensitive obesity. , Am. J. Physiol. Endocrinol. Metab 299(3), 506-15.
- 24.J L Kuk, C I Ardern. (2009) Are metabolically normal but obese individuals at lower risk for all-cause mortality?. , Diabetes Care 32(12), 2297-9.
- 25.Lavoie M-E, Faraj M, Strychar I, Doucet E, Brochu M et al. (2012) Synergistic associations of physical activity and diet quality on cardiometabolic risk factors in overweight and obese postmenopausal women.doi: 10.1017/S0007114512001699.Br. , J. Nutr.: 1-10.
- 26.Lavoie M-E, Rabasa-Lhoret R, Doucet E, Mignault D, Messier L et al. (2010) Association between physical activity energy expenditure and inflammatory markers in sedentary overweight and obese women. , Int. J. Obes. (Lond). Macmillan Publishers Limited 34(9), 1387-95.
- 27.Lebovitz H E. (2001) Insulin resistance: definition and consequences. , Exp. Clin. Endocrinol. Diabetes,109Suppl: 135-48.
- 28.L A, D H Fitchett, R E Gilbert, Gupta M, Mancini G B J et al.Identification and management of cardiometabolic risk in Canada: a position paper by the cardiometabolic risk working group (executive summary). , Can. J. Cardiol 27(2), 124-31.
- 29.Matsuda M, R A DeFronzo. (1999) Insulin sensitivity indices obtained from oral glucose tolerance testing: comparison with the euglycemic insulin clamp. Available from http://www.ncbi.nlm.nih.gov/pubmed/10480510 [accessed26January2013] , Diabetes Care 22(9), 1462-70.
- 30.D R Matthews, J P Hosker, A S Rudenski, B A Naylor, D F Treacher et al. (1985) Homeostasis model assessment: insulin resistance and beta-cell function from fasting plasma glucose and insulin concentrations in man. Available fromhttp://www.ncbi.nlm.nih.gov/pubmed/3899825[accessed on26January2013] , Diabetologia 28(7), 412-9.
- 31.Messier V, F M Malita, Rabasa-Lhoret R, Brochu M, A D Karelis. (2008) Association of cardiorespiratory fitness with insulin sensitivity in overweight and obese postmenopausal women: a Montreal Ottawa New Emerging Team study. , Metabolism 57(9), 1293-8.
- 32.R S Patarrão, Lautt Wayne, W, Macedo Paula, M. (2014) Assessment of methods and indexes of insulin sensitivity. , Rev. Port. Endocrinol. Diabetes e Metab 9(1), 65-73.
- 33.Pisprasert V, K H Ingram, M F Lopez-Davila, A J Munoz, W T Garvey. (2012) Limitations in the Use of Indices Using Glucose and Insulin Levels to Predict Insulin Sensitivity: Impact of Race and Gender and Superiority of the Indices Derived From Oral Glucose Tolerance Test in African Americans. Diabetes Care. 10-2337.
- 34.D B Sacks, Arnold M, G L Bakris, D E Bruns, A R Horvath et al. (2011) Guidelines and recommendations for laboratory analysis in the diagnosis and management of diabetes mellitus. , Diabetes Care 34(6), 61-99.
- 35.Stefan N, Kantartzis K, Machann J, Schick F, Thamer C et al. (2008) Identification and characterization of metabolically benign obesity in humans. , Arch. Intern. Med 168(15), 1609-16.
- 36.Strychar I, Lavoie M-E, Messier L, A D Karelis, Doucet E et al. (2009) Anthropometric, metabolic, psychosocial, and dietary characteristics of overweight/obese postmenopausal women with a history of weight cycling: a MONET (Montreal Ottawa New Emerging Team) study. , J. Am. Diet. Assoc 109(4), 718-24.
- 37.Tousignant B, Faraj M, Conus F, Garrel D, Brochu M et al. (2008) Body fat distribution modulates insulin sensitivity in post-menopausal overweight and obese women: a MONET study. , Int. J. Obes. (Lond). Macmillan Publishers Limited 32(11), 1626-32.
- 38.Vangipurapu J, Stančáková A, Kuulasmaa T, Paananen J, Kuusisto J et al. (2011) A novel surrogate index for hepatic insulin resistance. , Diabetologia 54(3), 540-3.
- 39.Vatier C, Fellahi S, A D Karelis, Brochu M, Doucet E et al. (2017) Comparison of simple indices for measuring insulin resistance that integrates adipokines in non-diabetic obese postmenopausal women before and after weight loss:A MONET study. Diabetes andMetabolism(InPress).