
Abstract
The effects of global warming have been causing irreversible damage to the Earth over the past decades. One way we can reduce our individual impact on the environment is to focus on the production and consumption of Eco‐friendly sources of electricity such as solar, wind, or bio-electric energy. Based on the current available and suitable energy options, we have proposed to modify a chosen house from Northern Wisconsin by using a hybrid system including solar energy and wind turbine energy to replace the traditional power grid. Considering sunlight‐time, wind speed in Northern Wisconsin, we have predicted the immediate and long‐term fiscal and environmental impacts. From this cost‐benefit analysis, we project that the best hybrid option is a combination of 95% solar power and 5% wind energy, which would save about $41,000 over the next 30 years.
Author Contributions
Academic Editor: Loai Aljerf, Department of Basic Sciences, Faculty of Dental Medicine, Damascus University, Damascus, Syria.
Checked for plagiarism: Yes
Review by: Single-blind
Copyright © 2019 Hannah LeMoine, et al.
 This is an open-access article distributed under the terms of the Creative Commons Attribution License, which permits unrestricted use, distribution, and reproduction in any medium, provided the original author and source are credited.
Competing interests
The authors have declared that no competing interests exist.
Citation:
Introduction
Within the past century, the global temperature has increased by 1.33o Fahrenheit (0.74o Celsius) 8. The effects of global warming have been devastating, causing irreversible damage to the Earth and all organisms that inhabit it. Human beings are the main producers of carbon emissions that cause climate change; we are also the main victims of it. Climate change causes extreme weather such as wildfires, floods, droughts, and hurricanes. Natural disasters such as these not only result in deaths, they also cause property damage, leaving many people homeless. Dramatic changes to the climate of an area can lead to an increase of pathogens that can be detrimental to people, leading to a spread of diseases and also the genesis of new viruses. By continuing to produce an unchecked amount of carbon emissions, we are directly responsible for the suffering of other people.
It is imperative that we try to minimize the damage of climate change. Reading a list of effects of carbon emissions is enough to make anyone despair. At this point, it is already impossible to stop climate change. We can’t bring back glaciers or decrease sea levels or make vital fresh water sources produce water again. The best we can do is to adapt to the world we already live in to attempt to minimize the damage we have done. One way we can reduce our individual impact on the environment is to focus on the production and consumption of eco-friendly sources of electricity such as solar, wind, or bioelectric energy 6. Currently, the electricity in Wisconsin is mainly produced with coal, with 34.6% of electricity coming from coal. Nuclear power accounts for 27.0% of electricity and 14.8% from natural gas. That means that 23.6% of energy for Wisconsin comes from renewable resources. Out of that, the majority of renewable energy derives from wind power, 13.7% 10
Many sources of renewable energy cannot be used for the residence we have selected. The first sustainable source we can nix is geothermal power. The most efficient source of geothermal energy would be an open loop; a system that uses surface water or groundwater as the heat transfer fluid 11. The water would then be pumped back into a body of water or onto the ground surface. Since our selected location is on a lake, this seems to be an extremely efficient choice. Unfortunately, the lake is covered in ice from December to April in general. This could cause the pipes to freeze or limit disposal options. It would also make the water source unusable for part of the year. The other geothermal option is a closed loop system. This system uses a pipe loop in either the ground or a water body. Since a fluid with a low freezing temperature is pumped through the loops, you avoid the problem of it freezing. There are three types of closed systems: pond loop, horizontal loop, and vertical loop 11. A pond loop would be better able to suit our needs. For a pond loop, the loops of pipe are simply submerged in the lake and would transfer heat to and from the water of the lake. The lake is very deep and simply putting the loops in the lake would be dangerous, as boats and other watercraft could catch on the pipes and damage them. If the pipes broke or were damaged badly enough to leak fluid, it could cause damage to the fragile ecosystem of the lake that the city tries to avoid. The other two options, horizontal and vertical loops, are also unattainable. These options require drilling or digging into the ground and installing pipes to carry fluid. Both are unable to be used simply because of the amount of area they require. In the city where the residence is located, there are particular zoning laws which prioritize the health and safety of the lake and forbids any construction within 75 feet of the ordinary high water mark to prevent pollution of the lake. Zoning laws also dictate that nothing can be built or installed within 10 feet of the side property line 14. The residence is about 2500 square feet, so we can assume that it requires approximately 1200 to 1800 feet of pipe. The amount of land required to contain the length of the pipes is far too much for the amount of ground available.
The second renewable option, hydropower, is also unusable. Since our chosen residence receives the standard energy mix from their energy provider, Excel, they already derive about 4% of their energy from hydroelectricity. Hydropower produces electricity from the kinetic energy of moving water. Since hydropower comes from the flow of water, the bountiful number of lakes in northern Wisconsin are unable to really contribute anything. The lake the residence is on is clear and stagnant, so it is completely useless for hydropower, meaning that any local hydropower is impossible. The closest hydroelectric plant to the residence is Cornell Hydro Generating Station on the Chippewa River 13. Many rivers in Wisconsin don’t run fast or fierce enough to produce enough energy to be effective. Even if we could dam more rivers in the state, the environmental impact would be disastrous. Dams used to produce hydropower can damage the environment of the river by blocking the migration of fish 5. It is also unknown how hydropower dams affect the freshwater mussel population, as many freshwater mussel species are either threatened or endangered in Wisconsin 12. Dams can also have negative effects on the area surrounding it. To produce hydropower there must be reservoirs. This requires the flooding of land where people either live or grow crops which could cause the displacement of many people. Hydropower is simply not very effective for Wisconsin due to the fact that the environmental effects outweigh the possible power produced.
Another option, biogas, is also impractical. Wisconsin is well known for its dairy industry and creates a surplus of dairy. A biogas plant creates energy from organic materials that are digested by microorganisms known as archaea. This produces methane through the process of anaerobic digestion. This means that the fermentation process does not use any oxygen, as the microorganisms function in an oxygen-starved environment 15. The large number of farms in Wisconsin have the potential to provide a tremendous amount of energy. Only thirty-four farms in Wisconsin make use of biogas digesters. It is possible to produce biogas from landfills through the same process as for farms. Landfill gases also make use of the chemical reactions between different waste components. Forty-two landfill gas systems exist in Wisconsin 17. Biogas is not used often because of the environmental impact. Despite the fact that biogas is often considered to be ‘clean energy’, it actually produces several greenhouse gases. The air pollution produced from biogas is comparable to the amount produced by natural gases. The methane produced can be dangerous because methane is a dangerous greenhouse gas and potential leaks could be detrimental to the environment. Biogas production can be perilous to the people who work and maintain the facility. Because of the flammable gases produced, biogas facilities are at risk of gas leaks, fires, and explosions. Serious damages could greatly contribute to greenhouse gas emissions, as well as putting the workers of the facility at risk 3. Our chosen location is not near any farms that could be used to produce biogas, and using only the biogas produced the the residence is impossible. Any private waste disposal must me more than 75 feet behind the high water level to avoid pollution, and the amount of room necessary is not available.
Since the previous options are inefficacious, the only renewable energy sources left are wind and solar power. Solar power is generated by converting light into energy. This is done by the photovoltaic effect, where photovoltaic cells convert light to direct-current energy. The direct-current electricity must then be converted into alternating-current energy by an inverter. Solar panels usually last 25 to 30 years and inverters last 10 to 15 years 16. Solar panels would be extremely effective in Wisconsin in the summer, as the day length in the summer lasts for over 14 hours a day, peaking on the summer solstice in June before receding until the winter 1. Using solar energy during the summer months would be extremely effective, but the tilt of the Earth is a double edged sword. In the wintertime, it is common to get less than 9 hours of sunlight a day 18. So while solar panels are advantageous during the summer months, they are impractical during the winter. Solar panels do not have many negative impacts; the most serious danger from solar panels is during production, which requires some dangerous chemicals that could harm workers 19. Solar panels could be easily installed at our chosen residence with no negative impacts. The panels could be installed on the roof, therefore, there is plenty of room to use for solar panels without causing damage to the lake or violating any zoning laws 7.
Wind energy, on the other hand, is already the most used renewable resource in the state, with 13.7% of all energy coming from wind. Wind turbines turn kinetic energy from the wind into mechanical power, which can then be converted by a generator into electricity 20. Since our chosen residence is near a lake, there are no trees or buildings hindering access to wind. This could cause wind energy to become an extremely potent resource. The wind speed during the winter is slightly higher than the speed during the summer. The most major downside of installing a wind turbine could be dangerous to the birds of the area, as they could collide with the turbine 4. During the bird migration in spring and fall, any wind turbine in the area would have to be stopped or slowed. Despite the danger to birds, there are no local laws forbidding the installation and use of small wind turbines.
By analyzing all energy resource options, we have concluded that the most effective and clean way to produce the energy required to power our chosen residence is a combination of both solar and wind power. Solar power is incredibly effective during the summer months and wind power can produce most of the energy during the winter.
30-year Electric Bill Estimation
The average rate of electricity in 2019 is $ 0.1325 per kilowatt hour 21. Before we propose our cost-benefits analysis model, we have made two reasonable assumptions. First, since electricity is a necessary part of our lives, and it is considered to be an inelastic good, the quantity demanded by the specified household varies little in our model. Second, there are many factors that go into determining the price of the electricity, for example, inflation rate, cost of fuels, power plant costs, transmission and distribution system costs, weather, regulations, seasons etc. It would be hard to project the electricity price if we take all of these factors into considerations. Therefore, we have only used the inflation rate to project the electricity price in this paper. The USDA predicts that average annual inflation will remain stable at 2.3% for the next 30 years 21. Based on the above assumptions and inflation rate, we have mathematically predicted the electricity price ($/kwh) over the next 30 years as,
y = 0.1325 × (1 + 2.3%)n−2019…...(1)
Where n is the year after 2019. Using this equation, we have graphed the electricity rates over the next 30 years in Figure 1.
Figure 1.Predicted electricity rates for the next 30 years (unit: $/kWh). Where ri is the electricity rate in the ith year and ui the annual electrical usage.
First, we graph the monthly electricity bill of our chosen household in Figure 2. The annual electric usage is 11,148 kilowatt-hours.
Figure 2.Monthly electric usage (unit: kWh).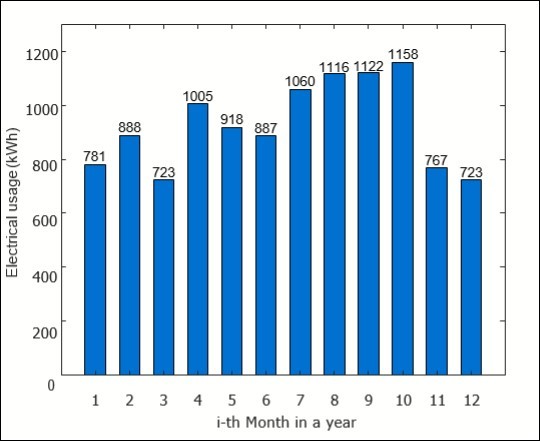
Assume the annual growth rate of electricity bills remains the same, we use the sum of a geometric sequence to approach the total electricity rate. Thus, the total electric bills for the next 30 years is,
Total Electrical Bill =
…… (2)
Where ri is the electricity rate in the ith year and ui the annual electrical usage.
Solar Energy System
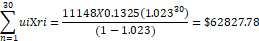
The amount of electricity generated by the solar system is determined by the power and peak sun-hour. A peak sun-hour is an hour when the intensity of sunlight is 1,000 watts per square meter. In Figure 3, We have graphed the monthly peak sun-hours based on the monthly average sunlight time in Wisconsin 22.
Figure 3.Monthly peak sun-hour (unit: hours).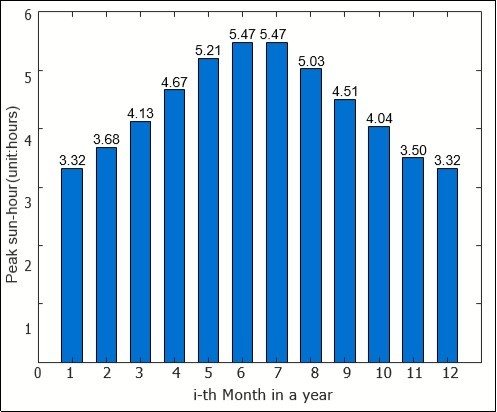
Then, we have calculated the whole annual peak sun hours by multiplying the monthly average peak sun-hours and the number of days in each month.
T = ti × ni = 1596.29 hours…….(3)
Where T is whole peak sun hours, ti is the average peak sun-hour in the ith month and ni is the number of days in each month. The power of the solar energy system is defined as
P = W/T …..(4)
Where W is the amount of the energy generated and T is the time of peak sun-hours.
In order to ensure the unification of data, we have all adopted solar and wind power generation systems from “wholesale solar” for cost analysis. In general, the life of solar panels is 25-30 years, and the life of inverts is 10-15 years.
Wind Energy System
The amount of electricity generated by the wind energy system is determined by the power and the wind speed. To solve and analyze the cost benefits of the wind energy, we found the average monthly wind speed of Northern Wisconsin 24. In order to optimize the alternative power system, in Figure 4, we have graphed that the power of solar energy in percentage of the total consumption energy. Most wind turbines on the market today are less than 1kW. At the same time, because the service life of the wind turbine is long, the replacement of parts is not considered in our paper. Next, we calculate how much electric energy a single wind turbine system generates in Wisconsin. In Figure 5, we graph the avarage monthly wind speed in northern Wisconsin. We can see that the wind speed is faster in the winter than speed in summer time. We assume there is a linear relationship between the wind speed and the time (The wind speed reached average speed at noon and reached its maximum speed at midnight). According to the average wind speed and average maximum wind speed, we have the relation between wind speed and time is,
Figure 4.Power of solar energy in percentage of total consumption of energy.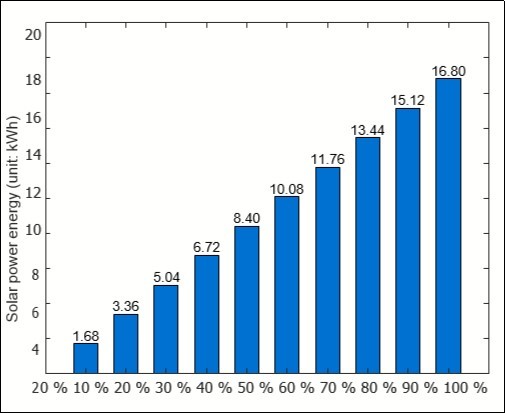
Figure 5.Average monthly wind speed.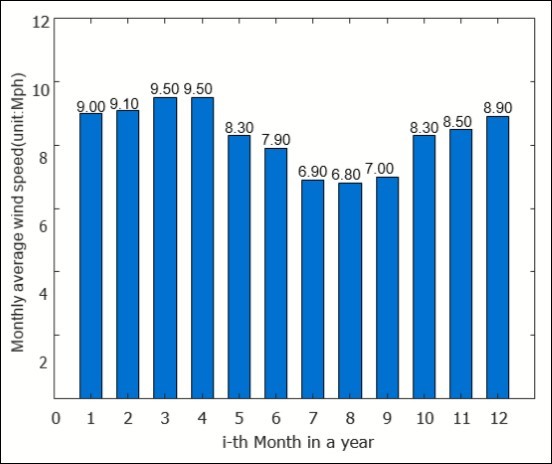
V = 0.2359375t + 0.88291…….(5)
The wind turbine is characterized by non-dimensional performance as a function of tip speed ratio. The output of mechanical power captured from wind by a wind turbine 2 can be formulated as

…….(6)
The torque developed by a wind turbine can be expressed as
Tt = Pt/ωm …….(7)
Where Pt is the output power, Tt is the torque developed by wind turbine, Cρ is the power coefficient, λ is the tip speed ratio, and ρ is the air density in kg/m3. A is the frontal area of wind turbine and V is the wind speed. For the same wind turbine in the same place, the Cρ and Tt values would be the same, and wind speed is the only variable element for the power of wind energy system. Then, we can simplify the equation as
P = αV3…….(8)
According to the instructions of the wind turbine, we have that the standard power of each wind turbine is 0.4KW when the wind speed is 12.5m/s. Then, we can get that α is 0.0002048. Thus, the relationship between power and time is,
P (t) = 0.0002048 × (0.2359375t + 0.88291)3 …..(9)
So, the amount of electricity generated per day can be obtained from the following definite integral
 …….(10)
From the above result, we have the amount of electricity generated in the whole year is
E=0.39818kWh/day×365days/year=145.34kWh ….(11)
Because of the power of the wind energy system limitation, it can be only used to provide small portion energy for our chosen household.
To optimize the solar power system and wind system usage, we have calculated the cost of the combination system. In Figure 6, we can see that there is a huge cost increase when the energy from solar power increase from 90% to 100% due to the cost of large solar pannel system increased dramatically. We can see that if all the household energy are from solar power, the solar power system would cost almost $30,000. If 90% of the energy are from the solar power, then the solar power system would only cost about $19,000. In order to find out the best combination, in Figure 7, we have graphed the different percentage of the solar power and wind power system.
Figure 6.Separate costs of solar panels and inverters.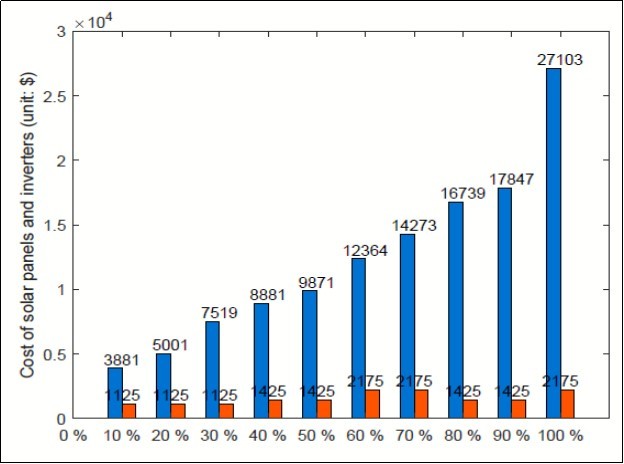
Figure 7.Costs of solar panels and inverters
There is a policy that when you install a solar system, 30% of your total project costs (including equipment, permitting and installation) can be claimed as a credit on your federal tax return 23. So, when we perform the cost analysis, we will only account 70% of the price of a complete solar system and the price of an additional 1.5 inverters.The Figure 8 shows the cost of solar power system and the cost of inverters at different percentage of usage with the tax incentives.
Figure 8.Total cost of solar panels and inverters at percentages of total energy.
Therefore, we are thinking of using the wind power system to generate the rest 10% energy for the chosen household. Taking the amount of energy that the wind energy system needs to generate, divide it by the amount of energy that a single wind turbine can generate, we get the number of wind turbines for our hybrid energy system. We have also calculated the total cost of the wind energy system.
Finally, we add the cost of the wind energy system and the cost of the solar energy system. Figure 9 shows the cost of the solar power and the wind system at different percentage of usage of solar power system and wind power system. From the Figure 10, we can see that the lowest cost occurs when 95% of the energy is from solar power and 5% coming from wind power. Therefore, we recommend using 15.97kWsolar energy system and four 0.4KW wind turbine systems. In this way, we find that installing hybrid power system such as Figure 11 can save the household $43757.
Figure 9.Cost of the solar power and wind power system, (unit: $)
Figure 10.Total cost of hybrid power system for different percentage of electricity provided by solar power, (unit: $)
Figure 11.Hybrid Power Systems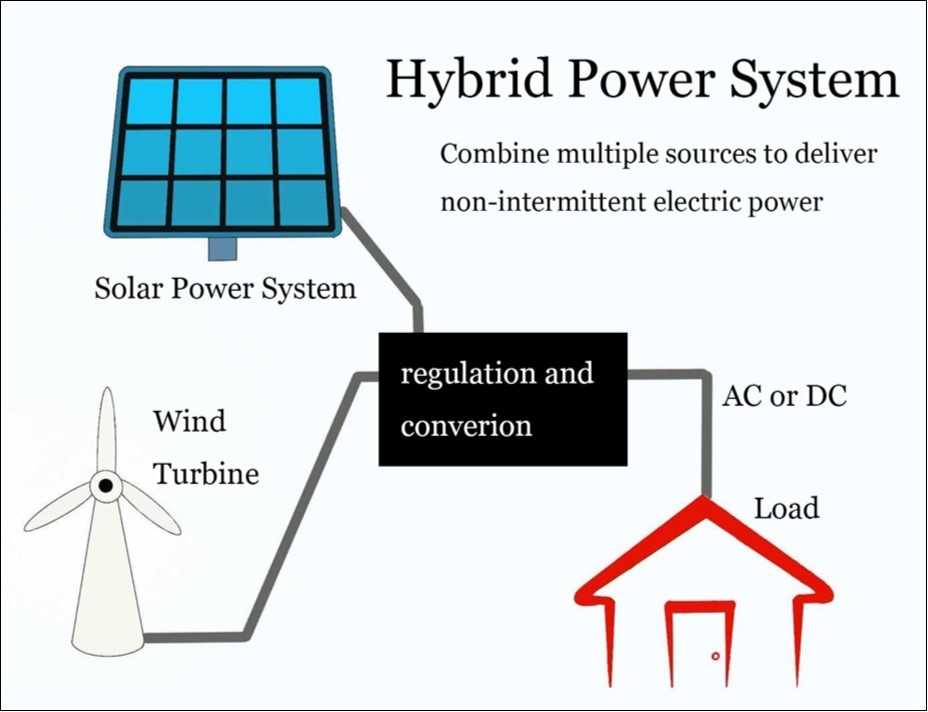
Environmental Impact
When comparing this system to the environmental impact of the current energy system, the benefits become very obvious. Solar and wind energy produces a negligible amount of greenhouse gases compared to coal and other energy sources currently being used at this residence. Wisconsin gets 49.4% of its electricity from fossil fuels, which produce harmful gases like carbon dioxide and sulfur dioxide 25.
If the household power are from the traditional grid system, the power generated by coal will produce 25,640 pounds of carbon dioxide pollution annually. It is also responsible for about 100 pounds of sulfur dioxide, 37 pounds of nitrogen oxides. Over the 30 years, it would produce 769,200 pounds of carbon dioxide pollution, 3,000 pounds of sulfur dioxide and 1,110 pounds of nitrogen oxides. Compared to this, solar and wind energy do not produce greenhouse gases such as carbon dioxide at all. Therefore, solar energy and Wind power systems do not produce air pollution, water pollution, or greenhouse gases. Using solar energy can have a positive, indirect effect on the environment when solar energy replaces or reduces the use of other energy sources that have larger effects on the environment. (Table 1).
Table 1. Summary of average emissions rate (lb/MWh) in Wisconsin tracked by eGRID 2007.| Source | CO2 | SO2 | NOx | CH4 | N2O | Hg |
| Hydro, Wind, Nuclear | 0.00 E+00 | 0.00 E+00 | 0.00 E+00 | 0.00 E+00 | 0.00 E+00 | 0.00E+00 |
| Coal | 2.30E+03 | 8.75E+00 | 3.30E+00 | 3.00E-02 | 3.95 E-02 | 5.25E-05 |
| Oil | 2.21E00 | 2.34E-03 | 2.48E-02 | 9.19E-05 | 1.81E-05 | 0.00E+00 |
| Biomass | 3.08E+02 | 2.24E+00 | 2.67E+00 | 1.61E-01 | 3.22E-02 | 2.66E-05 |
| NatureGas | 1.14E+03 | 1.38E-01 | 6.03E-01 | 2.29E-02 | 2.56E-03 | 0.00E+00 |
Conclusion
Based on the research we have done, we concluded that the most effective way of producing energy for our chosen residence is a combination of solar and wind energy. Compared to the current way of obtaining electricity, wind and solar energy’s environmental impact is completely negligible. Solar and wind energy are also more environmentally friendly than other renewable options. By using data collected in our area, we have learned that the best way of producing energy for our chosen residence is to implement a system where 95% of the energy is from solar power and 5% coming from wind power. To achieve this, we would require four 400-watt wind turbines and 15.97 kilowatts from solar panels.
Based on both the price and the environmental impact, it is much more effective to install a combination of solar and wind power instead of staying with our current system. This may not be the most effective system for every house, but it does work for this specific residence. By reducing our individual environmental impact, we can at least lessen the amount of carbon emissions and contribute less to the disastrous impacts on the Earth and the beings that inhabit it. If it were possible for every residence in the country to implement some type of clean energy system, the amount of carbon emissions coming from the United States could be greatly reduced, which would improve the quality of life of humans everywhere 9.
We can always do better. If more resources were used to improve the effectiveness of different forms of clean energy, the amount of carbon emissions would be greatly reduced. We know that over 30 years- the lifespan of solar panels- we can save over $40,000. If more resources were used to improve the effectiveness of solar power, the amount saved and the lifespan of the panels could be increased. The same holds for wind power. Wind turbines last for a long time, but can injure or kill birds, as well as the fact that wind turbines, especially large ones, make an annoying noise. Wind energy is effective, but it can always be improved. We concluded that wind and solar energy are the most effective way of generating power right now. As more research goes into alternate energy sources, this may or may not remain constant. If more clean energy sources are explored, we may discover that another way of generating power is better- either geothermal, hydropower, or biogas. As we learn more, we will be able to do better. With the resources available now, solar and wind is most effective, but we believe the future will surpass our current knowledge.
References
- 1. (1999) Hybrid solar–wind domestic power generating system-a case study. , Renewable En - 17(3), 355-358.
- 2.Nema P, Nema R, Rangnekar S. (2009) A current and future state of art development of hybrid energy system using wind and PV-solar: A review. Renewable and Sustainable Energy Reviews. 13(8), 2096-2103.
- 3.Paolini V, Petracchini F, Segreto M, Tomassetti L, Naja N et al. (2018) Envi- ronmental impact of biogas: A short review of current knowledge. , Journal of Environ- mental Science and Health Part A 53(10), 899-906.
- 4.D Y Leung, Yang Y.Wind energy development and its environmental impact. , Renewable and Sustainable Energy Reviews 16, 1031-1039.
- 7.Saver Energy. (2015) Hybrid Wind and Solar Electric Systems. https://www.energy.gov/energysaver/buying-and-making-electricity/hybrid-wind-and- solar-electric-systems.
- 9.Saver Energy. (2019) How to choose the best battery for a solar energy system. https://www.energysage.com/solar/solar-energy-storage/what-are-the-best-batteries- for-solar-panels/.
- 10.Energy Xcel. (2016) Renewable Energy Options Residential. https://www.xcelenergy.com/programs andrebates / residential programs and re-bates / renewable energy options residential.
- 11.DNR Wisconsin. (2012) Geothermal Briefing, DNR.Wisconsin Geothermal Association. Our Mission. https://wisgeo.org/.
- 12.U S Fish, Service Wildlife. (2017) Hydropower Planning. https://www.fws.gov/midwest/greenbay/hydropower/index.html
- 13.Energy Xcel. (2015) Power Plants. , https://www.xcelenergy.com/energy-portfolio/electricity/power-plants
- 14.County Washburn. (2018) Zoning Department. Zoning Regulations[Pamphlet]. Shell Lake, Wis- consin: Washburn County.
- 15.S U. (2018) Environmental Protection Agency. https://www.epa.gov/anaerobic-digestion/basic-information-about-anaerobic- digestion-ad
- 16. (2018) The Climate Reality Project. How Does Solar Power Work, Anyway? https://www.climaterealityproject.org/blog/how-does-solar-power-work-anyway.
- 18.Claire Eau. (2019) . , Wisconsin, USA - Sunrise, Sunset, and Daylength. https://www.timeanddate.com/sun/usa/eau-claire
- 19. (2005) Environmental impacts from the solar energy technologies, Theocharis Tsoutsos, Niki Frantzeskaki and Vassilis Gekas. , Energy Policy 33(3), 289-296.
- 20.Exchange WIND. (2017) SmallWindGuide book. Retrievedfrom https://windexchange.energy.gov/small-wind-guidebook.
- 21.S U. (2018) . Department of Agriculture Economic Research Service. International Macroeco- nomic Data Set. https://www.ers.usda.gov/data-products/international-macroeconomic-data- set.aspx#.UyrmcvmSwr4 .
- 22.Wisconsin Sunlight (2019) Hours & Renewable Energy Information. , https://www.turbinegenerator.org/solar/wisconsin/