Abstract
The management of the inoculation of a plant’s roots, by means of biofertilizers (BF) containing arbuscular mycorrhizal (AM) fungi, is aimed at inducing modifications of the quality of the seeds. It is here shown that a seed-soil treatment can be elicited in the fingerprints of a symbiotic treatment using Near Infra Red (NIR)-SCiO NIR-SCiO spectra collections of single kernels: overall, a sensitivity of 73% and a specificity of 73% have been achieved, thus suggesting that it may be possible to assign the symbiotic origin of corn from just twenty kernels, provided that the dataset is adequately representative of the cultivar and AM. A global correlation study has shown a positive general trend (R2 0.45) of quality vs. quantity, in the sense that an increase in yield corresponded to an increase in the spectral differences between the symbiotic spectra and the control ones, but the inverse was also true, as a result of the parasitic behaviour of the BF treatments. The efficacy of the symbiosis can be back predicted from the NIR spectra; in fact, around 90% of the positive yield outcome results were discriminated from the negative ones. A reduction in the foliar pH (R2 0.37) and an increase in the foliar protein (R2 0.43) were observed as immediate phenotypic signs of a productive symbiosis. The commercial raw composition of the kernels appeared to only be affected slightly by the BF treatments; thus, till now uncharted secondary compounds of the maize kernels are involved, as supported by animal performances.
Author Contributions
Academic Editor: Abubaker Haroun Mohamed Adam, Department of Crop Science (Agronomy), College of Agriculture, Bahri University- Alkadaru- Khartoum -Sudan.
Checked for plagiarism: Yes
Review by: Single-blind
Copyright © 2020 Giorgio Masoero, et al.
 This is an open-access article distributed under the terms of the Creative Commons Attribution License, which permits unrestricted use, distribution, and reproduction in any medium, provided the original author and source are credited.
Competing interests
The authors have declared that no competing interests exist.
Citation:
Introduction
Symbiotic Agriculture (SA) is a cultivation method that systematically integrates the use of biofertilizers in the management of all rotating crops. Biofertilizers with Arbuscolar Mycorrhizal fungi (AM) have important biological effects on colonized plants, as they improve the nutrient absorption, particularly as regard the phosphorus bound in agrarian soils1, with a consequent stimulating effect on plant growth, and an enhancement of their resistance (a)biotic stresses2. The resilience capacity of crops are improved under slightly unfavorable conditions, where the saprotrophyc or parasitic tendencies of the AM can be mitigated. Klironomos3 compared local and exotic species with both local and exotic mycorrhizal fungi and noted how plant growth responses to inoculation can range from highly mutualistic to parasitic: no single species of plants did better with all the tested AM fungi.
Thanks to a favorable alignment of agronomical inputs, SA can enhance productions, up to luxuriance. In the first part of this maize study4, we examined some critical points necessary to achieve successful yields using complex biofertilizers. Further knowledge was obtained concerning potato5. In short, it is necessary that soil has a hospitable attitude toward new microbial agents: if the organic substance is deficient, or the microflora is too aggressive, it becomes difficult for the minimal doses of bio-fertilizer, which are precisely inoculated near the roots, to be hosted, multiplied and spread. A mycelial network may arise and expand, thereby connecting a high density corn plantation -up to 6 m-2- whose roots prevent any mutual contact rsulting from allelopathy.
Previous biofertilizer studies have shown that any qualitative modifications of seeds will have a effect on the primary6,7 and secondary compounds, that is, there will be a rise in antioxidants8,9,10 with beneficial consequences on animal feeding 11,12.
The aims of the present study have been to increase knowledge on symbiotic corn production, with emphasis on the quality results, from tests in real fields using rapid analysis methods.
Experimental Procedure
Three recently published rapid methods, namely the NIRS-litter-bag technique13, the raw foliar pH14,15,16 and foliar NIR-Tomoscopy17, have been used together, in a holistic model, for a symbiotic corn yield production4. The aim of this study has been to investigate the quality of symbiotic corn. First, the spectral NIR signature of the single kernels was obtained and elaborated in order to assess whether this method could fingerprint the source of the corn (Control vs. Symbiotic), as induced by a biofertilizer in different corn cultivars. Moreover, some commercial qualities of the integer grain were determined, by means of a bench NIRS instrument, and elaborated as univariate. Finally, by chaining the results of this second part to the previous results, a correlation has emerged which has highlighted the relationships among the phenotype variables that affect the quantity of the corn as well as their consequences on the variation in the quality traits.
Materials and Methods
Experiment Set-up
Twenty-six pairwise comparisons, namely Symbiotic inoculated (S) vs. Control non-inoculated (C) were obtained from a total of 44 plots in 4 centers, with four cultivars and six AM types, over a period of 2 years.
In 2018, three centers collaborated in the set up and the realization of the calibration experiments (Table 1). The inoculation was performed using a Micosat F ® bio-fertilizer, as coating (1 kg ha-1) or granulate (10 kg-1). In 2019 validation experiments were performed using a Micosat F ® bio-fertilizer and four other AFM types as coatings (1 kg ha-1) at a University Center in soil where cation exchange capacity appears to be average, while the phosphorus supply assimilable is low, as is that of exchangeable potassium (Table 2).
Table 1. Plan of the experiments, 2018 calibration and 2019 validation.| Experiments | Pairwise comparison | Cultivars | Yield | Bio-fertilizer | Type /dose |
| 2018 calibration, N. 52 plots | |||||
| 2018-1CREA-IC (BG, Italy) | 1 | Pioneer P1547. | Corn 14.5% DM | Micosat FMF1 | Granular10kg/ha |
| 2 | Corn 14.5% DM | ||||
| 3 | Corn 14.5% DM | ||||
| 4 | Corn 14.5% DM | ||||
| 5 | Corn 14.5% DM | ||||
| 6 | Corn 14.5% DM | ||||
| 7 | Corn 14.5% DM | ||||
| 8 | Corn 14.5% DM | ||||
| 2018-2DISAFA-1(TO, Italy) | 9 | DM waxy spikes | Tan1kg/ha | ||
| 10 | DM waxy spikes | ||||
| 11 | Corn 14.5% DM | Granular10kg/ha | |||
| 12 | Corn 14.5% DM | ||||
| 2018-3 Maïsadour | 13 | MAS 68K | Corn 14.5% DM | ||
| 2019 validation, N. 50 Plots | |||||
| 2019-1 | 14 | DK4316 | Corn 14.5% DM | MF1 | Tan1kg/ha |
| 2019-2DISAFA-2(TO, Italy) | 15-18 | MASDM6318 | Corn 14.5% DM | AM_092 | |
| 19-22 | Corn 14.5% DM | AM_ 073 | |||
| 23-26 | Corn 14.5% DM | AM_ 054 | |||
| 27-30 | Corn 14.5% DM | AM_ 125 | |||
| 31-34 | Corn 14.5% DM | MF1 | |||
| 35-38 | MASShaniya | Corn 14.5% DM | AM_ 092 | ||
| 39-42 | Corn 14.5% DM | AM_ 073 | |||
| 43-46 | Corn 14.5% DM | AM_ 054 | |||
| 47-50 | Corn 14.5% DM | AM_ 125 | |||
| 51-55 | Corn 14.5% DM | MF1 | |||
| Sand | 28.10% |
| Silt | 67.20% |
| Clay | 4.80% |
| pH | 8.1 |
| Organic substance | 1.70% |
| Organic carbon | 0.99% |
| Total nitrogen | 0.10% |
| C / N ratio | 10.1 |
| Equivalent phosphorus | 10 p.p.m. |
| Cation exchange capacity | 10.1 meq 100 g-1 |
1Biota composition: finely ground cultivated Sorghum sudanensis roots, containing spores and ifae of Funneliformiscoronatus GO01 and GU53, F. caledonium GM24, F. intraradices GB67 and GG32, F.mosseaeGP11 and GC11, F. viscosum GC41; saprotrophic fungi: Streptomyces spp. ST60, Streptomyces spp. SB14, Streptomyces spp. SA51, Beauveria spp. BB48, Trichoderma viride, Trichoderma harzianum TH01, Trichoderma atroviride TA28, Trichoderma spp.; rhizosphere bacteria: Bacillus subtilis BA41, Pseudomonas fluorescens PN53, Pseudomonas spp. PT65 and Pochoniachlamidosporia, in a relative percentage of 40% crude inoculum and 21.6% bacteria and saprotrophic fungi; 2Rhizophagus intraradicesCA502;3Gigaspora rosea NY328A;4Sclerocystis sinuosa MD126; 5Claroideoglomus claroideum ON393.
Kernel Scanning
An NIR-SCiO mod. 2 (Consumer Physics inc, Herzliya, Tel Aviv, Israel) (Figure 1), was used to scan about twenty-five kernels selected from corn samples from each plot. Each grain was put in the center of a reverberant pill sample holder, with the embryo facing downward (Figure 2), and then scanned from 740 to 1070 nm (331 points at a 2 nm interval).
Figure 1.NIRS-SCiOTM (Consumer Physics, Tel Aviv) device ready to scan a kernel.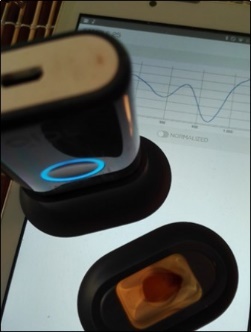
Figure 2.A kernel in the center of the reverberant pill sample holder, with the embryo facing downward.
Fingerprinting of the Symbiotic Treatment in the NIR-SCiO Spectra of the Kernels
Chemometric elaborations were carried out, by means of “The SCiO-Lab” software, which operates by means of AKA (As Known As) matrices and provides a percentage recognition of the matrix cells. The method used for the calibrative classification was the Random Forest algorithm. The percentages of fingerprinting for the Kernel Control (K_CC) and the Kernel Symbiotic (K_SS) classes were analysed according to the free MedCalc online software. The interaction Cultivar* AM type was tested, by means of a Friedman test for paired comparisons (StatBox V6.5, Grimmersoft, Paris). The predictivity of the models was established, by means of a leave-one-out validation procedure, within the four cultivars and considering the different AM types.
Connecting the NIR Spectra of the Symbiotic Kernels to the Yield Response
A wide range of Yield responses to the Symbiotic treatments was observed during the experiments developed for the present paper. Is it possible that the NIR spectra of the kernels produced in plants treated with a BF can contain some information on the degree of the Yield result? For this purpose, the PLS procedure of the SCiO-Lab software was applied to the collection, for over 1338 spectra.
NIRS Bench Analyses
Duplicate spectra of the whole grain plots were obtained using a DA1650 NIRS-FOSSTM instrument, provided with a calibration model to predict five components on a DM basis: Ash, Protein, Starch, Fiber, Fat and the NIRS undetermined Residual.
Univariate Analyses
Kernel quality data from the Control and paired Symbiotic plots were analysed using the Friedman test for paired comparisons.
Correlation and Regression Analyses
In order to explore the relationships between the quality traits and the quantity variations in yield, the regressions of the main variables, namely the Kernel spectral fingerprint (K_CC, K_SS and their average K_ ), were computed on the results of measurements previously obtained from the phenotype of the plants. The independent variables were expressed in terms of a plot effect-size, computed as the Ln of the response ratio (S/C), where the mean of the inoculated treatment (S) was divided by the mean of the non-inoculated control (C), namely d_Y = Ln(S/C). This mode of expression is arithmetically equivalent to calculating the relative prevalence of S over C (d_Y= S/C -1). Only the selected co-variables that were significant at a Pearson test were included in the regression study of the main variables.
Results
NIR-Tomoscopy of the kernels
The average reflectance spectra of the Symbiotic kernels were close to the Control ones (Figure 3). The brilliant values obtained in the reverberant chamber should be noted, especially compared to the average NIR spectra of the leaves.
Figure 3.Average NIRS-SCiO spectra of the kernels: Control (C) and Biofertilized (S-Symbiotic) (No. 2024), and of the C and S leaves (No.1316).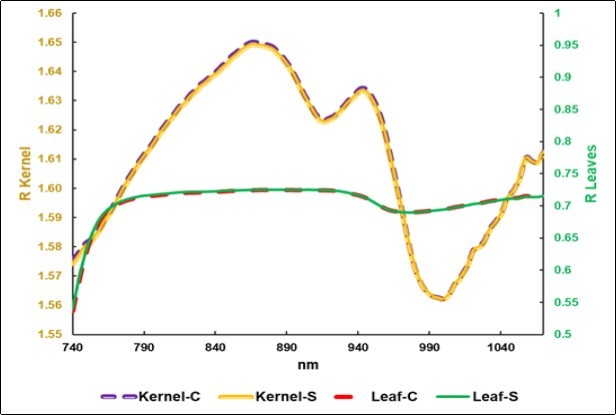
Spectral Fingerprint of the Cultivars
The spectral fingerprinting of the Kernel collection was able to perfectly discriminate the four cultivars (Table 3).
Table 3. Classification of the cultivars (Cv.) from the NIR spectra of the kernels.| Predicted Cv. | ||||
| Shaniya | 0% | 10% | 0% | 90% |
| P1547 | 0% | 0% | 100% | 0% |
| DM6318 | 0% | 90% | 0% | 10% |
| DK4316 | 100% | 0% | 0% | 0% |
| Observed Cv. ----> | DK4316 | DM6318 | P1547 | Shaniya |
| No. in the observed Cv. | 121 | 477 | 951 | 476 |
Spectral Fingerprinting of the Symbiotic Treatment and the Interactions
The fingerprinting of the Control and Symbiotic types produced the same value of 73% for the whole collection of kernel spectra (Table 4 and Table 2), but only when Micosat F was used. The fingerprint values otherwise increased for the S (88%), but decreased to 55% for the C, when the other five types of AM were included in the Symbiotic treatment: these two values are biased by the different numbers in the two classes. As far as the cultivars are concerned, higher values characterized DK4316, which was only tested in one field, with respect to P1547, which was tested in 16 plots. When different AMs were combined with two different cultivars, the results showed variable fingerprint responses to the five types (Figure 4 and Figure 5), and an interaction cultivar * AM appeared for Friedman’s test (P 0.05, Figure 4 and Figure 5 combined).
Table 4. Calibration models of the classification of the Control and Symbiotic kernels from four different maize Cultivars (Cv.) and five Arbuscular Mycorrhizal (AM) types from the NIR spectra.| Cultivars (Cv.) | Biofertilizer type | No. | No. Obs. | K_CC | No. Obs. | K_SS | Note |
| All Cv. | All types of AM | 2024 | 687 | 55% | 1338 | 88% | |
| All Cv. | Only Micosat F | 1389 | 687 | 73% | 702 | 73% | |
| DK4316 | Only Micosat F | 121 | 61 | 100% | 60 | 98% | |
| P1547 | Only Micosat F | 951 | 469 | 70% | 482 | 69% | |
| DM6318 | All types AM | 477 | 80 | 81% | 397 | 79% | Figure 4 |
| DM6318 | Only Micosat F | 157 | 80 | 92% | 77 | 89% | |
| Shaniya | All types of AM | 476 | 77 | 76% | 399 | 77% | Figure 5 |
| Shaniya | Only Micosat F | 157 | 77 | 70% | 80 | 69% |
Figure 4.Different responses in the NIR kernel fingerprint from the AM£ types in the DM6318 cultivar.
Figure 5.Different responses in the NIR kernel fingerprint from the AM£ types in cultivar Shaniya.
Validation of the Spectral Fingerprinting of the Symbiotic Treatments
In general, Kernel symbiotic models built for one cultivar cannot be extrapolated to a different cultivar. In fact, although the calibration models that excluded each cultivar were apparently satisfactory (Table 5, left), the leave-one-out validation (Table 5, right) showed high inaccuracies, especially in the K_CC values, which were systematically underestimated in the DK4316 and P1547 cultivars, while the K_SS values over-performed in the previous cultivars, but were inefficient (three cases) or underestimated (one case).
Table 5. Leave-one-out validation of the models for the classification of the Control and Symbiotic kernels from four different maize Cultivars (Cv.) and Arbuscular Mycorrhizal (AM) types from the NIR spectra.| Calibration | Leave-one-out validation | |||||||||
| AM types | Cv. excluded | No. Obs. | K_CC | K_SS | No. Obs. | K_CC | P | K_SS | Cv. validated | |
| MF-Micosat F | DK4316 | 1268 | 71% | 71% | 121 | 5% | **- | 100% | ** | DK4316 |
| MF-Micosat F | P1547 | 438 | 79% | 79% | 951 | 0% | **- | 100% | ** | P1547 |
| MF-Micosat F | DM6318 | 1232 | 73% | 74% | 477 | 68% | ** | 51% | DM6318 all AMs | |
| " | DM6318 | 1232 | 73% | 74% | 157 | 68% | ** | 43% | DM6318 only MF | |
| MF-Micosat F | Shaniya | 1229 | 68% | 73% | 476 | 79% | ** | 35% | **- | Shaniya all AMs |
| " | Shaniya | 1229 | 68% | 73% | 157 | 79% | ** | 58% | Shaniya only MF | |
Raw Composition of the Kernels and Correlations
Only the fat content was slightly increased in the Symbiotic kernel (P 0.05; Table 6). On average, the starch was increased (P 0.12) together with the fiber, while the protein, ash and undetermined residuals were decreased. The within constituent correlations of the C and S values were all significant, except for the fiber and the residual undetermined by NIRS. The two spectral fingerprints of the kernels were highly correlated (r 0.83).
Table 6. NIRS estimated composition of the kernels from the 26 pairwise comparisons, Symbiotic effect-size-and correlation.| Constituent | Control | Symbiotic | Effect-size | P (C<>S) | r (C,S) | P(r) | ||
| C | Std. Dev | S | Std. Dev | Ln (S/C) | ||||
| Protein % | 9.26 | 0.51 | 9.19 | 0.54 | -0.7% | 0.95 | 0.75 | ** |
| Fat % | 3.74 | 0.07 | 3.76 | 0.09 | 0.4% | 0.05 | 0.90 | ** |
| Fibre % | 2.73 | 0.33 | 2.80 | 0.33 | 2.5% | 0.84 | 0.23 | |
| Ash % | 1.91 | 0.04 | 1.90 | 0.05 | -0.3% | 0.30 | 0.59 | ** |
| Starch % | 74.77 | 0.63 | 74.96 | 0.83 | 0.3% | 0.12 | 0.53 | ** |
| Residual % | 7.59 | 0.68 | 7.39 | 0.85 | -2.6% | 0.24 | 0.33 | |
| Spectral Fingerprint | 84.4% | 12.6% | 82.5% | 11.2% | -2.3% | 0.20 | 0.83 | ** |
The between-trait printout (Table 5) showed significant correlation coefficients between the three main kernel variables and fourteen co-variables, out of a total of sixty, obtained from different sources in the growth phase 4.
The induced respiration (SIR) from the soil source variables was negatively correlated with the Control kernel fingerprint level (r -0.46) and with the yield results.
As far as the plant sources are concerned, all the foliar pH records (S, C, S/C) were negatively correlated with the NIRS C and S fingerprints of the kernels, clearly showing that a higher (protonic) energy charge in the leaves promoted the kernel diversification.
Among the kernel components, the fat and the starch contents were positively related to the high NIRS fingerprinting and characterization, while the protein and the fiber levels reduced the spectral originality of the C and the S kernels.
In short, the quantitative results, in terms of yield from the BF management were significantly and positively correlated with a higher diversification of the kernel, thereby permitting a higher fingerprinting in the Control groups (r 0.69) as well as in the Symbiotic one (r 0.55), where a higher productive level was available for the plants (Table 7).
Table 7. Pearson correlations of the Kernel fingerprint for the Control (K_CC) and Symbiotic (K_SS) types and of the size-effect on Yield Ln (Yield_S / Yield_C) with the phenotypic measurements on the soil, plant and kernel, from the 26 pairwise comparisons.| Main variables | ||||||
| Kernel | Yield | |||||
| Co-variables | K_CC | P | K_SS | P | Ln (Yield_S / Yield_C) | P |
| Soil Induced Respiration | -0.46 | * | -0.37 | -0.53 | ** | |
| Foliar pH C | -0.54 | ** | -0.50 | ** | -0.38 | |
| Foliar pH S | -0.77 | ** | -0.71 | ** | -0.75 | ** |
| Foliar pH ln(S/C) | -0.47 | * | -0.44 | * | -0.64 | ** |
| NIRS foliar fingerprint ln(S/C) | 0.35 | 0.42 | * | 0.27 | ||
| Foliar protein ln(S/C) | 0.60 | ** | 0.57 | ** | 0.45 | * |
| Yield ln(S/C) | 0.69 | ** | 0.55 | ** | 1.00 | |
| Kernel protein C | -0.62 | ** | -0.57 | ** | -0.62 | ** |
| Kernel protein S | -0.54 | ** | -0.49 | ** | -0.58 | ** |
| Kernel fat C | 0.58 | ** | 0.59 | ** | 0.44 | * |
| Kernel fat S | 0.61 | ** | 0.61 | ** | 0.54 | ** |
| Kernel fiber C | -0.42 | * | -0.25 | -0.29 | ||
| Kernel fiber S | -0.45 | * | -0.43 | * | -0.38 | |
| Kernel starch S | 0.41 | * | 0.48 | * | 0.39 | * |
| NIRS Kernel fingerprint C (K_CC) | 1.00 | 1.00 | 0.69 | ** | ||
| NIRS Kernel fingerprint S (K_SS) | 1.00 | 1.00 | 0.55 | ** | ||
Regression of the NIR Spectral Fingerprint of the Kernels on the Size-effect of Yield, Foliar pH and Foliar Protein
A few relationships can be considered to highlight how the NIRS kernel fingerprint – the average of the two K_CC and K_SS values - depended on the main plant variables. The main regression was the one on Yield dressing (Figure 6).
Figure 6.Regression of the average NIR spectral fingerprint of the Kernels on the size-effect of yield d_Yield = Ln(S/C). Two presumed outliers are in black.
By removing the two outliers and reversing the variables, a plausible parabolic model was obtained to estimate the yield size-effect from the NIRS fingerprint of the Control group, as shown in Figure 7 (R2 0.70).
Figure 7.Prediction of the size-effect of yield on d_Yield = Ln(S/C) from the average NIR spectral fingerprint of the Control Kernels. Two outliers have been removed.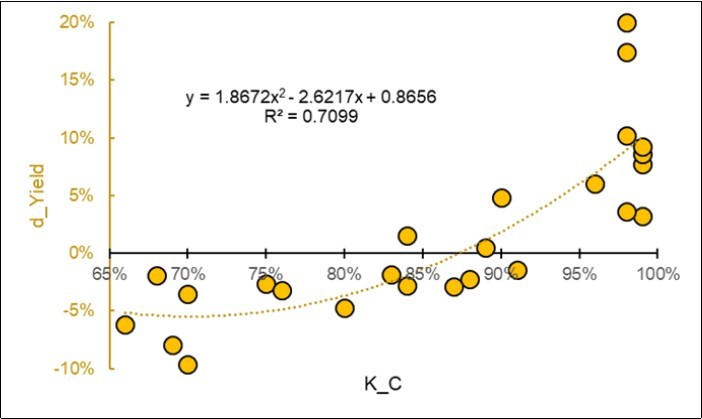
As shown in Figure 8, despite the presence of two outliers, the variation in foliar pH, due to the increase in acidity of the leaves of the plants treated with BF, was responsible for a progressive increase in yield as well as for a higher spectral level of characterization.
Figure 8.Regression of the NIR spectral fingerprint of the Kernels and the size-effect of yield d_Yield = Ln(S/C) on the foliar pH. Two presumed outliers are in black.
Moreover, the foliar protein may be considered a sign of AM symbiosis or parasitism. A close parabolic relationship (Figure 9) linked the increase in foliar protein - from a BF treatment - to the NIRS fingerprint (R2 0.43) rather than to the Yield performances (R2 0.29), and a sparse response dispersed the points, with two presumed outliers in the negative outcome zone.
Figure 9.Regression of the NIR spectral fingerprint of the Kernels and the size-effect of yield (d_Yield = Ln(S/C) on the foliar protein. Two presumed outliers are in gray.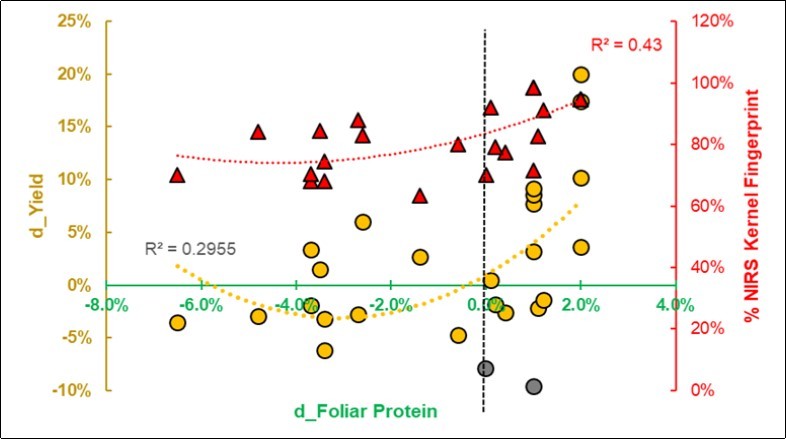
Connecting the NIR Spectra of the Symbiotic Kernels to the yield Response
The calibration of the symbiotic response in yield was successful (Figure 10). The R2 0.56 did not represent the more instructive relationships that emerged from a quadrant analysis (Table 8).
Figure 10.Plot of the measured yield response d_Yield = ln(S/C) vs. the one predicted from the NIR spectra (No. 1388).
| Predicted | Positive | 10% | 89% |
| Negative | 90% | 11% | |
| Negative | Positive | ||
| Measured | |||
In fact, a cut-off around the zero-crossing point showed that 90% of the kernels could be correctly classified, correlating the productive outcomes from the field (Table 8).
Discussion
In the first part of the study, it was shown that a Bio-fertilizer can be positive, null or even negative for yield. A symbiotic corn yield model was formulated and validated by fitting the data from the plant phenotype variables, in particular pertaining to the foliar pH and the protein level of the leaves – as issued from NIRS tomoscopy with data from a soil litter-bags test. In the present part, we will only be able to formulate a model for quality if the term “quality” is clearly identified. As far as the commercial composition of the corn is concerned, the results showed that the centesimal composition of primary compounds was not affected or just slightly affected by the BF management. However, these NIRS analyses were obtained for a small number of samples per plot. Moreover, the kernel spectra provided for many samples per plot were more informative of the organic compounds embedded in the cortical region of the seed observed with the embryo facing downward. The position of the embryo had a significant effect on quantitative calibrations18,19. Reliable models were developed to predict protein and starch contents with the embryo facing upward (scanned from below), whereas the oil content required the embryo to be facing downward. As can be seen in Figure 1, the position (scanned from above) was more favorable for protein and starch than for variations in the fat content. In fact, the complexity of protein is expected to change more than its quantity. In general, mycorrhizal fungi intervene in the modification of seed proteins, thereby benefiting their complexation in favor of the less soluble fractions. Corn seed proteins are classified into groups according to their solubility, starting with albumin (35%, soluble in water), globulins (8%, soluble in salt water), prolamine-zeine (32%, soluble in alcoholic solution) and gluteline (20%, soluble in diluted alkali). As maturation progresses, the soluble albumin yields quotas in favor of insoluble zeine and gluteline. The contribution of mycorrhizal fungi is that of anticipating the maturation of the seed with an increase in insoluble zeins (+30% compared to the control) and a reduction in soluble albumin (-32%) 6,7). The zeins and glutelins in the endosperm form the connective tissue of the starch granules.
A trial connected to the present paper12 showed that Symbiotic corn in a total mixed ration was very appreciated by dairy cows and buffered the first critical part of lactation, thereby leading to healthy milk (-16% in milk amyloid A; P 0.049) with better coagulation and cheesemaking properties. The effect of mycorrhized maize on the milk quality and properties reflected a positive effect on the overall condition of the animals, as confirmed by a higher dry matter intake (+11% P 0.003). The AA. suggest that the treatment could affect some intrinsic characteristics of the maize and ration, such as palatability and degradability.
In a previous analogous trial 20, the milk yield was the same in the two groups, but the Symbiotic group showed an increased milk protein content. This was likely due to a higher dry matter intake (22.35 vs. 21.11 kg d-1, +6%, P 0.015) for the S group, which also showed a tendency to have a higher ADG (272.21 vs. 124.72 g d-1). Further investigations are needed in order to clarify the degradability of the S diet. The protozoa count in the rumen were significantly higher in the S diet (+15.6%, P <0.05), and the total bacteria behaved accordingly (6.91 vs. 6.19 log10 g-1 DM, P <0.01).
The shelf life of corn mainly depends on the kernel shell, and after eighteen months storage for broilers, bio-fertilized corn was found to have totally preserved its properties 11, Symbiotic corn had maintained its nutritive properties, while the Control had lost about the 26% of its feeding value.
Single kernel NIR reflectance and transmittance technologies have been developed over the last two decades to establish the physical quality and chemical traits of a range of cereal grains as well as to detect and predict the levels of toxins produced by fungi 21, 22.
The handheld NIR instrument used in this experiment has furnished an excellent kernel discrimination of the conventional (Control) vs. Symbiotic sources. In fact, 20 seeds were enough to have a 95% chance of appropriately assigning the category, thus confirming previous results 23pertaining to the detection of falsified medicines. The instrument is also suitable for practical applications, as shown by its capacity to discriminate frozen milk samples originated from either grass-fed or from conventional fed cows 24 as well as to assess oxidative stress from a simple NIR-tomoscopy of the ear of rabbit does 25.
Conclusion
The main conclusion concerns the advances in knowledges from testing the responses to Biofertilizers with different Arbuscular Mycorrhiza sources in several specific maize cultivars. For this purpose, from a simple NIR SCiO scan of 20 treated and 20 untreated kernels, it was be plausible to testify the symbiotic origin of a corn from specific cultivar at 95% certainty and to argue about its agronomic traceability and sustainability.
A corollary conclusion of this work is that further studies are needed to establish the nature of symbiotic modifications in kernels. Designing the ideotype mycorrhizal symbionts to produce healthy food26 capitalizing AM effects on the biosynthesis of plant secondary metabolites with health-promoting activity, may boost sustainable biotechnological tools to produce safe and healthy plant foods. Secondary compounds of maize kernel have beneficial effects on animal feeding, and who knows how many other hitherto unknown quality properties?
Acknowledgments
The research was supported by the “Regione Lombardia “LOMICO” project.
References
- 1.Wang X. (2016) Variation in Phosphorus Acquisition Efficiency among Maize Varieties as Related to Mycorrhizal Functioning. pHD Thesis. , Wageningen 168, pp..
- 2.Nuti M, Giovannetti G. (2015) . Borderline Products between Bio-fertilizers/ Bio-effectors and Plant Protectants: The Role of Microbial Consortia.Journal of Agricultural Science and Technology A5 305-315.
- 3.Klironomos J N. (2003) Variation in plant response to native and exotic arbuscular mycorrhizal fungi. , Ecology 84, 2292-2301.
- 4.Volpato S, Masoero G, Mazzinelli G, Balconi C, Locatelli C et al. (2019) Spectroscopic and foliar pH Model for Yield prediction in a Symbiotic Corn Production. , Journal of Agricultural Research 2(1), 1-21.
- 5.Volpato S, Masoero G, Giovannetti G, Nuti M. (2020) Arbuscular Mycorrhizal Biofertilizers sources in the potato (Solanum tuberosum) plant show interactions with cultivars on yield and litter-bags spectral features. , Journal of Agronomy Research 2(4), 10-17.
- 6.Berta G, Copetta A, Gamalero E, Bona E, Cesaro P et al. (2013) Corn development and grain quality are differentially affected by mycorrhizal fungi and a growth-promoting pseudomonad in the field. , Mycorrhiza 24, 161-170.
- 7.Bona E, Scarafoni A, Marsano F, Boatti L, Copetta A et al. (2016) Arbuscular mycorrhizal symbiosis affects the grain proteome of Zea mays: a field study.Sci. Rep.6 26439.
- 8.Raiola A, Tenore G C, Petito R, Ciampaglia R, Ritieni A. (2015) Improving of nutraceutical features of many important mediterranean vegetables by inoculation with a new commercial product.Current Pharm. , Biotech.16: 738-746.
- 9.Migliorini P, Torri L, Whittaker A, Moschini V, Benedettelli S et al. (2018) Old and new common wheat (TriticumaestivumL.) varieties in organic: connecting agronomic, microorganism, phytochemical and bread sensory characteristics.Journal of Food. , Agriculture and Environment16 2, 22-27.
- 10.Tripaldi C, Novero M, S Di Giovanni, Chiarabaglio P M, Lorenzoni P et al. (2017) Impact of Mycorrhizal Fungi and rhizosphere microorganisms on maize grain yield and chemical composition.Pak. , J. Agri. Sci 54, 857-865.
- 11.Masoero G, Rotolo L, Zoccarato I, Gasco L, Schiavone A et al. (2018) Symbiotic corn can improve yield, reduce mycotoxins and preserve nutritive value.Agricultural Research Updates24. 117-140.
- 12.Tripaldi C, S Di Giovanni, Iacurto M, Locatelli S, Rinaldi S et al. (2020) Health, physico-chemical and technological characteristics of milk as affected by including mycorrhized maize grain in the diet of dairy cows.Journal of Food Safety and Food Quality. In press
- 13.Masoero G, Delmastro M, Cugnetto A, Nuti M. (2018) NIRS footprint of bio-fertilizers from hay litter-bags. , Journal of Agronomy Research 1, 22-33.
- 14.Masoero G, Giovannetti G. (2015) In-vivo stem pH testify the acidification of the maize treated by mycorrhizal and microbial consortium. , Journal of Environmental and Agricultural Sciences 3, 23-30.
- 15.Masoero G, Peiretti P G, Cugnetto A, Giovannetti G. (2018) Raw pH fall-out as a sign of a mycorrhizal modifier of Sorghum sudanensis. , Journal of Agronomy Research 1(2), 1-11.
- 16.Masoero G, Cugnetto A. (2018) The raw pH in plants: a multifaceted parameter.Journal of Agronomy Research1:. 22-33.
- 17.Giovanetti G, Polo F, Nutricato S, M. (2019) Efficacy of Commercial Symbiotic Bio-Fertilizer Consortium for Mitigating the Olive Quick Decline Syndrome (OQDS).Journal of Agronomy Research2(1),1-21.
- 18.Jiang H Y, Zhu Y J, Wei L M, Dai J R, Song T M et al. (2007) Analysis of protein, starch and oil content of single intact kernels by near infrared reflectance spectroscopy (NIRS) in maize (ZeamaysL.). , Plantbreeding 126(5), 492-7.
- 19.Janni J, Weinstock B R, Hagen L, Wright S. (2008) Novel near-infrared sampling apparatus for single kernel analysis of oil content in maize. , Applied Spectroscopy 62(4), 423-6.
- 20.Chiariotti A, Zilio D M, Contò G, S Di Giovanni, Tripaldi C. (2015) Effects of mycorrhized maize grain on milk and on rumen environment of Italian Holstein dairy cows.Italian. , Journal of Animal Science14:s1 144.
- 21.Agelet L E, Hurburgh C R. (2014) Limitations and current applications of Near Infrared Spectroscopy for single seed analysis. , Talanta 121, 288.
- 22.Cogdill R P, Hurburgh C R, Rippke G R, Bajic S J, Jones R W et al. (2004) Single-kernel maize analysis by near-infrared hyperspectral imaging.Transactions of the ASAE47(1). 311.
- 23.Wilson B K, Kaur H, Allan E L, Lozama A, Bell D. (2017) A new handheld device for the detection of falsified medicines: demonstration on falsified artemisinin-based therapies from the field.Am. , J. Trop. Med. Hyg 96, 1117-1123.
- 24.Battaglini L M, Renna M, Lussiana C, Lombardi G, Probo M et al. (2017) Smart Near Infrared Spectroscopy on frozen milk samples can discriminate grass-fed from conventional milk.Italian. , Journal of Animal Science16 1, 209-210.
Cited by (3)
- 1.Masoero Giorgio, Ariotti Riccardo, Giovannetti Giusto, Ercole Enrico, Cugnetto Alberto, et al, 2021, Connecting the use of Biofertilizers on Maize silage or Meadows with Progress in Milk Quality and Economy, Journal of Agronomy Research, 3(3), 26, 10.14302/issn.2639-3166.jar-21-3782
- 2.Cugnetto Alberto, Lajolo Luciano, Vitaloni Giovanni, Sarasso Giuseppe, Borgogno Mondino Enrico Corrado, et al, 2021, Vineyard Clusters Monitored by Means of Litterbag-NIRS and Foliar-NIRS Spectroscopic Methods, Journal of Agronomy Research, 3(2), 39, 10.14302/issn.2639-3166.jar-20-3676
- 3.Baldi Elena, Toselli Moreno, Masoero Giorgio, Nuti Marco, Adam Abubaker Haroun Mohamed, 2020, Organic and Symbiotic Fertilization of Tomato Plants Monitored by Litterbag-NIRS and Foliar-NIRS Rapid Spectroscopic Methods, Journal of Agronomy Research, 3(1), 9, 10.14302/issn.2639-3166.jar-20-3363