Abstract
The agronomic management of symbiotic (S) inoculations, by means of bio-fertilizers (BF), is aimed at inducing modifications of the plant rhizosphere and thereafter of the phenotype and yield of the crop. It is here shown that the yield response of maize to a symbiotic treatment may be correlated to six easy-to-calculate indicator variables on the basis of the raw foliar pH, NIR-Spectroscopy of leaves, and the NIRS of hay litter-bags from soils. It has been confirmed, in a set of thirteen pairwise comparisons of Symbiotic (S) soil inoculated by BF vs. Control (non-inoculated soil; C), that the inoculation on average acidified the leaves by -3.7% pH units (P<0.0001). The responses in yield ranged from +25.2% to -9.2% (av.ge +3.5%; P = 0.03), but with average null responses in two centers and a significant response (+11%) in a third center. NIR-Tomoscopy scans (No. 574) were also performed on the leaves, and in addition, hay-litter-bags that had previously been buried in fields were dug up after two months, and 431 NIR- scans were acquired. The effect-size on the yield was expressed as the logarithm of the response ratio, i.e. the mean of the inoculated Symbiotic treatment divided by the mean of the non-inoculated Control for each pairwise comparison. A multiple regression model was developed to predict the symbiotic response to the treatment using six independent variables, including the squared litter-bag fingerprints, and an R2adj. level of 0.78 (P=0.01) was reached, with a standard error of ±4%. Validation in one external maize field, with a positive response to bio-fertilizers, demonstrates the juxtaposition of the estimated and accomplished yield. In a second experiment, with 40 pairwise comparisons, the two tested maize varieties did not respond to five types of bio-fertilizer, and the negative results were predicted at 84% (P 0.0012). The soil biota is a key factor for the application of appropriate microbial inoculants in the field, but the genotype/genotype interactions between the microbial strain (s) and the crop cultivar (s) require prior screening to obtain the desired results.
Author Contributions
Academic Editor: Abubaker Haroun Mohamed Adam, Department of Crop Science (Agronomy), College of Agriculture, Bahri University- Alkadaru- Khartoum -Sudan, Sudan.
Checked for plagiarism: Yes
Review by: Single-blind
Copyright © 2019 Silvia Volpato, et al.
 This is an open-access article distributed under the terms of the Creative Commons Attribution License, which permits unrestricted use, distribution, and reproduction in any medium, provided the original author and source are credited.
Competing interests
The authors have declared that no competing interests exist.
Citation:
Introduction
Symbiotic Agriculture (SA)1, 2, 3 consists of a bio-fertilized soil management that allows a productive symbiosis to be established between soil microorganisms and the roots of cultivated plants. This fruitful alliance between plants and soil biota is primarily determined by the presence and viability of arbuscular mycorrhizal fungi (AMF), but also by the co-presence of the other microbial entities of the rhizosphere that make a vital fertilizer. The inoculum may be placed directly on the seed (coating) or near the root system4, 5.
There are numerous reasons to promote SA6:
a. to increase the yield of crops (over-yielding) with epigeal and hypogeal luxuriating7, 8, by re-functionalizing the organic-N content9;
b. to increase the resilience of crops to adversities10, 11, 12;
c. to increase the sustainability of agricultural practices, by enhancing the biological fertility of soils and the biosequestration of carbon;
d. to increase the efficacy of crop fertilization and reduce greenhouse gas emissions from the soil, and especially N2O, which is intensified as a result of the decay of AMF in over-labored soils13.
There are two environments in nature in which the highest known microbial densities are reached: the human intestine14 and the roots of plants15 (10^12-10^13 per g or ml-1). The intestinal microbiome performs functions which, when altered (dysbiosis), are in direct relationship with several human diseases16. When the intestinal microbiota is altered, probiotics are taken to restore its equilibrium. But when the microbiota of a plant (rhizosphere, endosphere and/or phyllosphere) is altered, what do we do? There are studies that show that positive results may be obtained in the rhizosphere and phyllosphere with bio-fertilizers and bio-effectors 17. In other words, the “health” of the soil depends on a balanced microbiome, which in turn generates the health of plants and their balanced microbiome, which, ultimately, allows people to have a healthy and dynamically balanced intestinal microbiome.
The aim of the present study has been to provide further insight into a symbiotic corn production, with emphasis on the reliability of the field responses, after the precise inoculation of small doses of a complex bio-fertilizer consortium, containing both AMF and non-mycorrhizal microbial agents. Moreover, three new easy-to-apply methods have been studied to model the symbiosis response in a set of calibration experiments and the validation of the model was performed in a set of other experiments.
Experimental Procedure
Three recently published rapid methods, namely the NIRS-litter-bag technique 18, raw foliar pH19, 20, 21 and foliar NIR-SCiO Tomoscopy 20, have been used together for the first time for modeling purposes, thanks to the availability of a new smart-NIR device, which has been utilized for the leaves of Sorghum sudanensis but also for live rabbits 22. The results from three calibration experiments conducted in 2018 were elaborated to formulate a model for a symbiotic corn yield. In 2019, two experiments were set up with old and new corn strains in order to evaluate the symbiotic yield response and to assess the accuracy of the model.
Materials and Methods
Experimental Plots and Inoculation (Table 1)
In 2018, three centers collaborated in the setting up and the realization of the calibration experiments (Table 1). Symbiotic inoculation was performed using a Micosat F ® bio-fertilizer, as coating (1 kg ha-1) or granulate (10 kg-1). A total of 52 plots were compared to establish the results on yield. Because some of the litter-bags and leaf samples referred to several plots, 13 Symbiotic inoculated (S) vs. Control (non-inoculated; C) pairwise comparisons were made after a grouping operation to develop the symbiotic model.
Table 1. Plan of the experiments, 2018 calibration and 2019 validation.| Experiments | Pairwise comparison | Cultivars | Yield | Bio-fertilizer | Type /dose |
| 2018 calibration, N. 52 plots | |||||
| 2018-1CREA-IC (BG, Italy) | 1 | Pioneer P1547. | Corn 14.5% DM | Micosat FMF1 | Granular10kg/ha |
| 2 | Corn 14.5% DM | ||||
| 3 | Corn 14.5% DM | ||||
| 4 | Corn 14.5% DM | ||||
| 5 | Corn 14.5% DM | ||||
| 6 | Corn 14.5% DM | ||||
| 7 | Corn 14.5% DM | ||||
| 8 | Corn 14.5% DM | ||||
| 2018-2DISAFA-1(TO, Italy) | 9 | DM waxy spikes | Tan1kg/ha | ||
| 10 | DM waxy spikes | ||||
| 11 | Corn 14.5% DM | Granular10kg/ha | |||
| 12 | Corn 14.5% DM | ||||
| 2018-3 Maïsadour | 13 | MAS 68K | Corn 14.5% DM | ||
| 2019 validation, N. 50 Plots | |||||
| 2019-1 | 14 | DK4316 | Corn 14.5% DM | MF1 | Tan1kg/ha |
| 2019-2DISAFA-2(TO, Italy) | 15-18 | MASDM6318 | Corn 14.5% DM | AM_092 | |
| 19-22 | Corn 14.5% DM | AM_ 073 | |||
| 23-26 | Corn 14.5% DM | AM_ 054 | |||
| 27-30 | Corn 14.5% DM | AM_ 125 | |||
| 31-34 | Corn 14.5% DM | MF1 | |||
| 35-38 | MASShaniya | Corn 14.5% DM | AM_ 092 | ||
| 39-42 | Corn 14.5% DM | AM_ 073 | |||
| 43-46 | Corn 14.5% DM | AM_ 054 | |||
| 47-50 | Corn 14.5% DM | AM_ 125 | |||
| 51-55 | Corn 14.5% DM | MF1 | |||
Two centers collaborated in the 2019 validation experiments. The inoculation was performed using a Micosat F ® bio-fertilizer and four AFM types as coatings (1 kg ha-1).
1Biota composition: finely ground cultivated Sorghum sudanensis roots, containing spores and ifae of Funneliformiscoronatus GO01 and GU53, F. caledonium GM24, F. intraradices GB67 and GG32, F.mosseaeGP11 and GC11, F. viscosum GC41; saprotrophic fungi: Streptomyces spp. ST60, Streptomyces spp. SB14, Streptomyces spp. SA51, Beauveria spp. BB48, Trichoderma viride, Trichoderma harzianum TH01, Trichoderma atroviride TA28, Trichoderma spp.; rhizosphere bacteria: Bacillus subtilis BA41, Pseudomonas fluorescens PN53, Pseudomonas spp. PT65 and Pochoniachlamidosporia, in a relative percentage of 40% crude inoculum and 21.6% bacteria and saprotrophic fungi; 2Rhizophagus intraradicesCA502;3Gigaspora rosea NY328A;4Sclerocystis sinuosa MD126; 5Claroideoglomus claroideum ON393.
Measuring Soil Functioning by Means of Litter-Bags
As previously described 18, hay litter-bags were buried along the plant row. After about sixty days, the probes were opened and dried at a temperature of ~ 65 ° C for 36 h and the residues were examined by means of a smart NIR-SCiOTM (Consumer-Physics, Tel Aviv) operating in the 740-1070 nm NIR band; two scans were carried out on each side of the litter-bags. The chemometric elaborations were carried out by means of the SCiOTM-Lab software, which operates by means of AKA (As Known As) matrices and provides a percentage recognition of the classification matrix cells. The algorithm used for the classification was the random forest algorithm. The percentages of fingerprinting for the Control (CC) and the Symbiotic (SS) classes were analyzed using an online MedCalc software, and one proportion was tested.
An NIR-SCiOTM equation, taken from unpublished results of an experimental trial on tomato plants, was used to obtain an indirect estimate of the soil induced respiration (SIR) capacity, which was measured according to Anderson and Domsch23. After having added sugar to the soil sample, it was possible to measure the aerobic activity, stimulated by the microbial consortium, using the infrared meter. The correlation between the estimated and measured data resulted to be sufficiently high (R2cross-validated 0.86) to be considered reliable under comparable conditions.
Foliar NIR-Tomoscoy
The NIR spectrum of the leaves was detected using the smart NIR-SCiOTM in the lower leaf page, in duplicate. Coding samples were obtained and a chemometric elaboration was carried out, as described for the litter-bags.
Measuring the Foliar pH
The raw foliar pH measurements were carried out, according to the acquisitions of previous works19, 20, 21, on cut leaves, using a BORMAC "XS pH 70" pH meter (www.giorgiobormac.com), with a pH range of 0 ÷ 14, two decimals, and supplied with a Hamilton Peek Double-PoreF, / Knick combined 35 x 6 (LxØ) glass-plastic electrode. The measurement was performed on 15 leaves per sub-group, in the central rib in the lower page, using a screw to slightly dent the rib in order to insert the electrode. Other types of electrodes have been found to not be suitable for this kind of measurement. The pH operation was conducted on fresh or conserved leaves and chained with an NIR scan.
Statistical Analyses of the Individual and Yield-Plot Data
Individual data of the raw foliar pH and of the soil respiratory capacity were analyzed by means of mixed models 24 with the bio-fertilizer and C-S pairwise comparisons as the fixed factors, while the experiment was considered as random.
Yield data from the Control and Symbiotic sub-plots and their effects were analyzed using the Friedman test for paired comparisons 25.
Modeling the Symbiotic Effect on Yeld Using Pairwise Averages
In order to model the dependent variable, as an effect- size, the yield was expressed as the Ln of the response ratio (S/C), where the mean of the inoculated treatment (S) was divided by the mean of the non-inoculated control (C), that is, d_Y = Ln(S/C). This mode of expression is arithmetically equivalent to calculating the relative prevalence of S over C (d _Y= S/C -1), with the result being given in percentage. Seven independent variables, including the squared values of the litter-bag fingerprints, were fitted to the response ratio 25 in a multiple linear regression model. In order to make the relationship positive, the average pH values were transformed into H+ as (10^-pH*10^6).
Validation Experiments
The average results of the six independent parameters issued from the two validation experiments were applied in the model and the dependent predictions were compared to the realized S/C yield deviation. A positive-negative quadrant classification was performed for the more extensive DISAFA 2018-2 experiment.
Results
Variation in Yield
The average yield measured in the fifty sub-plots of the calibration set was 14.47 t ha-1 for C vs. 15.53 for S (Table 2 and Figure 1). The relative difference spanned from +33.6% to -15.6%, with a prevalence of +7.3 %, which is globally significant for the Friedman test (P=0.03). In fact, the responses to inoculation were different in the three experiments; the inoculation was not positive in CREA-CI or Maïsadour, while in DISAFA-1, the average yield increased by +11.3% (P=0.01). In the first 2019 validation experiment (Table 3), the yield response was positive (+4%), but the average response to the five types of bio-fertilizers was negative (-3.2%; P 0.11) in the DISAFA-2 experiment and nearly significant for the Shaniya cultivar (P 0.07). Table 4.
Table 2. Results of the paired 25 Control plots and 25 Symbiotic plots in the three Centers and overall in the 2018- calibration experiments.| Experiments | # Plot Pairs | C | S | Av.C | Av.S | d_S/C% | Prob. |
| 2018-1CREA-IC(BG, Italy) | 1 | 14.64 | 14.87 | 13.79 | 13.76 | -0.2% | 0.48 |
| 2 | 13.76 | 14.61 | |||||
| 3 | 14.08 | 14.57 | |||||
| 4 | 15.24 | 14.54 | |||||
| 5 | 13.43 | 13.51 | |||||
| 6 | 14.26 | 14.65 | |||||
| 7 | 13.32 | 12.87 | |||||
| 8 | 11.56 | 10.50 | |||||
| 2018-2DISAFA-1(TO, Italy) | 9 | 16.76 | 18.60 | 14.79 | 16.47 | 11.3% | 0.01 |
| 10 | 12.61 | 14.61 | |||||
| 11 | 15.54 | 21.75 | |||||
| 12 | 14.29 | 19.16 | |||||
| 13 | 16.76 | 15.27 | |||||
| 14 | 12.61 | 16.68 | |||||
| 15 | 15.54 | 13.30 | |||||
| 16 | 14.29 | 14.10 | |||||
| 17 | 14.35 | 15.46 | |||||
| 18 | 14.87 | 16.16 | |||||
| 19 | 15.09 | 15.57 | |||||
| 20 | 14.82 | 16.19 | |||||
| 21 | 14.35 | 16.85 | |||||
| 22 | 14.87 | 17.85 | |||||
| 23 | 15.09 | 16.64 | |||||
| 24 | 14.82 | 15.35 | |||||
| 2018-3 Maïsadour-1 | 25 | 14.85 | 14.73 | 14.85 | 14.73 | -0.8% | |
| Means | 14.47 | 15.53 | 7.3% | 0.03 |
Figure 1.Calibration (1) and validation (2) experiments. Plot of the paired Control and Symbiotic plots ordered by their intraclass values.
| Experiments | # PlotPairs | C | S | Av.C | Av.S | d_S/C% | Prob. |
| 2019-1 | 26 | 12.58 | 13.1 | 4.20% | |||
| 2019-2 DISAFA-2 | 27 | 15.9 | 13.42 | ||||
| 28 | 14.42 | 15.7 | |||||
| 29 | 15.34 | 14.84 | |||||
| 30 | 17.23 | 13.94 | |||||
| 31 | 15.9 | 16.3 | |||||
| 32 | 14.42 | 14.78 | |||||
| 33 | 17.23 | 15.4 | |||||
| 34 | 15.34 | 15.29 | |||||
| 35 | 15.9 | 16.15 | |||||
| 36 | 14.42 | 16.78 | |||||
| 37 | 15.34 | 13.96 | |||||
| 38 | 17.23 | 14.39 | |||||
| 39 | 15.9 | 15.83 | |||||
| 40 | 14.42 | 15.81 | |||||
| 41 | 15.34 | 15.22 | |||||
| 42 | 17.23 | 14.65 | |||||
| 43 | 15.9 | 16.61 | |||||
| 44 | 14.42 | 14.77 | |||||
| 45 | 17.23 | 14.46 | |||||
| 46 | 15.34 | 16.17 | |||||
| 47 | 17.34 | 16.6 | |||||
| 48 | 14.42 | 13.61 | |||||
| 49 | 14.81 | 13.94 | |||||
| 50 | 15.76 | 16.21 | |||||
| 51 | 16.14 | 16.77 | |||||
| 52 | 14.42 | 16.17 | |||||
| 53 | 14.81 | 14.41 | |||||
| 54 | 15.76 | 13.82 | |||||
| 55 | 17.34 | 15.65 | |||||
| 56 | 14.42 | 16.92 | |||||
| 57 | 14.81 | 13.6 | |||||
| 58 | 15.76 | 14.41 | |||||
| 59 | 17.34 | 17.62 | |||||
| 60 | 14.42 | 15.04 | |||||
| 61 | 14.81 | 14.54 | |||||
| 62 | 15.76 | 13.32 | |||||
| 63 | 17.34 | 16.14 | |||||
| 64 | 14.42 | 14.1 | |||||
| 65 | 14.81 | 14.71 | |||||
| 66 | 15.76 | 13.55 | |||||
| Mean Validation | 15.55 | 15.09 | -3.00% | 0.16 |
| Factor | Effects | Av.C | Av.S | d_S/C% | Prob. |
| Bio-fertilizers | AM_09 | 15.65 | 14.78 | -5.6% | 0.16 |
| AM_ 07 | 15.50 | 15.37 | -0.9% | 0.56 | |
| AM_ 05 | 15.65 | 15.23 | -2.7% | 0.48 | |
| AM_ 12 | 15.65 | 15.26 | -2.5% | 0.48 | |
| MF | 15.65 | 15.06 | -3.8% | 0.48 | |
| CultivarsMaïsadour | DM6318 | 15.72 | 15.22 | -3.2% | 0.65 |
| Shaniya | 15.52 | 15.06 | -3.0% | 0.07 |
Variations in Foliar Acidity and Soil Induced Respiration (SIR) in the 2018 Calibration Experiments
The average mixed model solutions were 5.34 for C vs. 5.14 for S (P<0.0001, Table 5) for all the single measurements, and an acidification of 3.7% units of pH (P<0.0001) was observed after inoculation with the BF. Table 6 reports the thirteen pairwise plot yields and the pertinent individual average values of foliar acidity and soil respiration. As far as leaf acidity is concerned,the mean increase as a result of the S treatment was 13.8% (P=0.0066), in terms of H+, a result that was derived from four significant increases and one significant decrease (in pairwise 12). The soil respiration activity was significantly increased in two pairs, but it was also decreased in three cases, and on average it was not relevant.
Table 5. Results of the mixed model for the raw foliar pH (No. 152, 2018 calibration experiments ).| C-Control | S-Symbiotic | Ln(pH_S/pH_C) | P-value | ||||
| LSMean | ± | SE | LSMean | ± | SE | Value | |
| 5.336 | ± | 0.018 | 5.141 | ± | 0.018 | -0.0372 | <.0001 |
| Yield (t ha-1) | Foliar acidity H+ (No. 152) | SIR (mcg CO2g-1) (No. 448) | ||||||||
| Experiments | Pairwise | C-Control | S-Symbiotic | Ln(S/C) | C-Control | S-Symbiotic | Ln(S/C) | C-Control | S-Symbiotic | Ln(S/C) |
| 2018-1 CREA-IC (BG, Italy) | a | 14.64 | 14.87 | 0.015 | 4.7 | 7.7 | 0.488* | 284 | 190 | -0.399** |
| b | 13.76 | 14.61 | 0.06 | 4.5 | 6.6 | 0.4 | 261 | 240 | -0.086 | |
| c | 14.08 | 14.57 | 0.034 | 3.5 | 4.9 | 0.331 | 259 | 272 | 0.051 | |
| d | 15.24 | 14.54 | -0.047 | 6.1 | 5.7 | -0.054 | 203 | 288 | 0.350** | |
| e | 13.43 | 13.51 | 0.005 | 2.6 | 5.4 | 0.73 | 290 | 228 | -0.238** | |
| f | 14.26 | 14.65 | 0.027 | 1.3 | 4.7 | 1.251* | 253 | 250 | -0.014 | |
| g | 13.32 | 12.87 | -0.035 | 6 | 6.8 | 0.127 | 265 | 263 | -0.005 | |
| h | 11.56 | 10.5 | -0.096 | 4 | 5.4 | 0.308 | 283 | 291 | 0.028 | |
| 2018-2 DISAFA-1 (TO, Italy) | i | 14.8 | 18.53 | 0.225 | 7.9 | 10.5 | 0.28 | 246 | 285 | 0.149** |
| j | 14.8 | 14.84 | 0.002 | 7.9 | 13.4 | 0.523*** | 246 | 238 | -0.031 | |
| k | 14.79 | 15.84 | 0.069 | 28.3 | 39.2 | 0.326*** | 234 | 274 | 0.161** | |
| l | 14.79 | 16.67 | 0.12 | 28.3 | 11.9 | -0.865*** | 234 | 254 | 0.083 | |
| 2018-3 Maïsadour | m | 14.85 | 14.73 | -0.008 | 6.3 | 5.6 | -0.113 | 490 | 433 | -0.124** |
| Means | 14.18 | 14.67 | 0.029 | 8.6 | 9.8 | 0.138*** | 272.71 | 269.77 | -0.006 | |
Regression of the Yield on the Foliar pH
In the 2018 calibration experiments (Figure 2), the regression was only negative for the S plots. As highlighted in Figure 3, which is scaled in the same way as Figure 2, the pH range was more limited in the 2019 DISAFA-2 validation experiment, but a positive regression basically appeared for both the C and the S plots.
Figure 2.2018 calibration experiment. Plot of the yield response to the foliar pH variations in the Control and Symbiotic plots.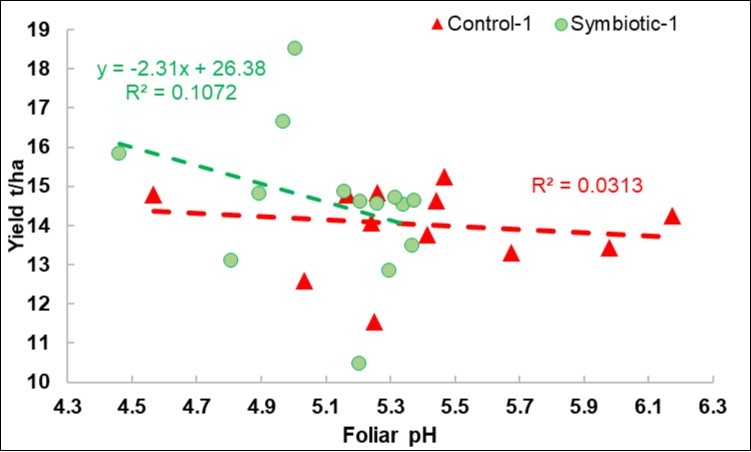
Figure 3.2019-2 DISAFA-2 validation experiment. Plot of the yield response to the foliar pH variations in the Control and Symbiotic plots, with the same scales as Figure 2.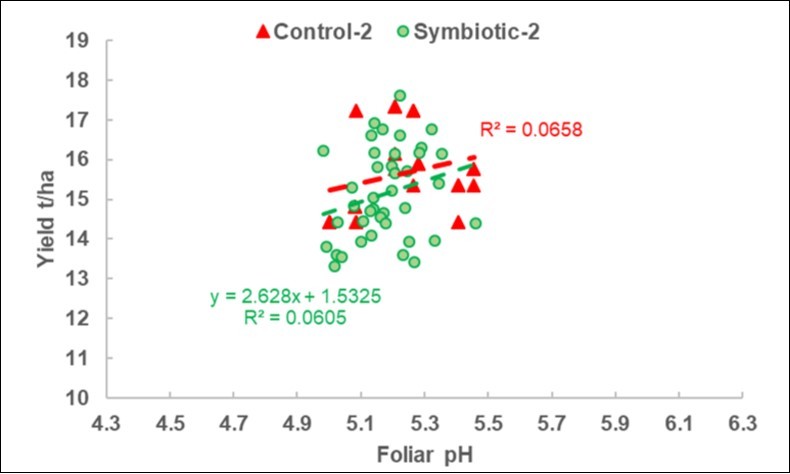
Pairwise Covariation Between the Symbiotic Yield Response (d_Y) and the Soil Induced Respiration (SIR) in the 2018 Calibration Experiments
The increase in yield was favored where the respiration of the soil increased , as can be seen in Figure 4. This result was clear after the exclusion of two outliers (in red), and a parabolic positive trend was noted.
Figure 4.Calibration experiment. Plot of the pairwise response of the yield (Y: d_Yield =Ln(S/C)) on the overall soil induced respiration (d_SIR = Ln(C/S)) (red-line) and after two outliers (in red) were excluded.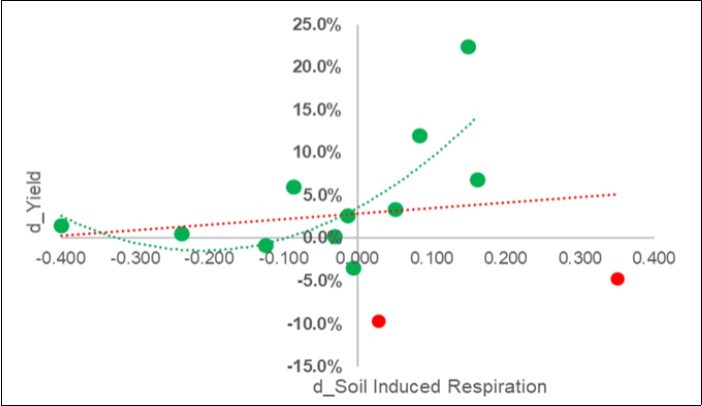
Fingerprinting of the Leaves in the Calibration Experiments
On average, the leaves of the C and S groupes were classified at a similar sensitivity level, that is, at 73.6 and 72.9%, respectively, for the C and S categories (Table 7). When considering the NIR-Tomoscopy and the yield (Figure 5), the linear regression in the fingerprint % of the leaves of the Control was slightly positive, while that of the Symbiotic was slightly negative. No deviation from linearity was apparent.
Table 7. Results of the 13 pairwise values in the 2018 calibration experiments. All the values are in %.| Pairwise | Yield | Acidity | Foliar NIR-Tomoscopy | Litter-bags NIRS | |||
| d_Y1 | d_H2 | F_ CC3 | F_ SS4 | L_ CC3 | L_%SS4 | ||
| 1 | a | 1.5 | 66 | 82 | 87 | 86 | 92 |
| 2 | b | 6.0 | 48 | 69 | 58 | 92 | 91 |
| 3 | c | 3.4 | -4 | 75 | 69 | 75 | 86 |
| 4 | d | -4.7 | 30 | 75 | 75 | 92 | 100 |
| 5 | e | 0.5 | 141 | 74 | 77 | 96 | 100 |
| 6 | f | 2.7 | 185 | 61 | 63 | 95 | 91 |
| 7 | g | -3.5 | 87 | 71 | 77 | 100 | 90 |
| 8 | h | -9.6 | 11 | 88 | 71 | 100 | 100 |
| 9 | i5 | 22.5 | 37 | 77 | 75 | 78 | 78 |
| 10 | j | 0.2 | 63 | 80 | 88 | 72 | 71 |
| 11 | k | 6.9 | 25 | 78 | 75 | 84 | 87 |
| 12 | l | 12.0 | -92 | 88 | 65 | 82 | 74 |
| 13 | m | -0.8 | -12 | 39 | 68 | 66 | 79 |
| Mean | 3.4 | 44.9 | 73.6 | 72.9 | 86.0 | 87.6 | |
| Std. | 8.0 | 69.4 | 12.7 | 8.7 | 11.0 | 9.7 | |
| Var. coef. | 236% | 154% | 17% | 12% | 13% | 11% | |
Figure 5.Plot of the regression of the pairwise response of the Yield (Y axis) on the NIR-Foliar fingerprints (X axis) for the Symbiotic (F_SS, in green) and the Control leaves (F_CC, in red).
Fingerprinting of the Litter-Bags
A high sensitivity was reached for the AKA classification of the litter-bags (86.0 and 87.6%, respectively, Table 7). When the NIR fingerprint of the litter-bags and the yield were considered together (Figure 6), the regressions in the fingerprints of the Control and of the Symbiotic probes were markedly negative, but a parabolic trend enhanced a maximum of the yield response by around 80-85% for the fingerprinting, and this was further confirmed for the CC litter-bags.
Figure 6.Regression plot of the Yield response (Y axis) to the litter-bag fingerprints (X axis) for the Symbiotic (L_SS, in brown) and the Control litter-bags (L_CC, in red).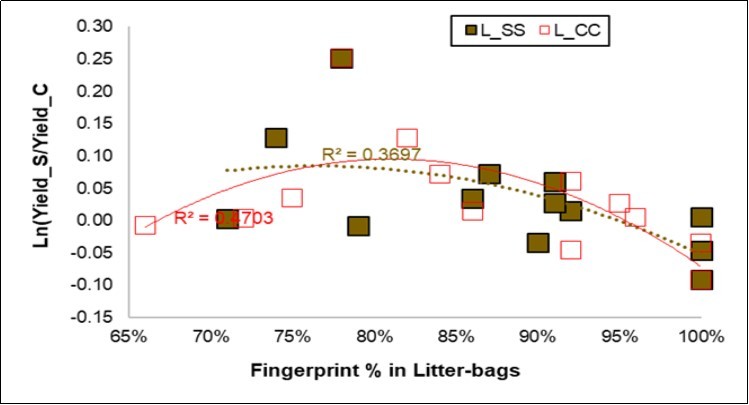
A Multiple Regression Model for the Symbiotic Yield
After excluding one outlier, the d_Y model reached an adjusted R2adj. of 0.78 (P=0.01), with a standard error of ±4% (Table 6; Figure 7). The relationship with the yield increase was driven by the fingerprint in the Control litter-bags (std coef. = 11.85) and by its squared term (-11.77). Table 8
Figure 7.Plot of the measured vs. predicted paired responses of the Yield (d_Y=ln(S/C) in the calibration dataset (2018) and in the 2019-1 external validation test (X=4.2%; Y=7.0%).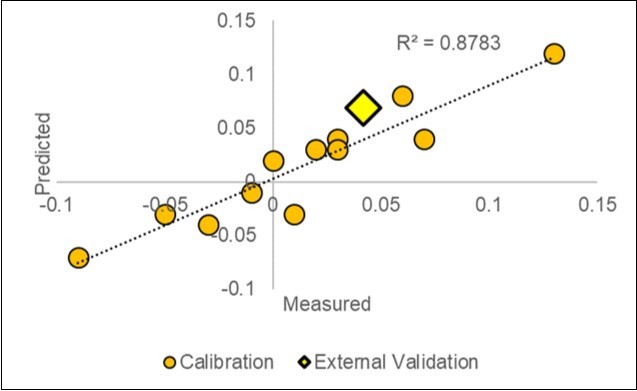
| Yield model | Coef. | ± Stdev. | Std Coef | t-ratio | P-value |
| Constant | -2.190 | 0.540 | 0.000 | -4.060 | 0.0049 |
| d_H | -0.010 | 0.020 | -0.050 | -0.270 | 0.3983 |
| d_SIR | -0.070 | 0.050 | -0.240 | -1.530 | 0.0936 |
| NIR Foliar %fingerprint_SS | -0.270 | 0.100 | -0.420 | -2.770 | 0.0197 |
| NIR Litter-bags %fingerprint CC | 6.130 | 1.290 | 11.850 | 4.740 | 0.0026 |
| NIR Litter-bags %fingerprint CC ^2 | -3.620 | 0.770 | -11.770 | -4.690 | 0.0027 |
| NIR Litter-bags %fingerprint SS ^2 | -0.200 | 0.080 | -0.590 | -2.500 | 0.0274 |
| R2adj | 0.78 | 0.0104 | |||
| Standard error | ±4% |
2019 External Validation Experiments
The first experiment in 2019-1, which was based on 75 pH and a leaf examination plus 40 NIR SCiO scans of 20 litterbags, has shown a good agreement between the yield predicted by the model (7.0%) and the yield realized in the field (4.2%). Both values are in the same quadrant of Figure 7 near the diagonal.
In the 2019-2 DISAFA-2 experiment, where a relevant body of measurements were conducted, that is, nearly two thousand (730 leaves for pH and NIR-Tomoscopy plus 350 scans of litter-bags), the average regression response was null (Figure 8), but the classification in the quadrants (Table 9) showed that the general negative response to bio-fertilizers was correctly predicted by 84% in the “bad” quadrant (P 0.0012) and the general means collimated (-2.66% predicted vs. -3.02% realized).
Figure 8.Scatterplot of the 40 pairs of validation results from the 2019 DISAFA-2 experiment highlighted in the quadrants. -2.66% av.ge predicted; -3.02% av.ge realized.
| Results | Positive | 16% | 44% |
| Negative | 84% P 0.0012 | 56% | |
| Negative | Positive | ||
| Predictions | |||
Discussion
A significant, albeit highly variable positive response of maize yield to bio-fertilizer was observed (+7.3%) in the calibration, but the response to bio-fertilizers was disappointing in the validation experiments. In literature, maize-grain responses in yield were positive in some cases (+6.4% 26; +4÷30% 3; +10% 19; +18% 27; +20% 28) or null 29. Mazzinelli 30 observed a +5% increase from a Mycorrhizal consortium in three experiments at a farm level in 2018. Thanks to the great variability of our 2018 cornucopia experiment, an attempt may now be made to explain some of the involved factors by means of the new methods that have been adopted here.
Yield Response and pH
The foliar pH measurements, which on average were 5.23 in 2018 and 5.20 in 2019, confirmed the previously obtained acidic value of 4.84 in the stems19, 21 and the 5.14 value obtained in Sorghum sudanensis20. The lack of response in the 2019-2 validation experiment has clearly been anticipated, as can be seen from the contrasting trend of the foliar pH, which was increased over the scatter-plots (Figure 3). In the Sorghum sudanensisstudy 20, the foliar pH parameter played a pivotal role in the chemical composition variations and in the plant mass growth. The confirmation of the raw pH fall, as a sign of a probable mycorrhizal modification, is in agreement with previous findings on several species19, 20, 21. In the limited number of studies conducted up to now, the raw pH in plants has shown signs of some regulation of the thermo-water mechanisms 21, with a variation of -0.07 pH °C-1 in the aerial temperature increase, while an average reduction of 0.10 units of pH would indicate an increase in water stress of about -0.59 MPa. The pH adjustments of plants to a water-thermal-light environment are active dynamic processes, and not passive ones, which require the presence of light, and they may differ according to the species and the symbiotic relationships. However, only one piece of evidence is so far available concerning the connection between a pH fall and yield increases on a field experiment basis 19. In the present work, a constant relationship cannot be assumed, except for a negative trend which was observed below the core of the expected favorable variations. The comprehension of such a reliable result of pH fall, but a failure in yield response, may be one of the keys for advances in symbiotic corn production. Among the abiotic factors worthy of consideration, the soil pH had no influence on the foliar pH 31, but it was able to modify the rhizosphere 32, and consequently may disturb the beneficial biotas in a similar way as what happens for herbicide residues 33.
Yield Response and NIRS Fingerprinting
The second method used in this work was the NIR-Tomoscopy of leaves. In the study with Sorghum20, the fingerprint of the Control was 96% vs. 81% in the Micosat group. In the present work, the yield response connection to the foliar NIR scans (Figure 5) appeared much lower than the connection to the litter-bags (Figure 6).
Finally, the litter-bag responses appeared to be related to the pH mechanisms but also, and more interestingly, to yield production. The parabolic trend observed in Figure 6 shows similar responses from the C and the S litter-bags, and this new feature may be assimilated to a Mitscherlich curve.
Johnson et al 34 submitted the mycorrhizal factor to a Law of Minimum examination, using the C4 Andropogongerardii species. The results supported the hypothesis that mutualism likely occurs in P-limited systems, while commensalism or parasitism is probable in N-restricted systems. Soil fertility is the key to controlling mycorrhizal costs and benefits, and the Law of Minimum is a useful predictor of the mycorrhizal phenotype. Mycorrhizal fungi can improve the limitation of P in herbage experiments, but not the limitation of N.
In the first experiments conducted to formalize the litter-bag method 18, the eight litter-bag calibration studies, devoid of yield results, showed an average sensitivity of 62% for C and 71% for S, values that now result to clearly be below the range of sensitivity expressed in the present work with reference to intensive corn fields.
A first question arises about the interdependencies of the C and S fingerprints. Are the two closely correlated (r=0.79 in this 2018 experiments)? In theory, if the inoculation has no effect, the threshold of 50% should buffer the AKA classification. Instead, when an effect is present, the differentiation increases, and both the S and C fingerprints should grow.
The question now concerns the band with low litter-bag fingerprints: what does this mean? In our opinion, a minimum of receptivity in the soil is necessary to start reliable mechanisms in the rhizosphere: a “law of the minimum” that must be overcome.
Moreover, what about the soils with too high litter-bag fingerprints? As for all fertilizers, the symbiotic responses are parabolic, and mutualism, or even parasitism, can therefore take place till the yield diminishes. Klironomos 35 compared local and exotic species with both local and exotic AMF and revealed how plant growth responses to inoculation can range from highly mutualistic to parasitic.
Soil Respiration Capacity and Essential Results from an Olive Experiment
In the final model, the soil respiration parameter did not appear to be statistically significant, because of some biased points (Figure 4). It therefore appears necessary to validate the SIR prediction model under several conditions, and especially where the estimated parameter decays significantly in BF soils. It should be pointed out that, in a simultaneous experiment conducted on olive groves in Apulia 36,with the same methodologies, pertaining to the same BF and the plant-soil survey adopted in the present work, SIR and leaf acidity were indicated in the model as being favorable for a reduction of the disease severity degree. In that experiment, the NIR-Tomoscopy of hay-litter-bags from non-inoculated soils was confirmed to be able to forecast the outcome of bio-fertilizer inoculation, and a holistic model that gathered differential and compositional analyses of the leaf (pH, crude protein, water) and of the soil (respiration) was able to explain over 95% of the average mitigation response to microbial inoculation. Two keys for a successful inoculation were identified in the olive experiment: i) a high degree of variability of the soil conditions with an enhancement of microbial activity (lowering the fingerprint of the control litter-bags), and ii) a homogeneity of the leaves (with increases in the fingerprint of the leaves treated with BF), a result that has not been confirmed in the present maize experiment.
External Validation: Statistical Success and Symbiotic Failure
The model has proved to be predictive in both directions. Along the positive side, we have obtained encouraging results, while the negative side induces to reflect to a lack of knowledge for the symbiotic mechanisms. The failure to raise the yields observed in the main validation experiment has been forecast, since foliar pH and litter-bags were examined and the model was tested, thus the capacity of the model has been confirmed, even for null or negative outcomes. Therefore, how can we explain the failure of a positive symbiosis on yield in the bio-fertilized plots? The centers and soils were the same as those of the successful 2018 experiments, and the phenotype variability appeared somewhat restricted, but the substantial difference, in our opinion, are due to the genetic background of the cultivars. In 2018, it was the MAS 68K that did not respond, while in 2019 neither MAS DM6318 nor MAS Shaniya responded, thereby reducing the symbiotic relationship to commensalism or even parasitism. Since several AM fungi were involved, a general factor that hinders symbiosis can be envisaged in these genetic lines. The selection for resistance to fungi diseases perhaps also carried over an adversive effect to the beneficial fungi. This hypothesis should be taken into consideration for bio-fertilization advances.
Conclusions
In the advancement of a more generalized use of bio-fertilizers for a sustainable and high-producing symbiotic agriculture, we are currently facing three kinds of difficulties. First, the local conditions, which require a tuning of the soil management and concurrent mineral factors that are favorable for bio-fertilizers, namely N- and P-availability. Second, a variable genetic asset of the crops, which might impede efforts to promote a bio-variability in the soil microbial biota favorable to viability and activity of local and inoculated AM strains, if some higly productive crops are genetically disadvantaged to establish new AM symbiosis. Third, “bureaucratical” effects, which evoke a sort of aversion to soil microorganisms, with the exception of those that have an antimicrobial effect, such as pesticides.
The results reported in this study encourage further implementation of the basic symbiotic model for maize production a basic crop that is currently threatened by high costs of production. In our opinion, this minor research route for smart agriculture could lead to an advancement in parallel knowledge concerning the hard microbiomic horizon37, 38. In this context, the most interesting result has been to confirm the validity of the rapid analyses of foliar pH as an effective way of phenotyping AM symbiosis, and the litter-bag probes as a means of signaling the local hospitality of a soil to biota inoculations. However, it should be recalled that a very small amount of inoculum needs to be inserted precisely near the roots, and it is thereafter multiplied in the crop rhizosphere: a very precise farming operation.
Further research, focused on genetic-genetic interactions, is still needed, and the easy methods, but especially the foliar pH and the litter-bags, as here described, can be used to ascertain the efficiency of biofertilizers and promote an improvement in soil fertility.
Acknowledgments
The research was supported by the “Regione Lombardia “LOMICO” project.
Thanks to Amedeo Reyneri and Massimo Blandino for their appreciation of and support with the symbiotic method.
References
- 1.SSK Vurukonda, Giovanardi D, Stefani E. (2017) Symbiotic Agriculture: increasing knowledge on the mode of action of beneficial microorganisms. Poster at the XXIII National Conference of Italian Society of Plant Pathology .
- 2.Peiretti P G, Tassone S, Masoero G, Barbera S. (2018) Chemical and physical properties of meat of bulls and steers fed Mycorrhizal or Conventional corn.Agricultural Research Updates23. 177-196.
- 3.Masoero G, Rotolo L, Zoccarato I, Gasco L, Schiavon A et al. (2018) Symbiotic corn can improve yield, reduce mycotoxins and preserve nutritive value.Agricultural Research Updates24. 117-140.
- 4.Colla G, Rouphael Y, Bonini P, Cardarelli M. (2015) Coating seeds with endophytic fungi enhances growth, nutrient uptake, yield and grain quality of winter wheat. , Int J Plant Prod 9(2), 171-90.
- 5.Siddiqui Z A, Pichtel J. (2008) Mycorrhizae: an overview. In Mycorrhizae: Sustainable Agriculture and Forestry. , Dordrecht 1-35.
- 6.Sergaki C, Lagunas B, Lidbury I, Gifford M L, Schäfer P. (2018) Challenges and approaches in microbiome research: from fundamental to applied.Frontiers in plant science.9. 1205, 1-12.
- 7.Pellegrino E, Öpik M, Bonaria E, Ercoli L. (2015) Responses of wheat to arbuscular mycorrhizal fungi: A meta-analysis of field studies. from1975 to 2013.Soil Biology and Biochemistry84 210-217.
- 8.Mäder P. (2011) Inoculation of root microorganisms for sustainable production of high nutritional quality wheat. in India.Soil Biology & Biochemistry43 609-619.
- 9.Thirkell T J, Cameron D D, Hodge A. (2016) Resolving the ‘nitrogen paradox’ of arbuscular mycorrhizas: fertilization with organic matter brings considerable benefits for plant nutrition and growth.Plant. Cell and Environment39 1683-1690.
- 10.Bender S F, Wagg C, MGA van der Heijden. (2016) An underground revolution: biodiversity and soil ecological engineering for agricultural sustainability.Trends. Ecol.Evol.31 440-452.
- 11.Lladó S, López-Mondéjar R, Baldrian P. (2017) Forest soil bacteria: diversity, involvement in ecosystem processes, and response to global change.Microbiol. , Mol. Biol. Rev.81 00063-16.
- 12.Akhtar M S, Siddiqui Z A.(2008).Arbuscular mycorrhizal fungi as potential bioprotectants against plant pathogens. InMycorrhizae:Sustainable agriculture and forestry. , Dordrecht 61-97.
- 13.Bender S F, Plantenga F, Neftel A, Jocher M, Oberholzer H R. (2014) Symbiotic relationships between soil fungi and plants reduce N2O emissions from soil.The ISME. Journal8 1336-1345.
- 14.Thursby E, Juge N. (2017) Introduction to the human gut microbiota.Biochemical. , Journal 474, 1823-36.
- 15.Berendsen R L, Pieterse C M, Bakker P A. (2012) The rhizosphere microbiome and plant health.Trends in plant science. 17, 478-86.
- 16.Cerf-Bensussan N, Gaboriau-Routhiau V. (2010) The immune system and the gut microbiota: friends or foes?Nature Reviews Immunology10. 735.
- 17.Nuti M, Giovannetti G. (2015) . Borderline Products between Bio-fertilizers/ Bio-effectors and Plant Protectants: The Role of Microbial Consortia.Journal of Agricultural Science and Technology A 5, 305-315.
- 18.Masoero G, Delmastro M, Cugnetto A, Giovannetti G, Nuti M. (2018) NIRS footprint of bio-fertilizers from hay litter-bags.Journal of. , Agronomy Research 1, 22-33.
- 19.Masoero G, Giovannetti G. (2015) In-vivo stem pH testify the acidification of the maize treated by mycorrhizal and microbial consortium.Journal of Environmental and Agricultural. Sciences3 23-30.
- 20.Masoero G, Peiretti P G, Cugnetto A, Giovannetti G. (2018) Raw pH fall-out as a sign of a mycorrhizal modifier ofSorghumsudanensis.Journal of Agronomy Research1(2):. 1-11.
- 21.Masoero G, Cugnetto A. (2018) The raw pH in plants: a multifaceted parameter.Journal of Agronomy Research1:. 22-33.
- 22.Candellone A, Peiretti P G, G Masoero. (2017) Efficiency of in vivo ear flap NIR scan in the detection of differences related to diet or pregnancy status in young rabbit does.Italian. , Journal of Animal Science16 1, 219.
- 23.Anderson J, Domsch K. (1978) A physiological method for the quantitative measurement of microbial biomass. in soils.Soil Biology and Biochemistry10 215-221.
- 26.Masoero G, Giovannetti G. (2011) Biotecnologie agrarie basate sui consorzi microbici. Prime osservazioni agronomiche e qualitative.Annali Accademia di Agricoltura di Torino153 111-127.
- 27.Sabia E, Claps S, Morone G, Bruno A, Sepe L et al. (2015) Field inoculation of arbuscular mycorrhiza on maize (Zea mays L.) under low inputs: preliminary study on quantitative and qualitative aspects.It. , J Agronomy10 30-33.
- 28.Uzun P. (2016) Improvement of forage yield to improve dairy product quality: mycorrhizal fungi application and differentiation of forage conservation methods.Doctoral thesis.University of Naples Federico II. 1-84.
- 29.Tripaldi C, Novero M, S Di Giovanni, Chiarabaglio P M, Lorenzoni P et al. (2017) Impact of Mycorrhizal Fungi and rhizosphere microorganisms on maize grain yield and chemical composition. , Pak. J. Agri. Sci 54, 857-865.
- 30.Mazzinelli G. (2019) Reti nazionali confronto varietale Mais: Risultati2018. Giornata del Mais. , Bergamo
- 31.JGC Cornelissen, Sibma F, Van Logtestijn RSP, Broekman R A, Thompson K. (2011) Leaf pH as a plant trait: species-driven rather than soil-driven variation.Functional. Ecology25 449-455.
- 32.Clark R B. (1997) Arbuscular mycorrhizal adaptation, spore germination, root colonization, and host plant growth and mineral acquisition at low pH.Plant and soil192. 15-22.
- 33.Weidenhamer J D, Callaway R M. (2010) Direct and indirect effects of invasive plants on soil chemistry and ecosystem function.Journal of chemical ecology36. 59-69.
- 34.Johnson N C, Wilson G W, Wilson J A, Miller R M, Bowker M A. (2015) . Mycorrhizal phenotypes and the Law of the Minimum.New Phytol.205 1473-84.
- 35.Klironomos J N. (2003) Variation in plant response to native and exotic arbuscular mycorrhizal fungi.Ecology84. 2292-2301.
- 36.Giovannetti G, Polo F, Nutricato S, Masoero G, Nuti M. (2019) Efficacy of commercial symbiotic bio-fertilizer consortium for mitigating the Olive Quick Decline Syndrome (OQDS).Journal of AgronomyResearch2(1):. 1-21.
Cited by (11)
- 1.Volpato Silvia, Masoero Giorgio, Giovannetti Giusto, Nuti Marco, Mohamed Adam Abubaker Haroun, 2020, Arbuscular Mycorrhizal Biofertilizers Sources in the Potato (Solanum Tuberosum) Plant show Interactions with Cultivars on Yield and Litter-bags Spectral Features, Journal of Agronomy Research, 2(4), 9, 10.14302/issn.2639-3166.jar-20-3185
- 2.Baldi Elena, Toselli Moreno, Masoero Giorgio, Nuti Marco, Adam Abubaker Haroun Mohamed, 2020, Organic and Symbiotic Fertilization of Tomato Plants Monitored by Litterbag-NIRS and Foliar-NIRS Rapid Spectroscopic Methods, Journal of Agronomy Research, 3(1), 9, 10.14302/issn.2639-3166.jar-20-3363
- 3.Hett Jonas, Neuhoff Daniel, Döring Thomas F., Masoero Giorgio, Ercole Enrico, et al, 2022, Effects of Multi-Species Microbial Inoculants on Early Wheat Growth and Litterbag Microbial Activity, Agronomy, 12(4), 899, 10.3390/agronomy12040899
- 4.Masoero Giorgio, Mazzinelli Gianfranco, Balconi Carlotta, Locatelli Sabrina, Lanzanova Chiara, et al, 2020, Spectroscopic Kernel Quality from a Symbiotic Corn Production, Journal of Agronomy Research, 2(4), 18, 10.14302/issn.2639-3166.jar-20-3260
- 5.Masoero Giorgio, Cugnetto Alberto, Sarasso Giuseppe, D’Amore Giovanni, Giovannetti Giusto, et al, 2020, UV rays Decrease Foliar pH in Cress (Lepidium Sativum) and Modify NIR Spectrum, Journal of Agronomy Research, 3(2), 17, 10.14302/issn.2639-3166.jar-20-3639
- 6.Cugnetto Alberto, Lajolo Luciano, Vitaloni Giovanni, Sarasso Giuseppe, Borgogno Mondino Enrico Corrado, et al, 2021, Vineyard Clusters Monitored by Means of Litterbag-NIRS and Foliar-NIRS Spectroscopic Methods, Journal of Agronomy Research, 3(2), 39, 10.14302/issn.2639-3166.jar-20-3676
- 7.Masoero Giorgio, Ariotti Riccardo, Giovannetti Giusto, Ercole Enrico, Cugnetto Alberto, et al, 2021, Connecting the use of Biofertilizers on Maize silage or Meadows with Progress in Milk Quality and Economy, Journal of Agronomy Research, 3(3), 26, 10.14302/issn.2639-3166.jar-21-3782
- 8.Nuti Marco, Giovannetti Giusto, Scortichini Marco, Pergolese Giovanni, Saracino Michele, et al, 2021, The Olive Quick Decline Syndrome: A Syndemic Outbreak in the Apulia Region, Southern Italy, Journal of Agronomy Research, 3(3), 13, 10.14302/issn.2639-3166.jar-21-3703
- 9.Masoero Giorgio, Oggiano Philipp, Migliorini Paola, Taran Aliaksei, Nuti Marco, et al, 2022, Litterbag-NIRS to Forecast Yield: a Horticultural Case with Biofertilizer Effectors, Journal of Soil Science and Plant Nutrition, 22(1), 186, 10.1007/s42729-021-00643-5
- 10.Yang Xuziqi, Hua Zekai, Li Liang, Huo Xingheng, Zhao Ziqiang, 2024, Multi-source information fusion-driven corn yield prediction using the Random Forest from the perspective of Agricultural and Forestry Economic Management, Scientific Reports, 14(1), 10.1038/s41598-024-54354-9
- 11.Masoero Giorgio, Cugnetto Alberto, Sarasso Giuseppe, Giovannetti Giusto, Nuti Marco, et al, 2019, Sunspots are Correlated with Foliar pH in Grapevines, Journal of Agronomy Research, 2(3), 31, 10.14302/issn.2639-3166.jar-19-3116