
Abstract
Background
In Low Middle-Income Countries (LIMCs), malnutrition, especially undernutrition is one of the leading causes of childhood mortality and morbidity. Poor complementary feeding practices are among the most notable contributors to poor nutritional indicators in children under five. This article provides an output of secondary data analysis of the Cost of Diet (CoD) and Optifood component of National Complementary Feeding Assessment conducted by UNICEF Pakistan along with Pakistan Demographic Health Survey (PDHS) 2018.
Methods
For correlation of Optifood data and CoD data with PDHS data of CF, GraphPad software, MS Excel was used along with manual quantifications. The analysis of DHS-2018 data was conducted using STATA software. Univariate analysis included comparison of categorical variables i.e. various individual, household and community level parameters with that of outcome variables of minimum dietary diversity (MDD), minimum meal frequency (MMF) and minimum dietary diversity (MAD) using chi-square test.
Findings
The overall rate of MMF was 56.6% among children of 6-23 months of age with MDD in 18.6% and MAD in 13.8% of children. Percentage of annual cost spent on nutritious diet for MDD, MMF and MAD varies from 27.86% to 43.08% across all the provinces. Children aged 6–8 months and 9–11 months often consumed infant milk and cereals, while children aged 12–23 months often consumed eggs and grain products. Consumption of dairy products was highest in Punjab, Sindh, AJK, and Islamabad, that of grains roots and tubers was highest in KPK, FATA and GB.
Conclusion
Considering CF practices in Pakistan are inadequate as indicated by poor MDD, MMF, and MAD, therefore it is imperative that a holistic approach using both communication and non-communication based interventions is to be employed through active stakeholder engagement.
Author Contributions
Academic Editor: Anubha Bajaj, Consultant Histopathologist
Checked for plagiarism: Yes
Review by: Single-blind
Copyright © 2023 Saba Shuja, et al.
 This is an open-access article distributed under the terms of the Creative Commons Attribution License, which permits unrestricted use, distribution, and reproduction in any medium, provided the original author and source are credited.
Competing interests
The authors have declared that no competing interests exist.
Citation:
Introduction
Malnutrition, particularly undernutrition, continues to be one of the leading causes of childhood morbidity and mortality in Low Middle-Income Countries (LMICs)1, 2. This is defined by an insufficient provision of energy and nutrients to the body including good quality protein and an adequate balance of essential amino acids, vitamins and minerals, thus leading to an inability to meet the requirements of the body for optimal growth and development3. Within the first five years of life, the initial 2 years encompass the most critical developmental period4. This means that early nutritional deficiencies during this period can lead to impaired intellectual performance, reduced work capacity, poor reproductive outcomes, and overall poor health during adolescence and adulthood5. Additionally, undernourished children aged less than 5 years are more prone to repeated infections as their low immunity and repeated episodes of infection like diarrhea, pneumonia and other infectious diseases increase risk of severe morbidity and mortality5. In the long run, undernutrition hits the economy of a country thus pushing it further into poverty6.
Based on the Child Malnutrition Estimates report, 144 million children under five were stunted in 2019 whereas 47 million were found to be wasted7. In Pakistan, according to the National Nutrition Survey (NNS) 2018, 40.2% children are stunted, 17.7% are wasted and 28.9% are underweight8. Among the most notable contributors to poor nutritional indicators in children under five, poor complementary feeding practices is one9. Complementary feeding is defined as the process starting when breast milk alone is no longer sufficient to meet the nutritional requirements of infants, and therefore other foods and liquids are needed, along with breast milk10. Quality of complementary feeding is measured using three indicators; Minimum Dietary Diversity (MDD), Minimum Meal Frequency (MMF), and Minimum Acceptable Diet (MAD) which are poor according to the latest NNS results (14.2%, 18.2% and 3.6% respectively) in Pakistan8. MDD is an indicator whereby children are fed at least 5 out of 8 food groups, MMF is minimum number of meals/snacks in a day and MAD is the minimum number of meals in a day along with food from minimum number of food groups11.
It is imperative to improve the CF practices and in turn the nutritional status of young children within Pakistan. For this purpose, context specific, effective and innovative solutions are to be developed and implemented. Ample data has been generated within Pakistan on CF over the course of last few years which can be used to generate high quality evidence to guide development of such solutions12, 13, 14, 15, 16, 17. One such evidence base which has focused on identifying reasons behind the sub-optimal feeding practices during the critical age of 6-23 months, was the National Complementary Feeding Assessment (NCFA) conducted in 2018 by United Nations Children Emergency Fund (UNICEF), Pakistan in collaboration with the Ministry of National Health Services, Regulations and Coordination, Pakistan18. This article provides output of secondary data analysis of the Cost of Diet (CoD) and Optifood component of NCFA along with Pakistan Demographic Health Survey (PDHS) 2018.
Methods
Data Source
The CoD Analysis involved determination of a nutritionally adequate diet for typical households including the cost and composition of three different types of diets, namely, Energy-Only (EO), Nutritious (NUT) and Food Habits Nutritious (FHAB) diets. It included data generated from 17 livelihood zones in 12 districts across four provinces (Baluchistan, Khyber Pakhtunkhwa (KPK) including the former Federally Administered Tribal Areas, now known as the tribal areas of KP, Punjab and Sindh] and three administrative regions [Azad Jammu and Kashmir (AJK), Gilgit-Baltistan (GB) and Islamabad Capital Territory (ICT)) of Pakistan. In that study, 102 villages were visited where weight and prices of foods available in the local markets where the poor purchase from were collected.
Optifood analysis was used to develop and compare food-based recommendations (FBRs) and identify problem nutrients in modelled diets based on 24-hour recall data about children aged 6–8 months, 9–11 months and 12–23 months. 1–2 livelihood zones within each selected district were identified, making a total of 17 zones in 12 districts. Six clusters were selected in each zone based on geographic distribution to ensure representative coverage. Within each cluster, nine mothers of children 6–8 months of age, nine of children 9–11 months of age and nine of children 12–23 months of age were interviewed. In all, 2,754 interviews were conducted. The databases or both CoD and OptiFood were obtained from UNICEF for further analysis i.e. correlation of CoD and Optifood with current status of complementary feeding parameters i.e. MDD, MMF and MAD.
The PDHS 2018 data was obtained from public domain for review and analysis19. PDHS collected information on more than 100000 households from all over Pakistan including all four provinces (Punjab, Sindh, Baluchistan and KPK) as well as federally administrative areas (ICT, AJK, and GB). It used a multi-staged stratified sampling design whereby Pakistan was divided into regions, which are political regions such as states or provinces. Within the provinces, populations were stratified by urban and rural area of residence. Within these stratified urban and rural areas, a random selection of survey areas was taken from the most recent population census. These primary sampling units (PSUs) were selected based on probability proportional to the population size. In the second stage of sampling, all households were listed within a cluster and randomly selected for an interview by equal-probability systematic sampling. Within each sampled household, the household members were listed and eligible women for a more detailed interview were identified.
Study Parameters
The overall annual average cost of foods from the seven groups as measured in CoD analysis was used for this analysis. The seasonal average cost of food was used for correlation. The annual cost of foods and seasonal cost from CoD datasets was correlated with the status of MMF, MDD and MAD according to the PDHS-2018 data. Average cost of diet was quantified from cost of individual components (flour, rice, porridge, milk etc.) of food groups and the routine dietary intake of the specific area that were collected from different shopkeepers. Provincial level correlation between CoD and PDHS 2018 was also conducted against MMF, MDD and MAD.
The Optifood data was correlated with complementary feeding status in terms of percentage of children eating each food item from various food groups mentioned in the regional results. For this analysis, the proportion of children consuming the food items were compared and correlated with complementary feeding status i.e. MDD, MMF and MAD. Moreover, by correlating the food groups of Optifood analysis and DHS data the continuity of findings in the specific regions and validation of findings of both datasets was done.
For this study we selected specific parameters of the PDHS 2018 data to be correlated with the outcome variables i.e. MDD, MMF and MAD. Information comprised of individual, household and community level parameters such as maternal age, paternal education, child gender, delivery status, employment status, socioeconomic status, residence and geographical region.
Statistical Analysis
For correlation of Optifood data and CoD data with PDHS data of CF, GraphPad software, MS Excel was used along with manual quantifications. The rates of different food groups in Optifood analysis were summed and averaged according to each group manually, e.g. food consumed by children in Punjab province was averaged according to each food group using standard formulae for averages. The annual cost of diet according to various districts of the geographical entities of Pakistan were measured. The cost spent on nutritious diet and Food habits (FHAB) nutritious diet was quantified & compared to check the trends of CF parameters. Nutritious diet meets the average energy and recommended intakes of protein, fat, vitamins, and minerals. FHAB nutritious diet meets the average energy and recommended intakes of protein, fat, vitamins, and minerals while considering typical food habits. Furthermore, the share in the annual income was measured according to socio-economic status in the districts. The annual income was summed and each socio-economic class’ annual income was divided with the sum to measure the share in annual income. The analysis of DHS-2018 data was conducted using STATA software. The data was weighted using standardized procedures and techniques. The study variables were recoded for comparisons. The outcome variable was coded as those having MDD = ‘1’, and those without MDD = ‘0’. This process was replicated for MMF and MAD parameters. For baseline level quantifications frequencies and percentages were calculated. Univariate analysis included comparison of categorical variables i.e. various individual, household and community level parameters with that of outcome variables of MDD, MMF and MAD using chi-square test. A probability level of <0.05 was considered statistically significant. The significant associations at univariate analysis were selected and put in a multi-level logistic regression model using stepwise backward exclusion method. This analysis was done using ‘svyset’ command in STATA. This also comprised of quantification of the final predictors of MDD, MMF and MAD using Adjusted Odds Ratios (AORs) and 95% Confidence Interval using “xi: svy: logistic” command.
Results
According to PDHS, the overall rate of MMF was 56.6% among children of 6-23 months of age with the MDD in 18.6% and MAD in 13.8% children. (Table 1)
Table 1. Baseline percentages of Minimum meal frequency, minimum dietary diversity, and minimal acceptable diet according to PDHS-2018| Number of cases | %age | |
| Minimum meal frequency | ||
| Yes | 2071 | 56.6% |
| No | 1587 | 43.4% |
| Minimum dietary diversity | ||
| Yes | 682 | 18.6% |
| No | 2976 | 81.3% |
| Minimal acceptable diet | ||
| Yes | 506 | 13.8% |
| No | 3152 | 86.1% |
As indicated in Table 2, the rates of MMF were significantly better in children of mothers between 20 and 34 years of age (57.8%), with maternal and paternal education of secondary or higher (64.4% and 59.6% respectively), with rich socioeconomic class (68.7%), urban residence (59.8%), mothers who had 4 or more antenatal visits (66.2%), who had health facility delivery (59.5%), who had first born children (61.1%) and those who had no previous birth interval (61.1%). No difference in the rates of MMF was seen with respect to mother’s marital status, employment status, child’s gender, and size at birth. Children from the geographical regions of FATA, Islamabad and KPK had significantly high MMF rates than children from Baluchistan and Sindh, whereas the correlations of various demographics were similar for MDD. However, it was noted that as compared to MMF, maternal age did not have any influence on MDD. Children of non-working mothers had better MDD (21.7%) along with those of female gender (20.5%) The rates of MDD were significantly high in the geographical regions of Islamabad, GB, AJK, and Punjab. When demographic associations were established with MAD, trends were found to similar with MMF.
Table 2. Distribution of individual, household, and community level parameters according to MMF, MDD and MAD| Study Parameters | Minimum meal frequency (MMF) | Minimum dietary diversity (MDD) | Minimally acceptable diet (MAD) | ||||||
|---|---|---|---|---|---|---|---|---|---|
| Overall MMF n (%) | No MMF | p-value | Overall MDD | No MDD | p-value | Overall MAD | No MAD | p-value | |
| Individual level | n (%) | n (%) | n (%) | n (%) | n (%) | ||||
| Maternal age (years) | |||||||||
| 15 to 19 | 94 (50.8%) | 91 (49.1%) | 31(16.7%) | 154(83.2%) | 22(11.89%) | 163(88.1%) | |||
| 20 to 34 | 1683 (57.8%) | 1226 (42.1%) | 0.01 | 544(18.7%) | 2365(81.3%) | 0.78 | 405(13.9%) | 2504(86.0%) | 0.73 |
| 35 to 49 | 294 (52.1%) | 270 (47.8%) | 107(18.9%) | 457(81.0%) | 79(14.0%) | 485(85.9%) | |||
| Maternal education | |||||||||
| No education | 918 (51.6%) | 861 (48.4%) | 234(13.1%) | 1545(86.8%) | 169(9.5%) | 1610(90.5%) | |||
| Primary | 241 (51.9%) | 223 (48.0%) | <0.001 | 58(12.5%) | 406(87.5%) | <0.001 | 43(9.2%) | 421(90.7%) | <0.001 |
| Secondary or above | 912 (64.4%) | 503 (35.5%) | 390(27.5%) | 1025(72.4%) | 294(20.7%) | 1121(79.2%) | |||
| Father’s education | |||||||||
| No education | 518 (51.4%) | 487 (48.4%) | 114(11.3%) | 891(88.6%) | 90(8.9%) | 915(91.0%) | |||
| Primary | 281 (53.8%) | 241 (46.1%) | <0.001 | 93(17.8%) | 429(82.1%) | <0.001 | 67(12.8%) | 455(87.1%) | <0.001 |
| Secondary or above | 1272 (59.6%) | 859 (40.3%) | 475(22.2%) | 1656(77.7%) | 349(16.3%) | 1782(83.6%) | |||
| Maternal marital status | |||||||||
| Currently married | 2052 (56.5%) | 1579 (43.4%) | 0.14 | 674 (18.5%) | 2957(81.4%) | 0.14 | 499(13.7%) | 3132(86.2%) | 0.06 |
| Formerly married | 19 (70.3%) | 8 (29.6%) | 8 (29.6%) | 19(70.3%) | 7(25.9%) | 20(74.0%) | |||
| Women working status | |||||||||
| Working women | 217 (55.6%) | 173 (44.3%) | 0.62 | 596(18.2%) | 2671(81.7%) | 0.02 | 65(16.7%) | 325(83.3%) | 0.01 |
| Non-working women | 1854 (56.7%) | 1414 (43.3%) | 85(21.7%) | 305(78.2%) | 440(13.7%) | 2827(86.5%) | |||
| Antenatal visits (n=3349) | |||||||||
| None | 243 (48.8%) | 255 (51.2%) | 596(18.2%) | 2671(81.6%) | 39(7.8%) | 459(92.1%) | |||
| 1-3 | 665 (56.3%) | 516 (43.6%) | <0.001 | 85(21.7%) | 305(78.2%) | <0.001 | 123(10.4%) | 1058(89.5%) | <0.001 |
| 4 or more | 1106 (66.2%) | 564 (33.7%) | 1(100.0%) | 0(0.0%) | 338(20.2%) | 1332(79.7%) | |||
| Place of delivery | |||||||||
| Home | 552 (49.7%) | 557 (50.2%) | <0.001 | 142(12.8%) | 968(87.2%) | <0.001 | 103(9.2%) | 1006(90.7%) | <0.001 |
| Health facility | 1519 (59.5%) | 1030 (40.4%) | 540(21.1%) | 2009(78.2%) | 403(15.8%) | 2146(84.1%) | |||
| Mode of delivery (n=3656) | |||||||||
| C-section | 457 (60.6%) | 296 (39.3%) | 0.04 | 189(25.1%) | 564(74.9%) | <0.001 | 141(18.7%) | 612(81.2%) | <0.001 |
| Non-cesarean | 1613 (55.5%) | 1290 (44.4%) | 493(16.9%) | 2410(83.2%) | 365(12.5%) | 2538(87.4%) | |||
| Delivery assistance (n=3615) | |||||||||
| Health professional | 1382 (59.1%) | 953 (40.8%) | 490(20.9%) | 1845(79.0%) | 359(15.3%) | 1976(84.6%) | |||
| Traditional birth attendant | 327 (48.8%) | 343 (51.1%) | <0.001 | 90(13.4%) | 580(86.5%) | <0.001 | 67(10.0%) | 603(90.0%) | 0.002 |
| Other untrained | 343 (56.2%) | 267 (43.7%) | 97(15.9%) | 513(84.1%) | 76(12.4%) | 534(87.4%) | |||
| Child sex | |||||||||
| Male | 1059 (56.2%) | 824 (43.7%) | 0.63 | 317(16.8%) | 1566(83.1%) | 0.004 | 247(13.1%) | 1636(86.8%) | 0.19 |
| Female | 1012 (57.0%) | 763 (42.9%) | 365(20.5%) | 1410(79.4%) | 259(14.5%) | 1515(85.4%) | |||
| Child age (mon) | |||||||||
| 6 to 8 | 316 (47.1%) | 354 (52.8%) | 40 (5.9%) | 630 (94.0%) | 37 (5.5%) | 633 (94.4%) | |||
| 9 to 11 | 263 (52.1%) | 241 (47.8%) | <0.001 | 68 (13.5%) | 436 (86.5%) | <0.001 | 55 (10.9%) | 449 (89.1%) | <0.001 |
| 12 to 17 | 830 (59.8%) | 557 (40.1%) | 303 (21.8%) | 1084 (78.1%) | 236 (17.0%) | 1151 (82.9%) | |||
| 18 to 23 | 662 (60.3%) | 435 (39.6%) | 271 (24.7%) | 826 (75.3%) | 178 (16.2%) | 919 (83.7%) | |||
| Size of baby at birth (n=3644) | |||||||||
| Large | 155 (56.1%) | 121 (43.8%) | 61(22.1%) | 215(77.9%) | 43(15.5%) | 233 (84.4%) | |||
| Average | 1525 (57.8%) | 1110 (42.1%) | 0.05 | 501(19.0%) | 2134(80.9%) | 0.12 | 378(14.3%) | 2527 (85.6%) | 0.15 |
| Small | 385 (52.5%) | 348 (47.4%) | 118(16.1%) | 615(83.9%) | 84(11.4%) | 649 (88.54%) | |||
| Birth order | |||||||||
| First | 533 (61.1%) | 339 (38.8%) | 194(22.2%) | 678(77.7%s) | 136(15.6%) | 736 (84.0%) | |||
| 2-4 | 1096 (56.8%) | 833 (43.1%) | <0.001 | 360(18.6%) | 1569(81.3%) | <0.001 | 270(14.0%) | 1659 (86.0%) | 0.05 |
| 5 or more | 442 (51.5%) | 415 (48.4%) | 128(14.9%) | 729(85.0%) | 100(11.6%) | 757 (88.3%) | |||
| Birth interval (mon) (n=3647) | |||||||||
| No previous birth | 533 (61.1%) | 339 (38.8%) | 194(22.2%) | 678(77.7%) | 136(15.6%) | 738 (84.4%) | |||
| Less than 24 | 537 (56.0%) | 421 (43.9%) | 0.01 | 173(18.0%) | 785(81.9%) | 0.01 | 135(14.0%) | 823 (85.9%) | 0.27 |
| More than 24 | 995 (54.7%) | 822 (45.2%) | 313(17.2%) | 1504(82.7%) | 234(12.8%) | 1583 (87.1%) | |||
| Household level | |||||||||
| Socio economic status | |||||||||
| Poorest | 365 (46.2%) | 425 (53.8%) | 68(8.6%) | 722(91.3%) | 53 (5.7%) | 737 (93.2%) | |||
| Poorer | 418 (51.2%) | 398 (48.7%) | 110(13.4%) | 706(86.2%) | 79 (9.6%) | 737 (90.3%) | |||
| Middle | 439(57.9%) | 319(42.0%) | <0.001 | 142(18.7%) | 616(81.2%) | <0.001 | 100 (13.1%) | 658 (86.8%) | <0.001 |
| Richer | 384(62.3%) | 232(37.6%) | 151(24.5%) | 465(75.4%) | 107 (17.3%) | 509 (82.6%) | |||
| Richest | 465(68.5%) | 213(31.4%) | 211(31.1%) | 467(68.8%) | 167 (24.6%) | 511 (75.3%) | |||
| Community level | |||||||||
| Residence | |||||||||
| Urban | 979(59.8%) | 658(40.2%) | <0.001 | 363(22.1%) | 1274(77.8%) | <0.001 | 265 (16.1%) | 1372 (83.8%) | <0.001 |
| Rural | 1092(54.0%) | 929(45.9%) | 319(15.7%) | 1702(84.2%) | 241 (11.9%) | 1780 (88.0%) | |||
| Geographical region | |||||||||
| Punjab | 438 (54.5%) | 365 (45.4%) | 168 (20.9) | 635 (79.0%) | 117 (14.5%) | 686 (85.4%) | |||
| Sindh | 321 (52.8%) | 286 (47.1%) | 83 (13.6%) | 524 (86.3%) | 57 (9.3%) | 550 (90.6%) | |||
| KPK | 392 (62.9%) | 231 (37.0%) | <0.001 | 109 (17.5%) | 514 (82.5%) | <0.001 | 85 (13.6%) | 538 (86.3%) | <0.001 |
| Baluchistan | 198 (48.0%) | 214 (51.9%) | 48 (11.6%) | 364 (88.3%) | 33 (8.0%) | 379 (91.9%) | |||
| Gilgit Baltistan | 149 (57.9%) | 108 (42.0%) | 70 (27.2%) | 187 (72.7%) | 56(21.7%) | 201(78.2%) | |||
| Islamabad (ICT) | 158 (62.7%) | 94 (37.3%) | 77 (30.5%) | 175 (69.4%) | 63(25.0%) | 189(75.0%) | |||
| AJK | 229 (55.0%) | 187 (44.9%) | 106 (25.4%) | 310 (74.5%) | 75(18.7%) | 338(81.2%) | |||
| FATA | 186 (64.5%) | 102 (35.4%) | 21 (7.2%) | 267 (92.7%) | 17 (5.9%) | 271 (94.1%) | |||
Essential micronutrients were lacking in the baseline diet for all target groups. A relatively large number of nutrients were identified as problem nutrients within all target groups, with average of 54–69% per age group. The main identified problem nutrients were iron, zinc, folate, calcium, and vitamins A, B1, B3 and B6. The best FBRs for every target group often included eggs, dairy products, grains, and cereals based on the habitual diets leading to nutrient adequacy for calcium and vitamins B1, B3 and B6. However, nutrient adequacy was usually not reached in all age groups for vitamin A, iron, zinc and in children aged 12–23 months for folate. Demonstrate the analysis of various food groups consumption according to different age groups across different provinces and other geographical entities in Pakistan within Optifood datasets. The difference in the percentages between OptiFood and PDHS was found due to the methodology and sampling techniques applied across the two studies. It was found that all target groups consumed a small number of food items with an average of 16–22 different food items per target group. Children aged 6–8 months and 9–11 months often consumed infant milk and cereals, while children aged 12–23 months often consumed eggs and grain products. In terms of the serving sizes, the food items within groups of added fats, sweetened snacks and desserts and vegetables were less than 10g/day and that of dairy products averaged 220g/day. Serving sizes for grains and grain products varied considerably from a few grams per meal up to 250 g/meal.
Consumption of dairy products was highest in Punjab, Sindh, AJK, and Islamabad, that of grains roots and tubers was highest in KPK, FATA and GB. Vitamin A rich fruits consumption was highest in GB, Sindh and KPK whereas apart from GB and KPK, consumption of other fruits and vegetables was highest in AJK and FATA. Eggs consumption by children in Punjab, Islamabad and FATA was better as compared to other regions whereas that of meat, poultry and shellfish was better in AJK, Islamabad, Sindh, and GB. Additionally, children within KPK, GB and Islamabad consumed more Legumes and Nuts as compared to others. (Table 3 ,Table 4,Table 5,Table 6,Table 7,Table 8, Table 9, Table 10)
Table 3. Food consumption according to age groups in Punjab region according to PDHS-2018 and Opti food analysis| 6-8 months | 9-11 months | 12-23 months | ||||
| PDHS-2018 (%) | Optifood analysis (%) | PDHS-2018 (%) | Optifood analysis (%) | PDHS-2018 (%) | Optifood analysis (%) | |
| Dairy products/formula milk | 60.2% | 18.0% | 65.2% | 29.6% | 69.4% | 27.0% |
| Grains, roots, tubers, and plantations | 41.9% | 14.0% | 55.7% | 27.4% | 71.5% | 35.0% |
| Vitamin A rich fruits & vegetables | 3.7% | 27.0% | 5.2% | 28.0% | 16.1% | 14.5% |
| Other fruits & vegetables | 13.2% | - | 15.7% | 23.6% | 31.4% | 35.6% |
| Protein diet (eggs) | 22.8% | 52.0% | 28.4% | 41.0% | 33.7% | 43.0% |
| Meat, poultry, fish & shellfish | 2.2% | - | 4.2% | 10.0% | 13.4% | 0.0% |
| Legumes and nuts | 2.2% | - | 4.2% | 16.0% | 5.7% | 10.0% |
| 6-8 months | 9-11 months | 12-23 months | ||||
| PDHS-2018 (%) | Optifood analysis (%) | PDHS-2018 (%) | Optifood analysis (%) | PDHS-2018 (%) | Optifood analysis (%) | |
| Dairy products/formula milk | 31.4% | 22.0% | 43.3% | 31.6% | 41.0% | 35.6% |
| Grains, roots, tubers, and plantations | 48.5% | 15.0% | 73.4% | 48.3% | 78.5% | 64.3% |
| Vitamin A rich fruits & vegetables | 4.7% | 20.0% | 22.8% | 22.0% | 25.3% | - |
| Other fruits & vegetables | 4.7% | 12.0% | 15.6% | 42.0% | 19.3% | 60.0% |
| Protein diet (eggs) | 11.4% | - | 19.2% | - | 23.1% | - |
| Meat, poultry, fish & shellfish | 3.8% | - | 16.8% | - | 18.1% | - |
| Legumes and nuts | 3.8% | - | 2.4% | 24.0% | 8.3% | 31.0% |
| 6-8 months | 9-11 months | 12-23 months | ||||
| PDHS-2018 (%) | Optifood analysis (%) | PDHS-2018 (%) | Optifood analysis (%) | PDHS-2018 (%) | Optifood analysis (%) | |
| Dairy products/formula milk | 34.2% | 14.0% | 29.5% | 21.0% | 39.1% | 20.0% |
| Grains, roots, tubers, and plantations | 64.9% | 23.5% | 84.1% | 35.5% | 84.1% | 47.0% |
| Vitamin A rich fruits & vegetables | 7.0% | 10.0% | 17.0% | 19.0% | 19.0% | 19.5% |
| Other fruits & vegetables | 12.2% | 22.0% | 27.2% | 52.0% | 34.6% | 67.0% |
| Protein diet (eggs) | 13.1% | 14.0% | 20.4% | 40.0% | 31.1% | 34.0% |
| Meat, poultry, fish & shellfish | 1.7% | 12.0% | 7.9% | 8.5% | 15.4% | 10.0% |
| Legumes and nuts | 4.3% | - | 12.5% | 21.0% | 14.2% | 7.0% |
| 6-8 months | 9-11 months | 12-23 months | ||||
| PDHS-2018 (%) | Optifood analysis (%) | PDHS-2018 (%) | Optifood analysis (%) | PDHS-2018 (%) | Optifood analysis (%) | |
| Dairy products/formula milk | 27.3% | 11.2% | 41.0% | 16.0% | 39.8% | 14.2% |
| Grains, roots, tubers, and plantations | 45.2% | 16.6% | 57.1% | 30.0% | 77.0% | 41.5% |
| Vitamin A rich fruits & vegetables | 4.2% | - | 7.1% | 7.0% | 18.7% | 13.0% |
| Other fruits & vegetables | 9.4% | 17.0% | 17.8% | 24.0% | 32.5% | 59.7% |
| Protein diet (eggs) | 6.3% | - | 16.0% | - | 24.1% | - |
| Meat, poultry, fish & shellfish | 2.1% | - | 0.0% | - | 18.7% | - |
| Legumes and nuts | 1.0% | - | 0.0% | 16.0% | 3.4% | - |
| 6-8 months | 9-11 months | 12-23 months | ||||
| PDHS-2018 (%) | Optifood analysis (%) | PDHS-2018 (%) | Optifood analysis (%) | PDHS-2018 (%) | Optifood analysis (%) | |
| Dairy products/formula milk | 32.7% | 11.2% | 67.6% | 16.0% | 43.4% | 14.2% |
| Grains, roots, tubers, and plantations | 43.6% | 37.0% | 79.4% | 60.0% | 73.2% | 51.5% |
| Vitamin A rich fruits & vegetables | 5.4% | 29.0% | 29.4% | 7.0% | 27.3% | 25.5% |
| Other fruits & vegetables | 18.1% | 46.5% | 32.3% | 69.0% | 33.9% | 81.0% |
| Protein diet (eggs) | 10.9% | - | 29.4% | 15.0% | 30.9% | 14.0% |
| Meat, poultry, fish & shellfish | 3.6% | - | 11.7% | - | 27.3% | - |
| Legumes and nuts | 3.6% | - | 5.8% | - | 14.8% | - |
| 6-8 months | 9-11 months | 12-23 months | ||||
| PDHS-2018 (%) | Optifood analysis (%) | PDHS-2018 (%) | Optifood analysis (%) | PDHS-2018 (%) | Optifood analysis (%) | |
| Dairy products/formula milk | 46.6% | 23.5% | 58.5% | 22.0% | 64.4% | 26.0% |
| Grains, roots, tubers, and plantations | 62.2% | 17.0% | 73.1% | 39.3% | 75.3% | 53.7% |
| Vitamin A rich fruits & vegetables | 4.4% | 20.5% | 7.3% | 15.5% | 16.8% | 21.0% |
| Other fruits & vegetables | 8.9% | 23.0% | 39.0% | 39.0% | 47.5% | 65.5% |
| Protein diet (eggs) | 26.6% | 17.0% | 34.1% | 30.0% | 41.5% | 31.0% |
| Meat, poultry, fish & shellfish | 6.6% | - | 7.3% | 12.0% | 20.5% | 11.0% |
| Legumes and nuts | 4.4% | 6.0% | 4.8% | 10.0% | 15.1% | 7.5% |
| 6-8 months | 9-11 months | 12-23 months | ||||
| PDHS-2018 (%) | Optifood analysis (%) | PDHS-2018 (%) | Optifood analysis (%) | PDHS-2018 (%) | Optifood analysis (%) | |
| Dairy products/formula milk | 56.5% | 22.5% | 52.3% | 31.3% | 58.8% | 51.5% |
| Grains, roots, tubers, and plantations | 46.3% | 7.5% | 79.3% | 22.5% | 79.5% | 46.0% |
| Vitamin A rich fruits & vegetables | 4.3% | 6.0% | 14.2% | 13.0% | 17.6% | 13.0% |
| Other fruits & vegetables | 14.4% | 6.0% | 33.3% | 19.0% | 45.7% | 57.5% |
| Protein diet (eggs) | 11.5% | 15.0% | 33.3% | 11.0% | 36.6% | - |
| Meat, poultry, fish & shellfish | 4.3% | - | 17.4% | - | 17.2% | - |
| Legumes and nuts | 2.9% | - | 4.7% | 13.0% | 11.3% | - |
| 6-8 months | 9-11 months | 12-23 months | ||||
| PDHS-2018 (%) | Optifood analysis (%) | PDHS-2018 (%) | Optifood analysis (%) | PDHS-2018 (%) | Optifood analysis (%) | |
| Dairy products/formula milk | 25.5% | 18.7% | 40.9% | 21.0% | 31.1% | 29.5% |
| Grains, roots, tubers, and plantations | 58.8% | 23.7% | 88.6% | 43.0% | 93.2% | 47.0% |
| Vitamin A rich fruits & vegetables | 5.8% | - | 4.5% | - | 19.6% | - |
| Other fruits & vegetables | 9.8% | 22.0% | 13.4% | 52.0% | 26.9% | 77.0% |
| Protein diet (eggs) | 11.6% | 14.0% | 33.3% | 40.0% | 36.6% | 34.0% |
| Meat, poultry, fish & shellfish | 0.0% | 12.0% | 2.3% | 13.5% | 10.3% | 15.0% |
| Legumes and nuts | - | 21.0% | 7.0% | |||
| PDHS-2018 (%) | Average annual income (Rs.) | Annual Cost of Nutritious diet (Rs.) | % spent on nutritious diet | Annual cost of FHAB diet (Rs.) | % spent on FHAB diet | |
| Minimum meal frequency | ||||||
| Punjab | 54.50 | 397697 | 121699 | 30.60 | 183517 | 46.14 |
| Sindh | 52.80 | 397697 | 110813 | 27.86 | 177561 | 44.65 |
| KPK | 62.90 | 397697 | 119394 | 30.02 | 168166 | 42.28 |
| Baluchistan | 48.10 | 397697 | 113342 | 28.50 | 162009 | 40.74 |
| Gilgit Baltistan | 57.90 | 397697 | 113892 | 28.64 | 161190 | 40.53 |
| ICT | 62.70 | 420072 | 128540 | 30.60 | 190533 | 45.36 |
| AJK | 55.00 | 397697 | 171341 | 43.08 | 212205 | 53.36 |
| FATA | 64.60 | 397697 | 113676 | 28.58 | 178195 | 44.81 |
| Minimum dietary diversity | ||||||
| Punjab | 20.90 | 397697 | 121699 | 30.60 | 183517 | 46.14 |
| Sindh | 13.60 | 397697 | 110813 | 27.86 | 177561 | 44.65 |
| KPK | 17.50 | 397697 | 119394 | 30.02 | 168166 | 42.28 |
| Baluchistan | 11.60 | 397697 | 113342 | 28.50 | 162009 | 40.74 |
| Gilgit Baltistan | 27.20 | 397697 | 113892 | 28.64 | 161190 | 40.53 |
| ICT | 30.50 | 420072 | 128540 | 30.60 | 190533 | 45.36 |
| AJK | 25.50 | 397697 | 171341 | 43.08 | 212205 | 53.36 |
| FATA | 7.30 | 397697 | 113676 | 28.58 | 178195 | 44.81 |
| Minimal acceptable diet | ||||||
| Punjab | 14.60 | 397697 | 121699 | 30.60 | 183517 | 46.14 |
| Sindh | 9.40 | 397697 | 110813 | 27.86 | 177561 | 44.65 |
| KPK | 13.60 | 397697 | 119394 | 30.02 | 168166 | 42.28 |
| Baluchistan | 8.00 | 397697 | 113342 | 28.50 | 162009 | 40.74 |
| Gilgit Baltistan | 21.70 | 397697 | 113892 | 28.64 | 161190 | 40.53 |
| ICT | 25.00 | 420072 | 128540 | 30.60 | 190533 | 45.36 |
| AJK | 18.70 | 397697 | 171341 | 43.08 | 212205 | 53.36 |
| FATA | 5.90 | 397697 | 113676 | 28.58 | 178195 | 44.81 |
A linear trend of rates of MMF, MAD and MDD and CoD were observed, however, these could not be proven statistically. The proportion wise rates of cost of nutritious and FHAB diet are compared in table 11. These trends have also been proven by graphical presentation, which can be seen in Figure 1, Figure 2, Figure 3. In case of a nutritious diet, millet and wheat flour (whole, local or hyv) was found as an inexpensive and rich source of protein, vitamin B1, niacin, vitamin B6, iron and zinc whereas Ghee (cow) was found as an inexpensive source of fat and vitamin A. In case of a Food habits nutritious diet (FHAB) wheat flour (brown) was found to be an important source of protein, energy, vitamin B1, niacin, vitamin B6, iron and zinc. Dairy products i.e. whole cow milk was found an important source of protein, vitamins B2 and B12 and calcium; spinach an important source of vitamin A, vitamin C and folic acid; vegetable ghee an important source of fat and egg is an important source of vitamin A, vitamin B2, vitamin B12 and iron. Staple foods i.e. grain and grain-based products, followed by dairy products, are the costliest elements of the FHAB diet because these foods were included in the diet in large quantities to meet nutrient targets and therefore contribute the most to its cost while being the least expensive. Households thus rely on these staple foods to provide most of their caloric and nutritional needs. However, the FHAB diet is over three to five times more expensive than a diet that only meets energy requirements. Thus, economic constraints and cultural practices are exacerbating poor dietary diversity.
The trends of CF parameters were also found to have a linear trend with the share in the annual cost of diet on the basis of their socioeconomic (SEC) status with more cost spent as the SEC status improves. The trends are presented in Figure 4, Figure 5, Figure 6.
Figure 1.Trends of MMF and cost of diet spent according to geographical regions
Figure 2.Trends of MDD and cost of diet spent according to geographical regions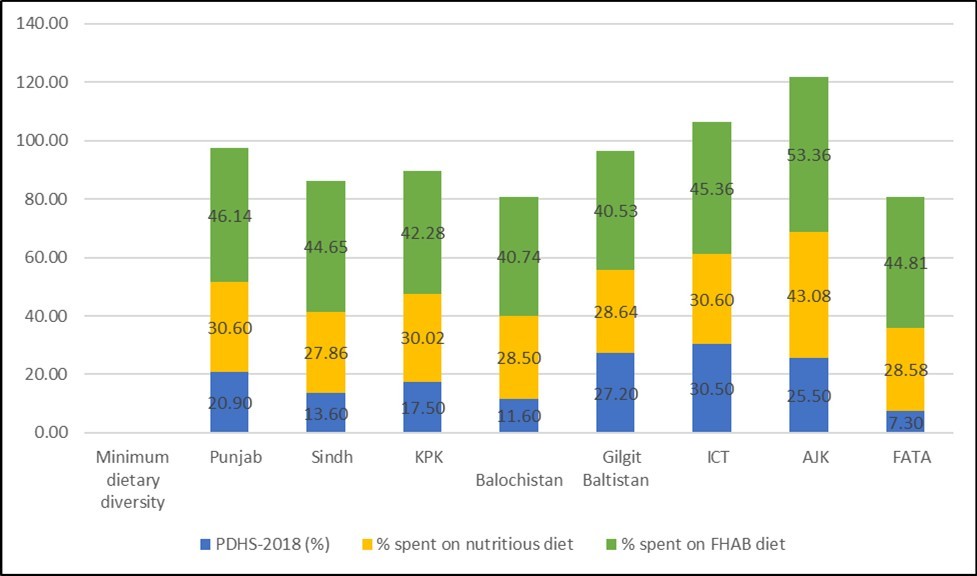
Figure 3.Trends of MAD and cost of diet spent according to geographical regions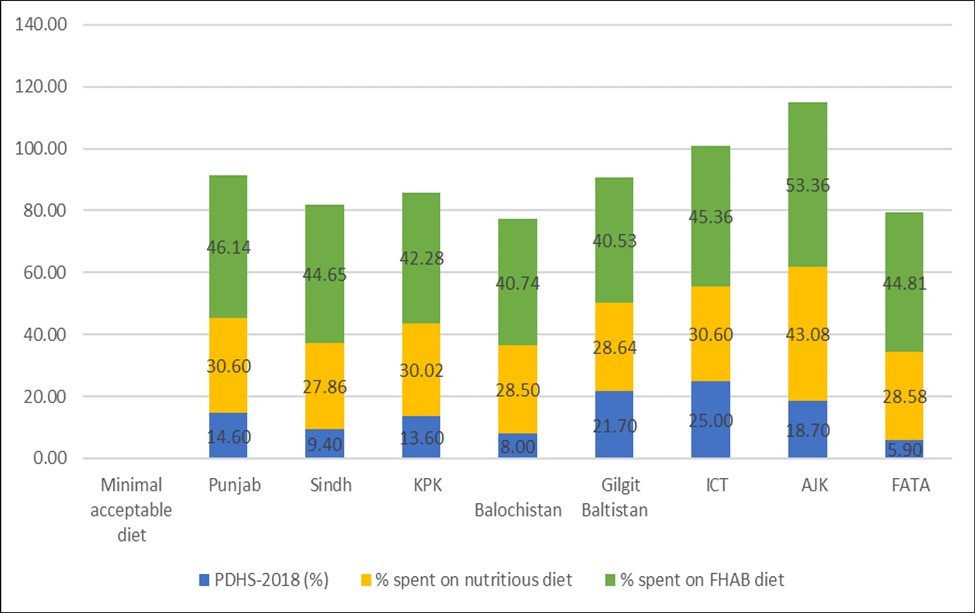
Figure 4.Trends of MMF and cost of diet spent according to socioeconomic status
Figure 5.Trends of MDD and cost of diet spent according to socioeconomic status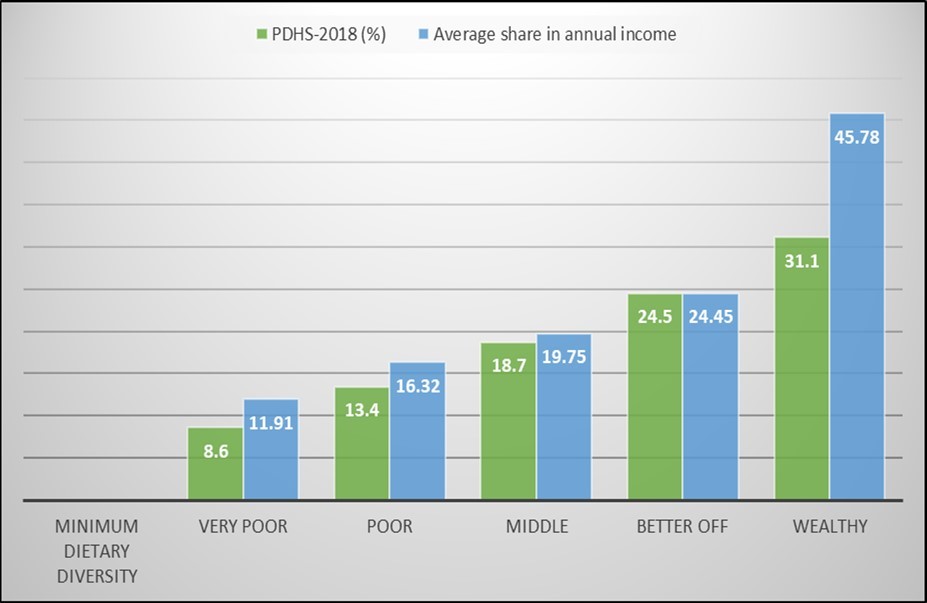
Figure 6.Trends of MAD and cost of diet spent according to socioeconomic status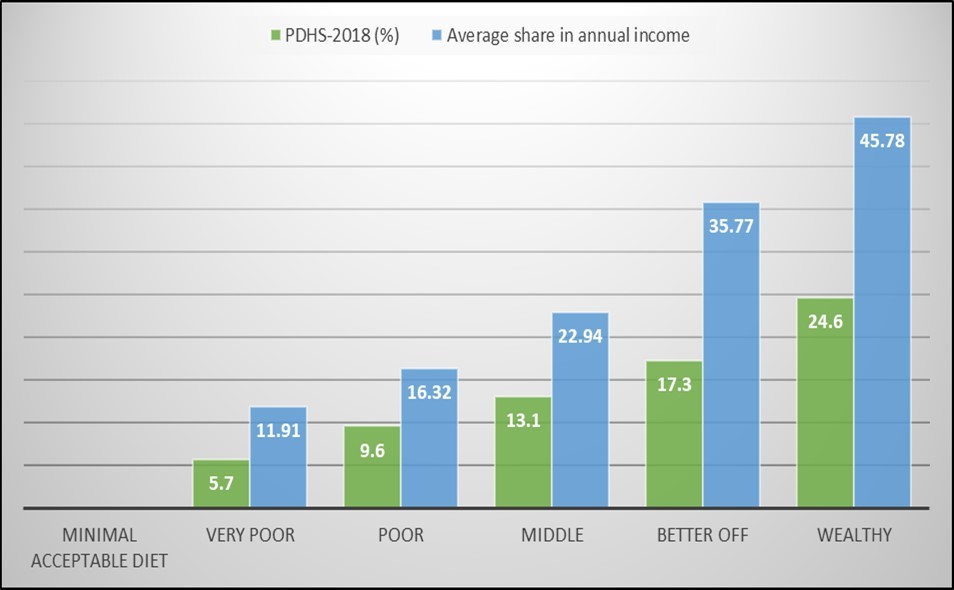
Discussion
Our results show that there is an overall need to increase the rates of MMF, MDD and MAD in Pakistani children between 6 and 23 months of age. Approaching this issue through both a communication and non-communication perspective can be useful. Adequate communication can cater the decreased level of maternal and paternal education and promotion of adequate MDD, MAD and MMF by improving behavior change. Behavior change is a change in specific behavioral patterns through a ‘coordinated set of activities. For choosing the appropriate behavior change models, there are multiple frameworks which have been used one of which is the Behavior Change Wheel (BCW) which recognizes that the target behavior arises from combinations of any of the components of the behavior system (capability, motivation and opportunity)20. Considering ghee (cow) and wheat flour (whole, brown) are good sources of macro- and micronutrients at minimum cost but not frequently consumed, promotion of their frequent consumption through social and behavioral change communication strategies is necessary. It is also important to emphasize in such strategies that pregnant and lactating mothers require special attention by increasing the amount, frequency and variety of foods. Additionally, given a significant nutritional contribution of breastmilk to a child aged 12–23 months in terms of energy, protein, vitamins and minerals, continuation of breastfeeding to two years, with appropriate complementary feeding, should also be promoted.
Non communication perspective can cater the low socio-economic status. Promoting the self-production of selected crops (such as wheat), vegetables (such as onions, spinach and fenugreek), livestock (buffalo and goat for milk; poultry for eggs) can help improve quality, composition and affordability of a nutritious diet. Social protection schemes should be scaled up to improve affordability of a nutritious diet with specific activities determined on the basis of district-specific household economic studies. The income gap could be filled through cash transfers, food vouchers, cash for work programmes or income-generating activities. In addition, nutrition-sensitive agricultural activities should be implemented alongside social protection schemes to improve dietary diversity. Focus of maternal and child interventions on first 1000 days of a child’s life (Conception to 2 years) can help in improving malnutrition in general. Maternal micronutrient supplements must be part of a comprehensive package of interventions. Family size also plays an important role in reducing CoD, therefore, addressing unmet family planning needs using modern contraceptive methods will have nutritional implications by reducing the cost and improving the quality and composition of foods consumed by the household.
Multiple problem nutrients exist in the diet of children aged 6–23 months in Pakistan. Optimizing the diet may help to reach nutrient adequacy for most problem nutrients such as are calcium, vitamins B1, B3 and B6, and folate. Eggs, dairy products, milk products, grains, roti and cereals have been identified as key Food Based Recommendations (FBRs). It is, however, recommended to test the feasibility of selected FBRs locally, for example with local nutritionists and mothers. Lessons from LMICs, show that for infants and young children, provision of thick porridge made of maize, or millet to which milk, soy, ground nuts, or sugar is added; or mixtures of pureed foods made out of potatoes, maize, millet, or rice, being mixed with fish, beans or pounded groundnuts, and green vegetables added would allow consumption of nutritious foods. Addition of nutritious snacks, such as egg, banana, bread, papaya, other fruits, yogurt, milk, and puddings made with milk, chapatti with ghee, honey, and cooked potatoes, would suffice their nutritional needs22. Within Pakistani context, Sorghum, millet, guava (green) and fish (rohu, river, raw) have also been identified as cheap, nutritious, and easily available options that rarely form part of the customary diet and should be promoted.
For absolute problem nutrients (Vitamin A, iron, folate and zinc), it is recommended to consider investigating and introducing nonfood supplementation programmes. Zimbabwe and Malawi has shown that supplementation of food with nutrients has been very useful in improving MDD, e.g., use of lipid‐based nutrient supplements (LiNS) is more beneficial than micronutrient supplementation. LiNS can be easily developed using local ingredients, do not require expensive extrusion technologies and is resistant to microbial growth and oxidation due to a low water activity21.
The strengths of this study are that it was conducted as a nationwide assessment using three different datasets (Optifood, CoD and PDHS) giving a holistic picture in terms of demographics, cost of nutrition and consumption of different types of food across different age groups within Pakistan. Thus, it can assist in developing context specific recommendations for improving CF practices within Pakistan. The main limitations of the study were that individual context of Demographic and Health Survey and that of Optifood and Cost of Diet Analysis were altogether different. Additionally, the tools for data collection were distinctive, so these could not be combined completely to obtain correlation of outcomes of MMD, MMF and MAD. The correlation, thus, could only be reached at aggregate level findings whereby the overall rates of MMD, MMF and MAD were correlated according to geographical regions and demographic characteristics.
Conclusion
Considering CF practices in Pakistan are inadequate as indicated by poor MDD, MMF, and MAD, therefore it is imperative that a holistic approach using both communication and non-communication aspects is to be employed through active stakeholder engagement.
Acknowledgments
We are grateful to Julie Peletier for facilitating us on providing coding sheets of data of Optifood Analysis and Mesfin Beyero, for providing the datasets of CoD.
Ethics Approval
Ethics approval was as provided by the ethics review board of International Research Force (Reference no IRF-21-03/UNICEF-02).
Funding
Funding for this analysis was provided by UNICEF Pakistan.
Authorship Contributions
HM, EAE and SS conceived the idea for this work, which was developed with the support of WK and SYS. SA conducted statistical analysis and HM provided feedback. HM, SA, and SYS wrote the first draft, and all other authors contributed to the manuscript.
References
- 1.Ma’alin A, Birhanu D, Melaku S, Tolossa D, Mohammed Y et al. (2016) Magnitude and factors associated with malnutrition in children 6–59 months of age in Shinille Woreda, Ethiopian Somali regional state: a cross-sectional study. , BMC Nutrition 2(1), 44.
- 2.R E Black, C G Victora, S P Walker, Z A Bhutta, Christian P et al. (2013) Maternal and child undernutrition and overweight in low-income and middle-income countries. , The lancet 382(9890), 427-451.
- 3.V J Martins, Florêncio Toledo, M T, L P Grillo, Carmo Do et al. (2011) Long-lasting effects of undernutrition. International journal of environmental research and public health. 8(6), 1817-1846.
- 4.Tzioumis E, M C Kay, M E Bentley, L S Adair. (2016) Prevalence and trends in the childhood dual burden of malnutrition in low-and middle-income countries, 1990–2012. Public health nutrition. 19(8), 1375-1388.
- 5.Aheto J M K, T J Keegan, B M Taylor, P J Diggle. (2015) Childhood malnutrition and its determinants among under-five children in Ghana. , Matern Child Nutr 29, 552-561.
- 6.Saeed W, Davies S, Shahzad S, M.S Moeen. (2018) Costs of undernutrition in Pakistan. Intl Food Policy Res Inst. 2, 1.
- 7.WHO UNICEF, Bank World. (2020) Levels and trends in child malnutrition;. , UNICEF / WHO / World Bank Group Joint
- 8. (2019) Nutrition Wing, Ministry of National Health Services, Regulations and Coordination. National Nutrition Survey; Key Findings Report.
- 9.Derso T, Tariku A, G A Biks, M. (2017) Stunting, wasting and associated factors among children aged 6–24 months in Dabat health and demographic surveillance system site: A community based cross-sectional study in Ethiopia. , BMC pediatrics 17(1), 96.
- 10.World Health Organization. (2019) Appropriate complementary feeding. Available at:https://www.who.int/elena/titles/complementary_feeding/en/.
- 11.UNICEF. (2017) Percentage of children aged 6-23 months in low- and lower-middle-income countries fed with a minimum meal frequency, minimum diet diversity and minimum acceptable diet. Available at:https://data.unicef.org/wpcontent/uploads/infograms/10185/index.html
- 12.Manikam L, Sharmila A, Dharmaratnam A, E C Alexander, J Y Kuah et al. (2018) Systematic review of infant and young child complementary feeding practices in South Asian families: the Pakistan perspective. , Public Health Nutrition 21(4), 655-668.
- 13.Khokhar S, Jatoi H, Lassi Z. (2017) Prevalence of timely introduction of complementary feeding and its related factors in children 6-24 months of age. in Hyderabad, Pakistan. Nursing and Midwifery Studies 6(3), 115-120.
- 14.Na M, V M Aguayo, Arimond M, C P Stewart. (2017) Risk factors of poor complementary feeding practices in Pakistani children aged 6–23 months: A multilevel analysis of the Demographic and Health Survey 2012–2013. , Maternal & Child Nutrition 13, 12463.
- 15.G N Khan, Ariff S, Khan U, Habib A, Umer M et al. (2017) Determinants of infant and young child feeding practices by mothers in two rural districts of Sindh, Pakistan: a cross-sectional survey. International breastfeeding journal. 12(1), 40.
- 16.Dad F, Habib I. (2017) Mother’s knowledge, attitude, and practices (KAP) regarding complementary feeding for children age 06-24 months in Kurrum Agency of FATA Pakistan. , J Prev Med Public Health 3, 33-42.
- 17.Kim R, Mejia-Guevara I, D J Corsi, V M Aguayo, S V. (2017) Relative importance of 13 correlates of child stunting in South Asia: Insights from nationally representative data from Afghanistan. , Bangladesh, India, Nepal, and Pakistan, Social Science & Medicine 187, 144-154.
- 18.Times Technology. (2018) National Complementary Feeding Assessment Study Launched. Available at:https://www.technologytimes.pk/2018/09/14/national-complementary-feeding-assessment/.
- 20.Michie S, Van Stralen MM, West R. (2011) The behaviour change wheel: a new method for characterizing and designing behaviour change interventions. Implementation science. 6(1), 42.
- 21.M A Abeshu, Lelisa A, Geleta B. (2016) Complementary feeding: review of recommendations, feeding practices, and adequacy of homemade complementary food preparations in developing countries–lessons from Ethiopia. Frontiers in nutrition. 3, 41.
- 22.K H Paul, Muti M, Chasekwa B, N Madzima Mbuya M, C R Humphrey et al. (2012) Complementary feeding messages that target cultural barriers enhance both the use of lipid‐based nutrient supplements and underlying feeding practices to improve infant diets in rural Zimbabwe. , Maternal & child nutrition 8(2), 225-238.