
Rate Pressure Product Responses during an Acute Session of Isometric Resistance Training: A Randomized Trial
Abstract
Hypertension is a major modifiable risk factor for cardiovascular disease, responsible for approximately 31% of global mortality. The aim of this study was to examine the hypertensive responses and determine the peak rate pressure product, calculated by multiplying systolic blood pressure and heart rate, during isometric handgrip exercise.
Rate pressure product is a surrogate measure of myocardial oxygen consumption. Hypertensive responses utilising rate pressure product during isometric handgrip exercise have not previously been reported.
A randomized trial was conducted with 60 normotensive and 60 pre-hypertensive participants who attended once for an acute session of isometric handgrip exercise. Participants were randomized into groups exercising at 5%, 10% or 30% of their maximum voluntary contraction. Training was conducted using 4x2min isometric handgrip exercises each separated by a 3min rest period.
There were no significant differences between peak systolic and diastolic blood pressure, mean arterial pressure, heart rate and rate pressure product across the four bouts of isometric handgrip exercise in all groups, all p>.05. Peak increases in rate pressure product were significantly higher than baseline at all intensities assessed; all normotensive groups p<.02, all pre-hypertensive groups p≤.001. Increases were relative to baseline blood pressure status and intensity of isometric handgrip exercise, with no significant differences between normotensive and pre-hypertensive groups.
Rate pressure product responses to isometric handgrip exercise indicate that it may be a safe alternative for people unable to perform recommended levels of aerobic exercise for blood pressure management.
Article Information
- Received
- Accepted
- Published
Academic Editor: Hatori Nobuo, Director, Kobayashi Hospital
Checked for plagiarism: Yes
Review by: Single-blind
Copyright © 2017 Debra J. Carlson, et al
 This is an open-access article distributed under the terms of the Creative Commons Attribution License, which permits unrestricted use, distribution, and reproduction in any medium, provided the original author and source are credited.
Corresponding author: Neil Smart, School of Science and Technology, University of New England, Armidale, NSW, 2351, Australia —
Competing Interests
The authors have declared that no competing interests exist.
Funding
No specific funding statement was provided by the authors.
Data Availability
No data-availability statement was provided by the authors.
Acknowledgements
Exercise Physiology Department, School of Science and Technology, University of New England.
Citation:
Introduction
Cardiovascular disease remains the leading cause of death, representing approximately 31% of global mortality.1 The most common modifiable risk factor for cardiovascular disease is hypertension, which contributes to approximately 50% of adverse outcomes in the US, including myocardial infarction and heart failure.2 Current exercise recommendations from the American Heart Association to aid in controlling hypertension are a minimum 30 minutes per day, at least 5 days per week, of physical activity.3
A series of recent analyses have shown that isometric resistance training (IRT) can be effective in producing significant blood pressure lowering effects.4, 5, 6, 7 Concerns over hypertensive responses during IRT mean some health professionals remain reluctant to recommend IRT. Consequently, moderate and vigorous aerobic exercise combined with resistance training remains the preferred exercise prescription to manage hypertension.8 Cardiovascular responses during resistance training are relative to intensity, number of repetitions, rest intervals and the duration of muscle recruitment.9 Aerobic exercise increases systolic blood pressure (SBP) and heart rate (HR), and consequently myocardial oxygen consumption, relative to the intensity and duration of the exercise.10
Rate pressure product (RPP), calculated by multiplying SBP and HR, is a valid non-invasive surrogate measure of myocardial oxygen consumption.11, 12 Coronary blood flow, cardiac workload and left ventricular hypertrophy have also been found to be relative to RPP.13, 14 Rate pressure product during stress tests is also a determinant of cardiovascular mortality.15
Despite concerns that RPP is raised during IRT, evidence suggests that during maximal isometric resistance exercise, RPP is lower than that seen during maximal aerobic exercise.9, 10 Previous studies into the effect of isometric exercise on blood pressure have not looked at peak SBP, HR and RPP during exercise. The primary aim of this study was to determine the peak SBP, HR and RPP during an acute isometric handgrip exercise session at 5%, 10% and 30% maximum voluntary contraction, in both healthy normotensive individuals and those with pre-hypertension.
Methods
Study Design
A randomized trial was conducted with the objective of determining peak rate pressure product (RPP) during isometric handgrip exercise. After establishing the eligibility of participants they were randomized into either a 5%, 10% or 30% maximum voluntary contraction (MVC) intensity subgroup based on their normotensive/pre-hypertensive status. A computer generated random number assignment was used by D Carlson for randomization of participants.( Figure 1). Each subgroup contained 20 participants who were blinded to intensity allocation and matched at baseline for blood pressure, age, height and weight. Adherence by randomized individuals was 100%, none of the participants reported any adverse effects from the isometric handgrip exercise protocol. The University of New England Ethics Committee approved the investigation, all participants provided written informed consent prior to participation, and all procedures were in accordance with the University’s guidelines. The research project is registered with ClinicalTrials.gov (NCT0245845).
Figure 1. Flow chart demonstrating participant recruitment, randomization and retention. 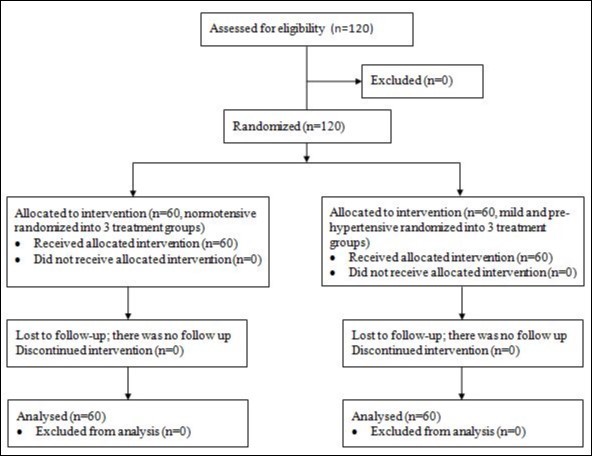
Download figure
Participants
This study recruited 120 participants; 60 normotensives (men; n=34) and 60 pre-hypertensives (men; n=25), aged between 30 and 66 years, from the New England Region NSW Australia. Healthy normotensive participants, for the purpose of this study, were those with a resting systolic blood pressure (SBP) < 125mmHg and/or diastolic blood pressure (DBP) < 85mmHg not currently taking anti-hypertensive medication. Participants with a resting SBP ≥ 125mmHg and/or DBP ≥ 85mmHg, and those receiving pharmacological intervention for blood pressure management were classified as pre-hypertensive. Participants were excluded if they had known cardiovascular disease or multiple comorbidities, were unable to participate under their doctor’s recommendation, smokers, and/or those with arthritis or carpal tunnel which may have been aggravated with handgrip exercise. Participant baseline characteristics are displayed in Table 1.
Table 1. Participant Baseline Characteristics| Normotensive 5% MVC | 10% MVC | 30% MVC | Pre-Hypertensive 5% MVC | 10% MVC | 30% MVC | |
| Characteristics | ||||||
| n (male) | 20 (12) | 20 (12) | 20 (10) | 20 (8) | 20 (10) | 20 (7) |
| Age (years) | 39 ± 9 | 39 ± 11 | 39 ± 12 | 54 ± 7 | 55 ± 8 | 52 ± 8 |
| Height (cm) | 174 ± 8 | 174 ± 11 | 171 ± 9 | 171 ± 9 | 171 ± 10 | 170 ± 9 |
| Weight (kg) | 81 ± 17 | 81 ± 20 | 74 ± 13 | 88 ± 20 | 92 ± 18 | 88 ± 16 |
| SBP (mmHg) | 115 ± 11 | 119 ± 13 | 115 ± 9 | 131 ± 13 | 133 ± 13 | 136 ± 12 |
| DBP (mmHg) | 67 ± 7 | 70 ± 7 | 69 ± 8 | 75 ± 8 | 75 ± 8 | 77 ± 7 |
| MAP (mmHg) | 85 ± 8 | 88 ± 9 | 87 ± 8 | 97 ± 9 | 97 ± 10 | 100 ± 9 |
| HR (bpm) | 68 ± 10 | 70 ± 11 | 68 ± 9 | 69 ± 10 | 70 ± 7 | 67 ± 9 |
| RPP | 7865 ± 1355 | 8251 ± 1103 | 7764 ± 1254 | 9001 ± 1186 | 9325 ± 1157 | 9074 ± 1353 |
Training Protocol
Participants attended the Exercise Physiology laboratory at the University of New England for one isometric handgrip exercise session, supervised by a member of the research team. During this session participants conducted isometric handgrip (IHG) exercise using a DHD-3 Digital Hand Dynamometer (Saehan Corporation, South Korea) with their non-dominant hand. Participants received feedback via a specifically designed light box calibrated to each participant’s % of MVC, to screen them from knowing their group allocation whilst ensuring they performed IHG at the correct intensity.
Prior to commencing the protocol participants conducted three contractions using maximum force, each separated by 30 seconds. These were then averaged to calculate the resistance at which they would conduct their handgrip exercise, either 5%, 10% or 30% of MVC dependent upon which subgroup they were randomized into. Participants then completed four bouts of two-minute IHG contractions at the allocated intensity separated by three-minute rest periods. This training protocol has been used in previous studies which have utilized 30% MVC to investigate the blood pressure lowering effects of IHG.4 Exercise intensities up to 50% MVC have been utilized in IHG studies where participants conducted the exercise for durations of 45seconds; however, this intensity is not sustainable for 2 minutes of IHG.
Blood Pressure Measurements
Baseline blood pressure was established using a Finometer® Midi Model-2 (Finapres Medical Systems B.V., Amsterdam, The Netherlands) to monitor beat-to-beat blood pressure, heart rate (HR) and mean arterial pressure (MAP). Two minutes of continuous resting baseline blood pressure was recorded using the Finometer® prior to commencement of the training protocol. Whilst conducting the training protocol participants remained connected to the Finometer® to monitor cardiovascular measurements, for determining peak RPP during each bout of IHG exercise.
Data from a previous trial conducted by the research team showed that there was no significant difference between sphygmomanometer and Finometer® measurements. We conducted a reliability study containing 40 participants that indicated SBP measurements by sphygmomanometer 131 ± 8.9 and Finometer® 133 ± 16.2 (95% CI -6.35, 2.08 p=.47). This non-significant difference between sphygmomanometer and Finometer® SBP measurements was accompanied by a strong positive correlation; r=0.58.
Statistical Analysis
BeatScope® Easy software which records waveforms and beat-to-beat data was used to unpack the Finometer® data into Excel (Microsoft Corporation, Redmond, USA). The entire two minutes of baseline data was averaged to determine individual baseline SBP, DBP, HR, MAP and RPP. Two minute baseline data was used to (i) categorise participants according to blood pressure and (ii) calculate differences between baseline and peak measures during IHG exercise. Individual participant data for each bout of IHG exercise was scrutinized to determine peak SBP and HR for peak RPP calculation. Mean baseline and peak exercise SBP, DBP, HR, MAP and RPP were used in our analysis.
Data analysis was conducted using SPSS version 22 (Chicago, Illinois, USA), p ≤ .05 was considered statistically significant. Results are presented as mean ± standard deviation and 95% confidence interval (95% CI), unless otherwise specified. One-way ANOVA was conducted to compare mean peak SBP, DBP, HR, MAP and RPP across four bouts of isometric handgrip exercise for each intensity within the normotensive and pre-hypertensive groups. Comparison of the various intensities within the normotensive and pre-hypertensive groups was conducted using MANOVA. Comparison of normotensive versus hypertensive peak RPP for each bout was conducted using one-way ANOVA, with independent t-test used to compare peak bouts for each intensity.
Results
Peak Blood Pressure and Heart Rate during Handgrip Exercise
Comparison of mean peak SBP, DBP, MAP and HR across the four bouts of IHG exercise for each intensity; in both the normotensive and pre-hypertensive groups, showed no significant differences between the four bouts, as shown in Table 2. Comparison of mean baseline SBP, DBP and MAP with the peak of four bouts for the normotensive and pre-hypertensive groups were all statistically significant, p<.01. Peak exercise SBP, DBP and MAP was higher than baseline for all groups.
Table 2. Peak Systolic Blood Pressure, Diastolic Blood Pressure, Mean Arterial Pressure and Heart Rate during Isometric Handgrip Exercise| Normotensive | Pre-hypertensive | |||||
| MVC | 5% | 10% | 30% | 5% | 10% | 30% |
| Systolic Blood Pressure | ||||||
| Baseline | 115 ± 11 | 119 ± 13 | 115 ± 9 | 131 ± 13 | 133 ± 13 | 136 ± 12 |
| Bout 1 | 130 ± 11 | 140 ± 25 | 142 ± 17 | 147 ± 14 | 151 ± 17 | 154 ± 15 |
| ∆ change | 15 | 21 | 27 | 16 | 18 | 18 |
| ∆ % | 13 | 17.6 | 23.5 | 12.2 | 13.5 | 13.2 |
| Bout 2 | 132 ± 20 | 136 ± 14 | 146 ± 18 | 147 ± 19 | 154 ± 18 | 169 ± 36 |
| ∆ change | 17 | 17 | 31 | 16 | 21 | 33 |
| ∆ % | 14.8 | 14.3 | 27 | 12.2 | 15.8 | 24.3 |
| Bout 3 | 133 ± 16 | 136 ± 15 | 154 ± 23 | 143 ± 15 | 156 ± 19 | 174 ± 36 |
| ∆ change | 18 | 17 | 39 | 12 | 23 | 38 |
| ∆ % | 15.7 | 14.3 | 33.9 | 9.16 | 17.3 | 27.9 |
| Bout 4 | 137 ± 29 | 138 ± 18 | 150 ± 17 | 144 ± 17 | 156 ± 17 | 172 ± 33 |
| ∆ change | 22 | 19 | 35 | 13 | 23 | 36 |
| ∆ % | 19 | 16 | 30.4 | 9.9 | 17.3 | 26.5 |
| ANOVA F(3,76) | 0.48 | 0.22 | 1.49 | 0.36 | 0.28 | 1.66 |
| p-value | 0.7 | 0.88 | 0.22 | 0.78 | 0.84 | 0.18 |
| Diastolic Blood Pressure | ||||||
| Baseline | 67 ± 7 | 70 ± 7 | 69 ± 8 | 75 ± 8 | 75 ± 8 | 77 ± 7 |
| Bout 1 | 76 ± 8 | 79 ± 8 | 82 ± 11 | 81 ± 10 | 84 ± 13 | 87 ± 9 |
| ∆ change | 9 | 9 | 13 | 6 | 9 | 10 |
| ∆ % | 13.4 | 12.9 | 18.8 | 8 | 12 | 13 |
| Bout 2 | 74 ± 7 | 80 ± 10 | 90 ± 22 | 82 ± 9 | 85 ± 11 | 92 ± 15 |
| ∆ change | 7 | 10 | 21 | 7 | 10 | 15 |
| ∆ % | 10.4 | 14.3 | 30.4 | 9.3 | 13.3 | 19.5 |
| Bout 3 | 77 ± 10 | 79 ± 8 | 91 ± 17 | 82 ± 9 | 85 ± 13 | 98 ± 22 |
| ∆ change | 10 | 9 | 22 | 7 | 10 | 21 |
| ∆ % | 14.9 | 12.9 | 31.88 | 9.3 | 13.3 | 27.3 |
| Bout 4 | 76 ± 7 | 79 ± 11 | 92 ± 14 | 81 ± 11 | 86 ± 12 | 96 ± 22 |
| ∆ change | 9 | 9 | 23 | 6 | 11 | 19 |
| ∆ % | 13.4 | 12.9 | 33.3 | 8 | 14.7 | 24.7 |
| ANOVA F(3,76) | 0.56 | 0.07 | 1.51 | 0.04 | 0.07 | 1.34 |
| p-value | 0.65 | 0.98 | 0.22 | 0.99 | 0.97 | 0.27 |
| Mean Arterial Pressure | ||||||
| Baseline | 85 ± 8 | 88 ± 9 | 87 ± 8 | 97 ± 9 | 97 ± 10 | 100 ± 9 |
| Bout 1 | 95 ± 9 | 101 ± 11 | 106 ± 12 | 104 ± 11 | 109 ± 12 | 112 ± 11 |
| ∆ change | 10 | 13 | 19 | 7 | 12 | 2 |
| ∆ % | 11.8 | 14.8 | 21.8 | 7.2 | 12.4 | 2 |
| Bout 2 | 97 ± 11 | 101 ± 10 | 112 ± 20 | 107 ± 13 | 111 ± 13 | 121 ± 21 |
| ∆ change | 12 | 13 | 25 | 10 | 14 | 21 |
| ∆ % | 14.1 | 14.8 | 28.7 | 10.3 | 14.4 | 21 |
| Bout 3 | 98 ± 10 | 100 ± 11 | 118 ± 21 | 105 ± 11 | 110 ± 12 | 128 ± 28 |
| ∆ change | 13 | 12 | 31 | 8 | 13 | 28 |
| ∆ % | 15.3 | 13.6 | 35.6 | 8.2 | 13.4 | 28 |
| Bout 4 | 100 ± 16 | 100 ± 14 | 114 ± 13 | 105 ± 12 | 112 ± 13 | 125 ± 29 |
| ∆ change | 15 | 12 | 27 | 8 | 15 | 25 |
| ∆ % | 17.6 | 13.6 | 31 | 8.2 | 15.5 | 25 |
| ANOVA F(3,76) | 0.51 | 0.02 | 1.61 | 0.22 | 0.18 | 1.66 |
| p-value | 0.68 | 0.99 | 0.19 | 0.88 | 0.91 | 0.18 |
| Heart Rate | ||||||
| Baseline | 68 ± 10 | 70 ± 11 | 68 ± 9 | 69 ± 10 | 70 ± 7 | 67 ± 9 |
| Bout 1 | 67 ± 12 | 68 ± 15 | 71 ± 11 | 71 ± 10 | 71 ± 11 | 73 ± 10 |
| ∆ change | 1 | 2 | 3 | 2 | 1 | 6 |
| ∆ % | 1.5 | 2.9 | 4.4 | 2.9 | 1.4 | 9 |
| Bout 2 | 66 ± 10 | 66 ± 11 | 74 ± 11 | 72 ± 9 | 70 ± 8 | 73 ± 12 |
| ∆ change | 2 | 4 | 6 | 3 | 0 | 6 |
| ∆ % | 2.9 | 5.7 | 8.8 | 4.3 | 0 | 9 |
| Bout 3 | 65 ± 10 | 67 ± 12 | 74 ± 13 | 72 ± 9 | 69 ± 7 | 79 ± 16 |
| ∆ change | 3 | 3 | 6 | 3 | -1 | 12 |
| ∆ % | 4.4 | 4.3 | 8.8 | 4.3 | -1.4 | 17.9 |
| Bout 4 | 70 ± 11 | 66 ± 12 | 75 ± 12 | 72 ± 10 | 71 ± 11 | 75 ± 13 |
| ∆ change | 2 | 4 | 7 | 3 | 1 | 8 |
| ∆ % | 2.9 | 5.7 | 10.3 | 4.3 | 1.4 | 11.9 |
| ANOVA F(3,76) | 0.72 | 0.13 | 0.77 | 0.03 | 0.27 | 1.03 |
| p-value | 0.54 | 0.94 | 0.52 | 0.99 | 0.85 | 0.38 |
Peak exercise HR was higher than baseline at 30% intensity with statistically significant differences seen in the normotensive and pre-hypertensive groups, p<.05. Peak HR during IHG exercise was higher in the pre-hypertensive group than the normotensive group. Normotensive 5% and pre-hypertensive 5% and 10% MVC intensities saw minimal increases in HR from baseline to peak exercise with no statistical significance; while peak exercise HR in the normotensive 10% MVC group was lower than baseline.
Peak Rate Pressure Product during Handgrip Exercise
There were no significant differences in peak RPP across the four bouts of 2 minute IHG exercise for each of the intensities, in either the normotensive or pre-hypertensive groups, as shown in Table 3. The high probability and low f-statistic for all of the normotensive and hypertensive groups indicate that there is very little difference in peak RPP between bouts with IHG.
Table 3. Comparison of Peak Rate Pressure Product across Isometric Handgrip Exercise Bouts| Normotensive | Pre-hypertensive | |||||
| 5% MVC | 10% MVC | 30% MVC | 5% MVC | 10% MVC | 30% MVC | |
| Baseline | 7865 ± 1355 | 8251 ± 1103 | 7764 ± 1254 | 9001 ± 1186 | 9325 ± 1157 | 9074 ± 1353 |
| Bout 1 | 8754 ± 1762 | 9409 ± 2334 | 10085 ± 2392 | 10473 ± 1885 | 10724 ± 2028 | 11274 ± 2120 |
| ∆ change | 889 | 1158 | 2321 | 1472 | 1399 | 2200 |
| ∆ % | 11.3 | 14 | 29.9 | 16.4 | 15 | 24.2 |
| Bout 2 | 8785 ± 2244 | 8931 ± 1624 | 10546 ± 2713 | 10479 ± 1716 | 10756 ± 1798 | 12301 ± 3235 |
| ∆ change | 920 | 680 | 2782 | 1478 | 1431 | 3227 |
| ∆ % | 11.7 | 8.2 | 35.8 | 16.4 | 15.3 | 35.6 |
| Bout 3 | 8609 ± 1697 | 9073 ± 1535 | 11586 ± 3297 | 10244 ± 1353 | 10677 ± 1482 | 14136 ± 5879 |
| ∆ change | 744 | 822 | 3822 | 1243 | 1352 | 5062 |
| ∆ % | 9.5 | 10 | 49.2 | 13.8 | 14.5 | 55.8 |
| Bout 4 | 9617 ± 3115 | 9137 ± 1931 | 11320 ± 2352 | 10260 ± 1776 | 11041 ± 1984 | 13077 ± 4878 |
| ∆ change | 1752 | 886 | 3556 | 1259 | 1716 | 4003 |
| ∆ % | 22.3 | 10.7 | 45.8 | 14 | 18.4 | 44.1 |
| ANOVA F(3,76) | 0.81 | 0.23 | 1.3 | 0.12 | 0.16 | 1.6 |
| p-value | 0.49 | 0.88 | 0.28 | 0.95 | 0.92 | 0.2 |
Significant differences were seen between baseline RPP and the peak RPP during IHG exercise in both the normotensive and pre-hypertensive groups, as displayed in Table 4. The peak bout varied amongst groups with the highest being bout 4, bout 1 and bout 3 for the 5%, 10% and 30% MVC normotensive groups respectively. Variation was seen in the pre-hypertensive peak bouts with 5%, 10% and 30% MVC groups peaking at bout 2, bout 4 and bout 3 respectively. Although rate pressure product increases from baseline to peak were statistically significant for all groups, the actual increase in RPP was relatively minimal in the 5% and 10% groups compared to those seen in the 30% group, Table 4.
Table 4. Comparison of Baseline Rate Pressure Product and Peak Rate Pressure Product during Isometric Handgrip Exercise| Baseline RPP Mean ± SD | Peak RPP Mean ± SD | 95% CI | p-value | ∆ change | ∆% | |
| Normotensive | ||||||
| 5% MVC | 7865 ± 1355 | 9617 ± 3115 | -3378, -127 | P=.003 | 1752 | 22.3 |
| 10% MVC | 8251 ± 1103 | 9409 ± 2334 | -1260, -100 | P=.015 | 1158 | 14 |
| 30% MVC | 7764 ± 1254 | 11586 ± 3297 | -5894, -1751 | P<.001 | 3822 | 49.2 |
| Pre-hypertensive | ||||||
| 5% MVC | 9001 ± 1186 | 10479 ± 1716 | -2449, -507 | P˂.001 | 1478 | 16.4 |
| 10% MVC | 9325 ± 1157 | 11041 ± 1984 | -2906, -526 | P˂.001 | 1716 | 18.4 |
| 30% MVC | 9074 ± 1353 | 14136 ± 5879 | -8923, -1201 | P=.001 | 5062 | 55.8 |
Comparison of Normotensive Versus Hypertensive
As expected peak RPP was higher for all of the pre-hypertensive intensities than those seen in the corresponding normotensive groups. There were no significant differences between the normotensive and pre-hypertensive peak bouts in either the 5% intensity (95% CI -748, 2472, p=0.29) or the 30% intensity (95%)
CI -501, 5601, p=0.99) groups. Statistically significant differences were seen between the peak bouts in the normotensive and pre-hypertensive groups in the 10% intensity (95% CI 246, 3019, p=0.02).
Discussion
The primary aim of this study was to determine the effect of isometric handgrip exercise on blood pressure, heart rate and consequently rate pressure product. The study demonstrates that IHG exercise increases blood pressure, and consequently RPP in both healthy normotensive and pre-hypertensive individuals during IHG exercise, but to a lesser extent than aerobic exercise. Blood pressure increases were greater with increased intensity, as indicated by Maior et al. (2014).9
Blood Pressure and Heart Rate
As anticipated we saw significant increases in SBP, DBP, MAP and HR from baseline to peak exercise during IRT. The pre-hypertensives had an initial higher baseline than the normotensives; interestingly, increases in SBP, DBP, MAP and HR across all intensities for both the normotensive and pre-hypertensive groups were similar. Within the 30% intensity the normotensives increased SBP by 39mmHg, while the pre-hypertensives increased by 38mmHg. When we compare our IRT responses to previously published aerobic exercise response data, we find that hypertensive responses of SBP during exercise stress tests have reached greater increases and peaks than those seen in this IRT study. Kurl et al.16 saw mean maximal SBP during an exercise stress test of 210mmHg, while Gupta et al. 17 saw increases greater than 44mmHg with a peak of 195mmHg. A meta-analysis conducted by Schultz et al.18 indicated SBP hypertensive responses to moderate and maximal exercise reaching 230mmHg during aerobic exercise.
Increases from baseline to peak in DBP for the 30% normotensives were 23mmHg while pre-hypertensives increased 21mmHg. More moderate increases from baseline to peak in DBP were seen by
Gupta et al.17 with only an 8mmHg increase to 88mmHg during a stress test. The increases from baseline to peak in MAP were 31mmHg for the 30% normotensives and 28mmHg for the pre-hypertensives. The highest peak MAP observed in this study was 128mmHg which is comparable with those seen by Simonson and Wyatt19 with MAP of 142mmHg cycling and 124mmHg using treadmill.
Heart rate increases seen in this study were minimal even in the 30% intensity groups with only a 7bpm increase and peak of 75bpm in the normotensives, and a 12bpm increase with a peak of 79bpm in the pre-hypertensives. The Finnish cardiovascular study saw HR more than double with peaks during exercise of 152bpm and 131bpm during an exercise stress test.15 Similar increases in HR were seen by Simonson and Wyatt19 who saw HR peaks of 175bpm during supine cycle ergometry and 187bpm on a treadmill in maximum stress tests. The recovery seen after IRT occurs within 20 seconds, indicating that it is less dangerous than aerobic exercise due to low increases in heart rate and fast recovery.
Rate Pressure Product
Baseline to peak RPP for the 30% intensity normotensive group increased by 3822 to a peak of 11586, with the pre-hypertensive group increasing by 5062 to a peak of 14136.
The RPP increases which we saw are similar to those seen by Maior et al. (2014)9, who looked at blood pressure measurements taken immediately following isometric bench presses conducted by healthy individuals, and calculated RPP at approximately 12500 at 25% intensity. Atkinson et al. (2009)13 assessed RPP from 24hour ambulatory monitoring in patients attending a hypertension clinic and saw mean RPP of 9824 with a peak of 11284, from people conducting their normal routine.
Overall maximal RPP during stress tests conducted by Pinkstaff et al. (2010)20 reached 27729 with one group averaging 28302. Maximum stress tests conducted by Simonson and Wyatt (2003)19 saw RPP during supine cycle ergometry of 34475 and treadmill of 31930, when taking oxygen consumption into account they equated to 27190 and 22600, respectively. The comparatively low, peak RPP which we observed, is attributed to the minimal effect of isometric exercise on heart rate.
Conclusion
The increases in rate pressure product observed during isometric handgrip exercise were not as substantial as those seen during moderate and vigorous aerobic exercise in previous studies. Positive correlation among the four bouts of isometric handgrip exercise and baseline data in this study indicates that there is a positive linear relationship between blood pressure and intensity of isometric handgrip exercise. Statistical analyses show that increases in blood pressure, and consequently rate pressure product, are relative to baseline blood pressure. Greater increases in blood pressure and rate pressure product were observed with increased intensity; however, these were correlated with similar increases in both normotensives and pre-hypertensives. Previous studies reporting SBP, HR and RPP during exercise stress testing indicate that increases in these are a lot greater than those seen during IRT; indicating that cardiovascular responses during IRT are within safe limits.
Limitations and Future Research
The main limitation of this study is a lack of direct comparison data with aerobic exercise. Recommendation for future research would be to conduct IRT and aerobic exercise with participants to get a direct comparison of SBP, DBP, HR and RPP in the two exercise modalities within the same cohort.
References
- 1.World Health Organisation, WHO. (2015) Cardiovascular disease (CVDs). Switzerland;Fact sheet No.317.
- 2.Winter K H, Tuttle L A, Viera A J. (2013) Hypertension. Primary Care - Clinics in Office Practice. 40, 179-194.
- 3.Go A S, Bauman M A, Coleman King SM, Fonarow G C, Lawrene W. (2014) An Effective Approach to High Blood Pressure Control: A Science Advisory From the American Heart Association, the American College of Cardiology, and the Centers for Disease Control and Prevention. , Hypertension; 63, 878-885.
- 4.Millar P J, McGowan C L, Cornelissen V A, Araujo C G, Swaine I L. (2014) Evidence for the Role of Isometric Exercise Training in Reducing Blood Pressure: Potential Mechanisms and Future Directions. , Sports Medicine; 44, 345-356.
- 5.Carlson D J, Dieberg G, Hess N C, Millar P J, Smart N A. (2014) Isometric Exercise Training for Blood Pressure Management: A Systematic Review and Meta-analysis. Mayo Clinic Proceedings;. 89, 327-34.
- 6.Kelley G A, Kelley K S. (2010) Isometric handgrip exercise and resting blood pressure: a meta-analysis of randomized controlled trials. , Journal of Hypertension; 28, 411-8.
- 7.Inder J D, Carlson D J, Dieberg G, McFarlane J R, NCL Hess et al. (2015) Isometric exercise training for blood pressure management: a systematic review and meta-analysis to optimize benefit. , Hypertension Research; 39, 88-94.
- 8.Mozaffarian D, Benjamin E J, Go A S, Arnett D K, Blaha M J. (2016) Heart Disease and Stroke Statistics—2016 Update: A Report From the American Heart Association. , Circulation; 133(4), 38-360.
- 9.Maior A S, Paixao R C, Ribeiro I C, DGS Freitas, Mota G R et al. (2014) Acute responses of rate pressure product in sets of resistance exercise. , Medicina Sportiva; 18, 36.
- 10.Pollock M L, Franklin B A, Balady G J, Chaitman B L, Fleg J L. (2000) Position paper endorsed by the American College of Sports Medicine.Resistance Exercise. in Individuals With and Without Cardiovascular Disease: An Advisory From the Committee on Exercise, Rehabilitation, and Prevention, Council on Clinical Cardiology, American Heart Association. Circulation; 101, 828.
- 11.Hui S, Jackson A S, Wier L T. (2000) Development of normative values for resting and exercise rate pressure product. Medicine and Science in Sports and Exercise; 32, 1520-1527.
- 12.Gobel F L, Nordstrom L A, Nelson R R, Jorgensen C R, Wang Y. (1978) The Rate-Pressure Product as an Index of Myocardial Oxygen Consumption during Exercise in Patients with Angina Pectoris. , Circulation; 57, 549-556.
- 13.Atkinson G, George K P, Jones H, Leary A C, Murphy M B. (2009) 24-Hour variation in the reactivity of rate-pressure-product to everyday physical activity in patients attending a hypertension clinic. , Chronobiology International; 26, 958-973.
- 14.Smolensky M, Hermida R, Portaluppi F, Haus E. (2007) Twenty-four-hour pattern of angina pectoris, acute myocardial infarction and sudden cardiac death: Role of blood pressure, heart rate and rate-pressure product circadian rhythms. , Biological Rhythm Research; 38, 205-216.
- 15.Nieminen T, Leino J, Maanoja J, Nikus K, Viik J. (2008) The prognostic value of haemodynamic parameters in the recovery phase of an exercise test. The Finnish Cardiovascular Study. , Journal of Human Hypertension; 22, 537.
- 16.Kurl S, Laukkanen J, Rauramaa R, Lakka T. (2001) Systolic blood pressure response to exercise stress test and risk of stroke. , Stroke; 32, 2036-41.
- 17.Gupta M P, Polena S, Coplan N, Panagopoulos G, Dhingra C. (2007) Prognostic significance of systolic blood pressure increases in men during exercise stress testing. , The American Journal of Cardiology; 100, 1609-13.
- 18.Schultz M G, Otahal P, Cleland V J, Blizzard L, Marwick T H et al. (2013) Exercise-induced hypertension, cardiovascular events, and mortality in patients undergoing exercise stress testing: a systematic review and meta-analysis. , American Journal of Hypertension; 26, 357-66.
Cited by (19)
This article has been cited by 19 scholarly works according to:
Citing Articles:
Translational Journal of the American College of Sports Medicine (2025) OpenAlex Crossref Semantic Scholar
Bulletin of Faculty of Physical Therapy (2025) OpenAlex
Bulletin of Faculty of Physical Therapy (2025) Crossref Semantic Scholar
European Journal of Applied Physiology (2025) OpenAlex Semantic Scholar Crossref
Journal of Clinical Exercise Physiology (2024) OpenAlex Crossref Semantic Scholar
Sports Medicine (2024) OpenAlex Crossref Semantic Scholar
Clinical Hypertension (2023) OpenAlex Crossref Semantic Scholar
Annals of the National Academy of Medical Sciences (India) (2022) OpenAlex Crossref Semantic Scholar
Hypertension Research (2022) OpenAlex Crossref Semantic Scholar
Hypertension Research (2021) OpenAlex Crossref Semantic Scholar
Hypertension Research (2020) Crossref OpenAlex Semantic Scholar
E. Shakoor, M. Salesi, F. Daryanoosh, Payman Izadpanah - (2020) Semantic Scholar
International Journal of Sport Exercise and Health Research (2020) OpenAlex Semantic Scholar
(2020) OpenAlex
Medicine & Science in Sports & Exercise (2020) OpenAlex Crossref
N. Smart, R. Howden, V. Cornelissen, R. Brook, C. McGowan et al. - Medicine & Science in Sports & Exercise (2020) Semantic Scholar
Journal of Cardiopulmonary Rehabilitation and Prevention (2018) OpenAlex Crossref Semantic Scholar
Current Hypertension Reports (2017) OpenAlex Crossref Semantic Scholar
Journal of Hypertension and Cardiology (2017) OpenAlex