
Wind Turbine Public Safety Risk, Direct and Indirect Health Impacts
Abstract
Wind turbines are often perceived as benign. This can be attributed to the population majority dwelling in urban locations distant from most wind turbines. Society may understate the risk to individuals living near turbines due to an overstatement of the perceived benefits of turbines, and an understatement of the risk of injury from falling turbine parts, or shed ice. Flaws in risk calculation may be attributed to a less than fully developed safety culture. Indications of this are the lack of a comprehensive industry failure database, and safety limits enabling the industry growth, but not protective of the public. A comprehensive study of wind turbine failures and risks in the Canadian province of Ontario gives data to enable validation of existing failure models. Failure probabilities are calculated, to show risk on personal property, or in public spaces. Repeated failures, and inadequate safety separation show public safety is not currently assured. A method of calculating setbacks from wind turbines to mitigate public risk is shown. Wind turbines with inadequate setbacks can adversely impact public health both directly from physical risk and indirectly by irritation from loss of safe use of property. Physical public safety setbacks are separate from larger setbacks required to prevent irritation from noise and other stressors, particularly when applied to areas of learning, rest and recuperation. The insights provided by this paper can assist the industry to enhance its image and improve its operation, as well as helping regulators set safety guidelines assuring protection of the public.
Article Information
- Received
- Accepted
- Published
Academic Editor: Loai Aljerf, Department of Basic Sciences, Faculty of Dental Medicine, Damascus University, Damascus, Syria.
Checked for plagiarism: Yes
Review by: Single-blind
Copyright © 2018 William K.G. Palmer
 This is an open-access article distributed under the terms of the Creative Commons Attribution License, which permits unrestricted use, distribution, and reproduction in any medium, provided the original author and source are credited.
Corresponding author: William K.G. Palmer, Independent Researcher, TRI-LEA-EM, 76 Sideroad 33-34, RR 5, Paisley, Ontario N0G 2N0, Canada —
Competing Interests
The authors have declared that no competing interests exist.
Funding
This research project was funded by the investigator and received no external funding.
Data Availability
No data-availability statement was provided by the authors.
Acknowledgements
Discussion with many individuals who identified their concerns and sources of irritation with wind turbines in their environment contributed to this paper.
Particular acknowledgement is made to the experience gained by the author from participating in a number of Ontario Environmental Review Hearings and Ontario Municipal Board hearings about the siting of wind turbines in Ontario. It was valuable to listen to witnesses and counsel for both the proponents from the wind turbine arrays, as well as witnesses for and counsel for the Ontario Ministry of the Environment who described their perception of the public safety risk from wind turbines. It was enlightening to understand how these individuals perceived public safety risk. A common theme was that one had to show that engaging in the project “will cause harm.” The closing statement to the Ontario Environmental Review Tribunal, by the Ontario Ministry of the Environment, Conservation and Parks, states, “An appellant must prove on a balance of probabilities that harm will occur, rather than it may or is likely to occur.” It became apparent that this requirement of the regulatory process would require that a revolver with 6-cartridge capability is loaded with no fewer than 4 bullets before one plays "Russian Roulette." Any less than 4 bullets could only establish that holding the gun to one's forehead and pulling the trigger "may or is likely to cause harm" but it would not prove “on a balance of probabilities” that it "will cause harm." Helping legislators, regulators, tribunals, and the public understand that public safety principles require a higher level of protection than requiring that the project “will cause harm” became the basis for this paper.
Photographs taken by Michael Pobjoy, Michael Leitch, and Scott Miller were used with permission of the photographers. All other photographs in the paper are by the author.
Review, and comments provided by Santo Giorno and Michael Leitch of a draft of this paper contributed to improvements made.
The Google Map template used in Figure 7 is used in accordance with the criteria of the Google Maps Universal Terms and Maps/Earth Additional Terms of Service.
It is necessary to acknowledge that many of the individuals and senior managers in the Ontario nuclear power industry, from Ontario Hydro Nuclear to successor organizations of Ontario Power Generation, and Bruce Power were instrumental in developing the awareness of the author of the concept of “safety culture” even before the term was widely used. From the senior Nuclear First Operator who sagely advised a green young Shift Supervisor to “never turn your back on an operating reactor” (meaning maintain continuous monitoring of system status do not expect that annunciation of alarms to be adequate to tell of problems) to a well respected manager who advised that when searching for a problem, “if you turn over enough rocks you will find the maggots” (meaning dig into the detail of events and you will find the cause.) The opportunity to be responsible for monitoring of nuclear system performance, to develop a nuclear station operating experience program, that included time spent in research libraries at MIT, and the opportunity to deal with nuclear regulators who had a no excuses accepted philosophy all helped set the background for this work on wind turbines. While at first glance it might seem an unrelated subject, in reality the protection of the public deserves the same approach, as the consequences of being killed by either technology are the same, the individual is dead. Monitoring low frequency accidents demands that the excuse of “it has never happened before” is never enough. Thank you to all of those individuals who mentored my progress.
Funding
This research project was funded by the investigator and received no external funding.
Citation:
Introduction
The public safety risk posed by wind turbines requires a study of the frequency of accidents or incidents that may cause consequential harm to the public. It is different than looking at harm to employees injured at work. Usually public safety refers to direct health impacts, of injury or death, but this study also looks at how the health impacts may be indirect, caused by the irritation that itself results in stress and harm. The overall goal of the study was to determine if existing regulations, protective barriers, and mitigation strategies assured public safety. A corollary goal was to identify changes that might be required, to assist the industry, and regulators assure public protection.
The study began with a literature search conducted using Google Scholar, with the criteria “wind turbine” AND “public safety” OR “risk”. Relevant files suggested are identified in this paper.
Consideration of factors that might bias public acceptance of wind turbine failures either in a positive or negative manner were sought to avoid prejudice.
The existing safety culture of the wind turbine industry was studied by comparing it to the safety culture existing in mature industries, using the nuclear industry as an example.
Contribution to public safety risk from turbine failures was studied through a detailed examination of seven verified failures that have occurred in the lifetime operation of 2546 industrial wind turbines in the Canadian province of Ontario to show how each resulted in wind turbine blade parts on the ground. This examination was undertaken to ensure that all known failure modes that might harm the public were considered. Failures of smaller wind turbines and failures that did not result in significant blade pieces hitting the ground so they might adversely impact the public were eliminated.
From the seven failures identified the wind turbine failure rate was calculated in a manner consistent with that done in a mature industry. The failure rates identified were compared to the typical “bathtub curve” of failure rates to determine if the failures were indicative of a normal operating service period, and can thus be used to predict future failure rates with confidence.
The public safety harm from wind turbine failures were compared to harm from other public safety issues to identify anomalies.
The examination of the seven verified failures was expanded by considering the contribution for ice shed from wind turbines which is a public safety risk common to all wind turbines operating in an environment where icing can occur.
The methods used to calculate public safety risk from wind turbine accidents and icing was examined to identify logical shortcomings.
Finally, conclusions of the study were identified.
Methods
The literature search identified a very relevant basis as to how the world perceives risk. An academic PhD dissertation by Greg Klaus 1 identified a document from 1969 by Dr. Chauncey Starr. At the time, Starr was Dean of the School of Engineering and Applied Science, of the University of California, Los Angeles. Starr’s paper 2, identified that the individual acceptance of “involuntary risk” over which they perceived they had no control, varied as the third-power relationship of the benefit they expected to receive by incurring the risk. Starr expressed this in terms of wage, but presumably it could by extension be extended to other benefits the individual might feel about the threat to global existence posed by climate change, and the benefit that converting the electrical supply to wind turbine-generated power would yield. A perceived benefit would suggest acceptance of higher risks due to the exponential nature of the benefit to risk relationship identified by Starr.
Typical of many of the papers, examples from the World Bank, and the Hofstra Law Review 3, 4 pointed out the rapid increase in wind generation deployment in the world as a sign of hope. A common way of expressing this is shown in Figure 1, showing the increase in the annual Global Wind Capability and Wind Output, where the data comes from the Global Wind Energy Council. 5
The paper by Starr indirectly foretold the rapid deployment of wind generators worldwide, and the potential for adverse consequences. In the paper Starr pointed out that “Engineering developments involving new technology are likely to appear in many places simultaneously and to become deeply ingrained into the systems of our society before their impact is evident or measureable.” He carries on, “Thus, we now face a general situation in which widespread use of a new technological development may occur before its societal impact can be properly assessed.”
As we consider the societal impact posed by wind generators, it becomes even more important to consider the perceived benefit of their deployment. Even a slight overstatement of the perceived benefit can result in biasing the acceptance of risks. For this reason, instead of focusing on the growth in the global wind capacity and output shown in Figure 1, a more relevant portrayal of the benefit to be played by wind turbines can be shown in Figure 2, which identifies the link between world population, energy use, and the significance of the wind generators to supply that energy use. The information in the figure is derived from information found in the web site ourworldindata.org maintained by University of Oxford economist Max Roser 6. The energy information on that site compiles together data from the United States Energy Information Institute, the International Energy Agency, the BP Statistical Review of World Energy, World Development Indicators of the World Bank, and Eurostat.
Figure 1. Global Wind Capacity and Output – 1990 to 2016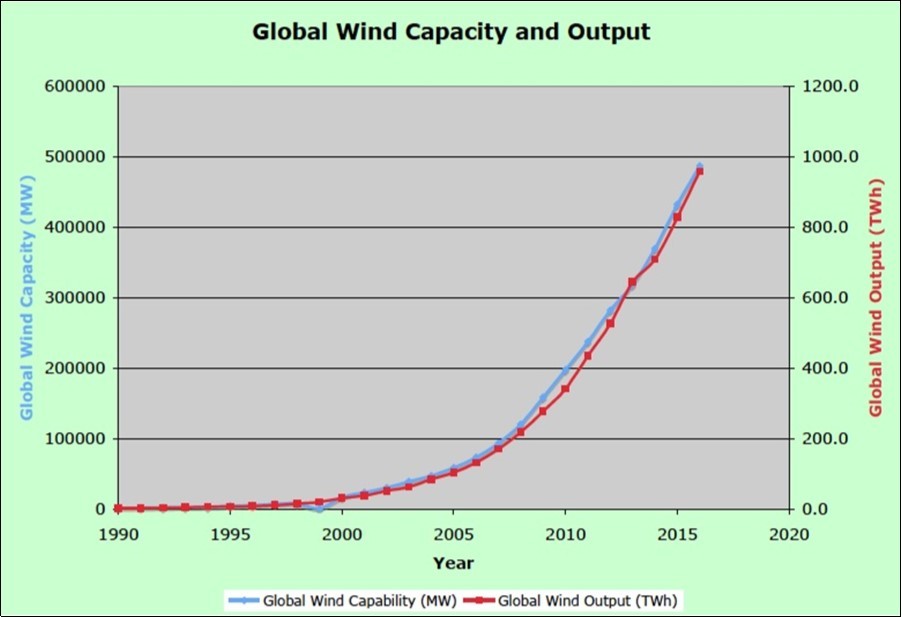
Download figure
Figure 2. World Population & Energy Use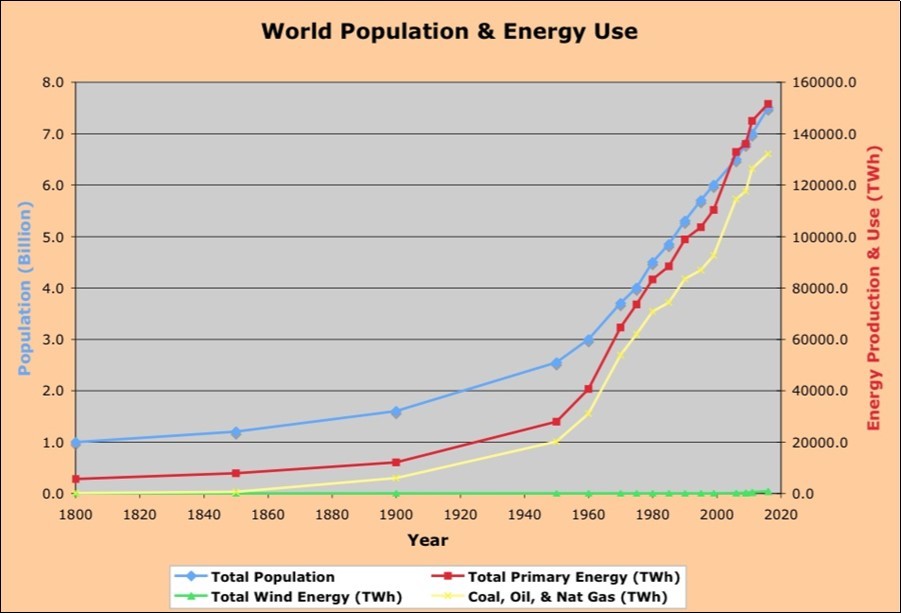
Download figure
Figure 2 shows that the world energy use, dominated by supply by fossil fuels of coal, oil, and natural gas followed the world population increase proportionally until about 1950 when the world population was about 2.6 billion, but since then the world energy use has increased at a faster rate than the population as developing nations strive to emulate the developed nations. Even considering that increasing rate of global energy use compared to population, it is enlightening to think that world population itself has tripled from what it had achieved in the entire history of humankind within the last 70 years, less than the individual lifetime of some of us. While predicting the future is itself fraught with danger, it is informative to note that world population is predicted to further increase from 7.4 billion in 2015 to 9.2 billion in 2040, based on the UN Population Division for their “medium variant” estimate. History suggests that world energy use will climb at an even higher rate. To consider the impact wind generation will have on this increase in world energy use it is important to note that even with the increase in wind generation shown in Figure 1, wind hardly shows on the bottom of the chart of world energy supply sources in Figure 2. A more detailed evaluation for 2016 shows the ranking of worldwide primary energy supply (rounded to one decimal point):
Crude oil supplied 33.9%
Coal supplied 28.6%
Natural gas supplied 24.6%
Traditional biomass supplied 7.3%
Hydropower supplied 2.7%
Nuclear supplied 1.7%
Wind generators supplied 0.6%
Renewables other than hydro, wind, traditional biofuels or solar supplied 0.4%
Solar supplied 0.2%
Equipped with a more realistic view of the impact of wind generation on meeting an increasing world primary energy need, we can now turn our attention to the public safety risk impacts of wind generators as identified in the Introduction, presenting the “Findings” that arose from each aspect of the study results.
One area of Public Safety not included in the scope of this paper was the risk to aircraft. It is known that fixed wing small aircraft and rotary wing helicopters often used by Air Ambulance services may fly at altitudes where they are at risk of interference from land based wind turbines that have moving blades 200 metres above ground level, some of which are not fully charted on air navigation charts. Aircraft safety is considered to be a specialty beyond the scope of this paper.
Results
Finding 1 - Safety Culture in Wind Versus Mature Industry
Any discussion of public safety risk in an industry has to consider the question of safety culture in the industry. Mature industry, for which we will use the nuclear industry as an example, (although we could look at railways, air travel, or other examples) recognizes that safety culture is critical to sustain and improve safety. One finds the term used in a common manner by the nuclear industry regulators, agencies, and operators, for example:
Regulator - Canadian Nuclear Safety Commission (CNSC)
Regulator - United States Nuclear Regulatory Commission (USNRC)
International Advisory Agency - International Atomic Energy Agency (IAEA)
Industry Association - World Association of Nuclear Operators (WANO)
Industry Association - Institute of Nuclear Power Operations (INPO) in the USA
Operator - Électricité de France (EDF)
Operator - Bruce Power (in Canada)
Safety culture recognizes the need for continuous improvement, and to achieve that the sharing of information about adverse incidents, or operating experience about best practices in a learning atmosphere. The World Association of Nuclear Operators recognizes that “operating experience is highly valued and the capacity to learn from experience is well developed.” 7 The industry recognizes and encourages sharing of experience by programs such as the IAEA Operational Safety Review Team (OSART) or the WANO Peer Reviews. The organizations maintain databases of operating experience that are available both to industry and to the public.
In contrast, the wind industry has not yet developed the maturity to recognize the importance of sharing of experience. Operating information, and particular information about accidents and incidents is classified as commercially confidential. In searching records of wind industry incidents, repeatedly one finds that those trying to assess safety in the wind industry state that the industry does not have a comprehensive listing of incidents and events that can be used as a learning tool.
In 2002, the Netherlands Agency for Energy and the Environment (NOVEM) commissioned a handbook (in Dutch) to give procedures for the risk assessment of wind turbines. 8 A paper describing the handbook was presented at the Global Wind Energy Conference in 2002. 9 At the time the Handbook was prepared, the authors used wind turbine failure information from a German database, a Danish database, and a Dutch database.
A revised version of the Dutch wind turbine risk handbook was issued in 2014, “Handboek Risicozonering Windturbines” 10 . The revised version states, “It is striking that wind turbine failure data are not kept centrally.” It goes on to note, “The Caithness Windfarm Accident database is the most comprehensive database of accidents that is publicly available.” The Dutch Handbook compared the Caithness database information on German, Dutch and UK turbines, and information from “Windkraft” Journals. The Caithness database was the most comprehensive, although some of the news media links it included were no longer active. The accident data in the Caithness database for accidents in the Netherlands was checked with two manufacturers who confirmed the data included most, but not all the failures that the manufacturers were aware of. The Handbook states that the missed number of incidents (for the Netherlands) does not exceed 10 to 20%.
A “text-mining” paper in 2017 11 that studied wind turbine accidents notes, “As of January 2016, the most extensive data available on the Internet on wind turbines accidents was published by the Caithness Windfarm Information Forum (CWIF).”
A second 2017 12 paper that presents a general review of typical wind turbine mechanical failures also references the Caithness database as it’s source of information about blade failures.
Even in 2018, another paper 13 that set out to provide an analysis towards integrating wind turbine failures with public safety risks, and expanded an existing Fault Tree Analysis concluded that information available about wind turbine failures is still limited and there is a lack of detailed descriptions of incidents in the recorded data.
Perhaps it is because of the lack of a comprehensive wind industry database that a number of reports in the media document where reporters have contacted the wind industry about a recent failure, to receive a response such as, “the company confirmed this sort of incident is extremely rare,” (in this case a fire destroying a Vestas V80 turbine in Murdochville, Quebec) 14 even though the Caithness database identifies a similar event of the identical turbine type occurred in neighbouring province of Ontario, Canada only 7 months earlier, a similar Vestas 90 turbine destroyed by file in the neighbouring state of Maine, also 7 months earlier, and a similar Vestas V90 turbine destroyed by fire in the province of New Brunswick, immediately south of Quebec less than 4 years earlier. Perhaps had the company representatives been aware of the 2 fires in wind turbines of the same manufacturer in neighbouring jurisdictions in the previous 7 months, or the 93 fires in all types of wind turbines reported in the Caithness Windfarm Accident Statistics in the 5 years leading up to the fire in Murdochville, the response may not have been the same as to describe it as “extremely rare.” Not having an industry failure database is a problem.
The 4 fires in Vestas V80 and V90 turbines in Quebec, Ontario, New Brunswick and Maine occurred in the 5 years from 2009 – 2013 during a total of 10,377 turbine years of operation (of various types and brands) in the 4 jurisdictions. A fire failure rate of 4/10,377 turbine years (of all types) can be expressed as 3.9 x 10⁻⁴. However, if one considers only the year of 2013, then the 3 Vestas fires in Ontario, Maine, and Quebec occurred during a total of 572 Vestas turbine years of operation (if one includes the New Brunswick data to compare the same data set). 3 fires in 572 turbine years of operation can be expressed as 5.2 x 10⁻³.
The pharmaceutical industry carefully tracks low failure rates. The European Drug Regulatory Agency (EMA - European Medicines Agency) defines “rare” as affecting between 1 in 1,000 and 1 in 10,000. Similarly, they define “very rare” as affecting less than 1 in 10,000. These are the same levels of definition for “rare”, and “very rare” adverse drug reaction as used by the World Health Organization. 15:
Very common >= 1/10
Common (frequent) >= 1/100 and < 1/10
Uncommon (infrequent) >= 1/1000 and < 1/100
Rare >= 1/10,000 and < 1/1000
Very rare < 1/10,000
By these criteria the description of the third 2013 fire in Vestas turbines of neighbouring jurisdictions in 572 Vestas turbine years (5.2 x 10⁻³) might be considered as “uncommon” but certainly not “extremely rare” as described by the industry.
Another comparison of the difference between a mature industry and an immature one with regard to safety culture can be seen in the response to technical issues of concern that arise. In nuclear plant accident management principles it is common to have at least one senior individual maintain an overview of the progression of events of an accident, without being directly involved in the routine decision making steps. The reason for this is to avoid the common failing of “group-think” where everyone goes along with the common understanding of what is happening without challenging the norm. Someone standing back, maintaining an independent overview is more likely to notice something unexpected happening than a group of people who are all following the same sequence of events in their minds. Identification of the unexpected can be critical to the success of the accident mitigation. Safety culture recognizes the value of independent overview, whether by independent assessments, or by individuals holding back to not be encompassed by “group-think.” Kaplan and Mikes 16 present a business perspective on managing risk including discussion about the subject of “group-think”. The Kaplan and Mikes paper also uses the example of the Deepwater Horizon oil rig explosion to point out that management failures can cripple “the ability of individuals involved to identify the risks they faced and to properly evaluate, communicate and address them.”
Those setting up operational experience sections in the nuclear industry carefully studied incidents in other industries, whether they might be rail, air, sea transportation, aerospace, or chemical events. Events such as the Bhopal chemical release, the Challenger space shuttle disaster, the Exxon Valdez oil spill, aircraft crashes, and even subway train accidents were studied along with the Three Mile Island and Chernobyl nuclear reactor accidents, to look for common links. A memorable finding was recognition of the common thread of projects being pushed forward with inadequate recognition of concerns being raised by knowledgeable individuals close to the issue. As an example study of the Challenger space shuttle disaster found that prior to the launch failure, the concern of sealing O-ring failure at cold temperatures was raised by technical experts, but was dismissed by those focusing on the schedule constraints. The issue was used as example of an inadequate safety culture. In the wind industry, a parallel example is the identification of a potential harm causing sequence of events, to which the common “group-think” is that in 30 years of the industry, we have never seen any member of the public harmed by a wind turbine accident. Dismissing a possibility because it is not known to have happened is only forestalling the day when an accident that can do harm happens, people will be harmed, and the subsequent investigation finds a large group of decision makers saying, “but nobody told us it could happen.”
In a mature industry, dealing with identified concerns is important. It is not sufficient to ignore the concern, or to use the excuse “it has never happened before”. The industry with a mature safety culture will disposition the identified concern and either show why:
The event cannot happen, or
What mitigating barriers are in place to prevent harm from occurring, or
That the risk of the event is less than other accepted risks, and the possibility is clearly identified so that potentially impacted individuals can either accept the risk, or move away from the risk zone. In some cases accepting this latter option may require compensation to enable the person to re-establish their life elsewhere.
As safety culture grows in an industry, and the importance of learning from the experience of others becomes ingrained, the openness of the industry increases. The secretive culture that restricts information as commercially confidential, for the advantage of some, is replaced by a culture that recognizes that success in an industry means that all players, and the public are winners.
An indication that the wind industry has embraced a true openness safety culture will be evident when those performing a risk evaluation no longer have to turn to a public database of failures maintained by a citizen group such as the Caithness Windfarm Information Forum. 17 Presumably an industry database should be able to be more inclusive of information such as accident details and turbine specifics than one that has to depend on media reports as its auditable source of information. Having that information readily available will be an asset to the industry, to decision makers, and to the public.
Finding 2 - Contribution to Public Safety Risk from Turbine Failures
The Starr paper of 1969 identifies a useful beginning point suggesting, “the risk measure used here is the statistical probability of fatalities per hour of exposure of the individual to the activity considered.” 2 For an individual impacted by wind turbines, the relevant risk is not the risk averaged over the year, but the risk at the time the individual is exposed to the risk.
The first conclusions of the Starr paper are also relevant to our study:
1) The indications are that the public is willing to accept “voluntary” risks roughly 1000 times greater than “involuntary” risks.
2) The statistical risk of death from disease appears to be a psychological yardstick for establishing the level of acceptability of other risks.
3) The acceptability of risk appears to be crudely proportional to the third power of the benefits (real or imagined).
4) The social acceptance of risk is directly influenced by public awareness of the benefits of an activity, as determined by advertising, usefulness, and the number of people participating.
The study of safety considerations from large wind turbines has a considerable history. The earliest relevant paper determined by the Google Scholar search described for this paper was written in 1979, by Dwight Reilly 18 of the United States National Aeronautics and Space Administration (NASA) who were developing the 2500 kW Mod-2 wind turbine prototype. The paper notes, “From the outset of the program the designer must address, in a formal and disciplined way, the issues associated with safety of hardware, safety of the environment and above all safety of the public and the construction and maintenance personnel.” There was of course no failure data, as at that time the turbine had yet to be erected.
Over the next decade, a succession of papers were issued 19, 20, 21, 22, 23 all dealing with the creation of calculation models, and considerations for calculation of trajectories of detached wind turbine blades, beginning from simple ballistic models to more complex Monte Carlo methods. In each case, the models were based on assumptions of blade throw dynamics, with little actual throw data to verify the models.
A number of papers have titles incorporating terms similar to “probabilistic risk assessment for wind turbine” or “reliability analysis methods for wind turbines” 24, 25, 26, 27, 28, 29, 30, 31, 32. Examination of the papers determines that they are based on stochastic (i.e. random failure) models for maintenance optimization for the turbines, and are based on normal design conditions for wind load and blade strength, but not extreme failures, and do not generate data directly related to public safety such as distance travelled by failed components.
Finally, a number of most recent papers 33, 34, 35, 36, 37, 38, 39 are related to the risks from wind turbines. Where the papers indicate that they are related to public safety, they have been reviewed for relevance. Two of the papers 33, 36 calculate a blade failure frequency and discuss public safety, but do so based on a stochastic assessment of factors such as material strength, wind speed, and rotor speed. The papers were reviewed to determine if they included other severe factors that have been related to blade failure – lightning strike, fires from the nacelle progressing to the blades, tower contact by the blades, or severe weather conditions. These factors do not appear to be included in the referenced papers, and the papers do not address blade pieces actually falling to the ground where they would result in a public safety risk.
A consideration in many of the referenced papers for wind turbine risks is that carrying out the design of wind turbine systems on the basis of a probabilistic (also known as stochastic, or random) safety analysis, would result in requiring a smaller safety factor than required by a deterministic safety approach. In short, the design would cost less. This approach has been carried forward from design into the public safety arena, by calculating for example a probabilistic risk of a blade failure. That calculation assumes the random risk of the accident such as a lightening strike, the random wind direction that might be present that would affect the direction the damaged blade might fall in, and the random chance of a person being present where the damaged blade falls. These were argued to present a more realistic model of a person being injured by a falling blade, than the classical deterministic blade failure model. The classic deterministic model assumes the failure probability that occurs, and assumes that a person may be present in the impact area if there is no mitigating factor (fence for example) that prevents the person from being in that area.
It is important to consider how a mature industry treats the progression from a deterministic to a probabilistic safety assessment. A simplified explanation of the difference between deterministic and probabilistic risk assessment is given by the Web site http://www.preventionweb.net/risk/deterministic-probabilistic-risk Deterministic analysis is based on historical events, while probabilistic risk is based on future events that may not have happened yet. In the deterministic safety analysis in the nuclear industry for example 40, the analysis starts with identifying possible initiating events that can impact public safety, and then determines that barriers are in place to prevent the initiating event from causing a public safety impact greater than acceptable limits. The industry then proceeds to also conduct a probabilistic safety assessment 41, that considers the probability, progression, and consequences of equipment failures or transient conditions from which it derives numerical estimates to show a consistent measure of safety for the facility. The goal of the probabilistic assessment is to identify the main contributors to risk, such as for example a loss of power that results in a loss of cooling flow over the fuel, that results in overheating, so that protective barriers can be assured for the initiating event. The analysis might identify the need to ensure an additional power supply backup, or more reliable backup power transfer electrical breakers for example. Part of the goal of a probabilistic risk assessment is to identify potential accidents that have not happened. Still, the analysts must start out with a deterministic assessment to ensure protection against known accident sequences.
The critical beginning point for any safety assessment is to determine the possible initiating events, and this is why having a database of known accidents is so important.
We begin in this paper by considering real data for accidents that may harm the public. Rather than looking at hypothetical accidents, we consider ones that we have fairly good confidence of the consequences of the accident. For this we will focus on real accidents that have occurred to wind turbines in the province of Ontario.
An assessment example is presented for the case of the 2546 industrial sized wind turbines in service the Canadian Province of Ontario by June 2018. Table 1 provides data for the 7 known failures in Ontario that resulted in blade pieces on the ground.
Table 1. Failures of Large Ontario Wind Turbines| ProjectName | In ServiceDate | FailureDate | Nature of Failure | Turbine Type | Hub Height | Rotor Diameter |
| Port BurwellFailure #1 | May 2006 | April 2007 | Blade failure | GE sle1.5 MW | 80 m | 78 m |
| Prince FarmFailure #2 | Sept-Nov 2006 | Dec 2007 | Blade failure | GE sle1.5 MW | 80 m | 78 m |
| Kingsbridge IFailure #3 | Mar 2006 | April 2013 | Fire in nacelle & blades | Vestas V80 1.8 MW | 80 m | 80 m |
| GoshenFailure #4 | Jan 2015 | Aug 2015 | Blade failure | GE1.62 MW | 80 m | 100 m |
| BornishFailure #5 | Aug 2015 | Apr 2017 | Blade failure | GE1.62 MW | 80 m | 100 m |
| Raleigh (Dillon)Failure #6 | Jan 2011 | Jan 2018 | Collapse of tower, blades, nacelle | GE sle1.5 MW | 80 m | 78 m |
| Huron WindFailure #7 | Nov 2002 | May 2018 | Blade failure | Vestas V801.8 MW | 80 m | 80 m |
Failure #1. Television news broadcaster “CKNXA Channel” (now an affiliate of the Canadian Television Two (CTV 2) Network) in their news broadcast on April 28, 2007 documented blade damage in the Port Burwell wind turbine array. The news clip shows video of the reporter standing behind sections of failed wind turbine blade on the ground, with the turbine in the background. The video demonstrated that blade portions larger than the reporter hit the ground at a distance from the turbine. The newspapers “Simcoe Reformer” and “The Tillsonberg News” also documented the failure.
Failure #2. The Sault Star, Sault Ste. Marie, Ontario on February 22, 2008 documented blade damage in the Prince Wind Farm array in the news article “Wind Too Much for Turbine”. The article states, “An extensive investigation is underway to determine why the turbine sustained a damaged blade and has been inoperable for more than three weeks. "We believe the blade was damaged after the turbine shut itself down," said Jim Deluzio, general manager of Ontario Wind Operations with Brookfield Power Corp. "The investigation will look into the possibility of a defective blade. Winds were high but the blade should not have been damaged." The photograph of the turbine in the newspaper article shows a blade missing the internals.
Failure #3. A fire that destroyed wind turbine T19 in the Kingsbridge I wind turbine array in April 2013 was documented in a presentation by the site manager of the array operator to the Township of Ashfield-Colborne-Wawanosh municipal council on April 2, 2013. The Council minutes record, “Dan Hayden of Capital Power addressed Council in regards to the fire at the Wind Turbine early this morning, and gave a detailed verbal report.” Citizens present at the council meeting note the report documented that burning portions of the wind turbine (nacelle and/or blades) extended beyond 200 metres from the wind turbine tower. (Figure 3)
Figure 3. Kingsbridge I – T19 Apr 2, 2013 - Used with permission of Michael Leitch
Download figure
Failure #4. The London Free Press, on August 4, 2015 documented failure of a turbine blade in the Goshen wind turbine array, noting, “Closer to London, officials from wind-energy giant NextEra Canada are investigating what mangled one of their turbines southwest of Exeter late Sunday or early Monday morning. One of the giant 50-metre-long blades on the turbine appeared to have snapped on the turbine tower that is part of the Goshen Wind Farm in South Huron.” Figure 4 (photographed within 24 hours of the failure) makes it clear that little of the blade internals remained with the turbine, but they were on the ground. The Figure also shows the array output at the time of the failure.
Figure 4. Goshen Wind Array, Turbine #85 Failure and Output Just Before Failure
Download figure
Failure #5. CTV News documented failure of a Bornish wind turbine as having occurred on April 20, 2017. The documentation included photographs showing the damaged blade, without the internal structure. (Figure 5)
Figure 5. Bornish Wind Turbine – Used with permission of Scott Miller CTV News
Download figure
Failure #6. Both Canadian national television networks CBC and CTV documented the collapse of a Raleigh (formerly known as Dillon) wind turbine early in the morning of January 19, 2018. The company later reported that the cause of the turbine collapse, which buckled the support tower in the middle, resulting in the nacelle and all blades on the ground, was as reported by CTV News “a single faulty blade.” The Sygration.com 42 chart of the Dillon Wind Power Array output for January 18 & 19, 2018 is shown as Figure 6A and the Raleigh Wind Farm Weather Conditions as Figure 6B. The electrical output shown on the Sygration.com site is derived from the public information published by the Ontario Independent Electrical System Operators (IESO) in the Generator Output and Capability reports. 43 The Electrical Output chart shows a drop in output consistent with the wind speed drop shown in the Raleigh Wind Farm Weather conditions monitored at the Ridgetown Environment Canada monitoring site (shown as R on the chart) located about 10 km east of the turbine array, and the Chatham-Kent Environment Canada monitoring site (shown as CK on the chart), located about 10 km west of the turbine array. The Environmental Canada Historical Data available by site and date 44 shows a wind speed reduction for these sites at about midnight on January 18 (the 24 hour time on the chart), and the array output is seen to reduce to zero as the wind speed picked up the next morning, when the turbines were taken out of service.
Figure 6A. Raleigh (formerly known as Dillon) Electrical Output Jan 18, 19, 2018
Download figure
Figure 6B. Raleigh Wind Farm Weather Conditions, Jan 18 & 19, 2018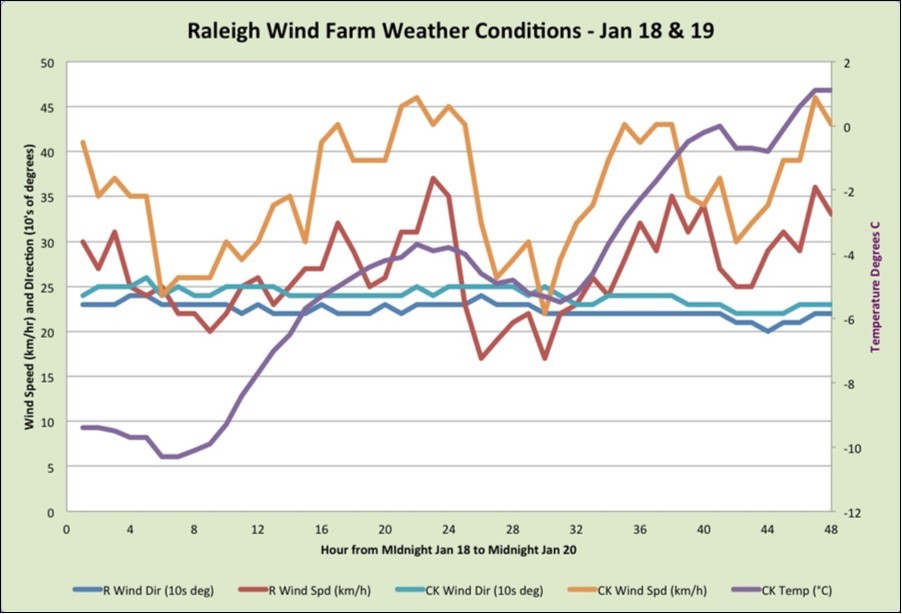
Download figure
Failure #7, of a Huron Wind Array turbine occurred on May 4, 2018. It was possible for the author to photograph the failed turbine within hours of the failure, and to map out the debris field early the next morning before any debris collection had occurred.
The debris field was generally downwind of the turbine, in the direction of the wind at the time of the blade failure. Mapping major debris showed:
No debris from the tower to a distance 150 m from the tower.
Debris 1.2 m x 3.6 m at a distance 150 m from the tower.
Debris 1 m x 3.6 m at a distance 170 m from the tower.
Debris 1.2 m x 3.0 m at a distance 210 m from the tower.
Debris 1.2 m x 3.0 m at a distance 280 m from the tower.
Debris 1.0 m x 0.15 m at a distance 560 m from tower.
Minor debris pieces (smaller than about 0.2 m x 0.2 m) were seen scattered through out the debris field at distances from 150 m out to about 600 m. (Figure 7)
Figure 7. Huron Wind Blade Failure Debris Map
Download figure
Finding 3 - Calculation of Wind Turbine Failure Rates
Calculation of valid and reliable wind turbine failure rates requires a criterion supported by three aspects:
A clear understanding of what failure rate is being tracked. For this study the data to be tracked is the simplistic frequency in events per turbine year in operation of industrial sized (greater than 50 metre hub height, and greater than 40 metre rotor diameter) wind turbine failures that result in blade pieces falling to the ground. These may result from blade failures, tower collapse, nacelle or rotor collapse, or fire that causes burning blades so that burning pieces may fall to the ground.
Detail of the specifics of the failed wind turbine – size, type, and time in service.
Details of the exposure time in service.
The reason for tracking the exposure time for the failed turbine is to be able to make an assessment of the failure compared to the well-known “bathtub” curve of failure rates. A description of this may be found in the papers:
“The Bathtub Curve and Product Failure Behaviour” – Part One – The Bathtub Curve, Infant Mortality and Burn in. 45
“The Bathtub Curve and Product Failure Behaviour” – Part Two – Normal Life and Wear-Out. 46
A simplified version of “The Bathtub Curve” for failure behavior is shown in Figure 8.
Figure 8. Bathtub Curve – Product Failure Rate
Download figure
The figure shows that when a component is new, or a new design is introduced, the failure rate is typically higher during the prototype testing. At some time, the failure rate will have reduced to what is considered an acceptable value for commercial use, and the component is released for use. However, for demanding use, commonly known as “Mil-Spec” the end user may demand that the initial burn in period is extended until the failure rate falls to a constant rate, where failures are dominated by random (or chance) events, rather than the higher rate for a new component. The useful life of a component is usually considered to be bounded by when the failure rate starts to increase due to wear out. Depending on the user, the end of life is determined to be when the failure rate rises to what is considered to be their limiting value. For demanding users, this may be when the failure rate just starts to increase, while for some commercial users, a higher failure rate may be considered as economically acceptable.
In a similar manner as to tracking the lifetime failure rate of components in a nuclear plant, it is important that the failure data be for similar components so that the results can be representative. For example while early wind turbines had rotating blade tips for their braking system, modern turbines (constructed in the last 15 years or so) no longer use rotating blade tips, so failures caused by that component are not really relevant.
Similarly, since the Caithness Windfarm Information Forum database tries to collect any information about a wind turbine failure from public news sources, it may include information about smaller turbines as installed by a single resident. It is not really representative to include failures of a 10 kW machine with a 10-metre blade diameter with larger MW class turbines when calculating failure rates.
Some papers have presented information about the desirability of being able to specify accident modes more precisely, so as to be able to prepare a detailed probabilistic risk assessment, to show the true root cause of a consequential failure. While this is a desirable objective, unfortunately the information available in public databases is not sufficiently detailed to be able to determine the root cause in most cases. As an example of the lack of data we will consider the failure in January 2018 of a GE 1.5 MW wind turbine in the Raleigh Wind Power Array in Chatham Kent, Ontario. 47 This was a turbine with a 1.5 MW generator, a nominal 80-metre hub height, and a nominal 78-metre rotor diameter. It was placed in service in January 2011. The failure, resulted in a buckling of the turbine support tower, so that all blades, and the nacelle could be seen in a report and photograph on both the CBC and CTV National News as catastrophically damaged at the base of the tower. After investigation, the operator, TerraForm Power reported that “a single faulty blade” caused the wind turbine to collapse. 48
In general terms, the public CWIF database could only say, “tower collapse” as in the news media report. Even the manner in which a “single blade failure” might result in the tower collapse was not reported in any further detail. To properly prepare a fault tree based risk assessment, one could report the cause of a tower collapse in many ways, as was done in the paper “Towards analyzing public safety risk from wind turbines” 36 published January 2018 in the Journal Reliability Engineering and System Safety. That journal article identified the event “collapse of tower” (a failure somewhere along the tower length) as opposed to a “toppling of tower” (due to a break at ground level or a mounting failure) as possibly arising from one of three possibilities:
Fatigue of material, from any of four possibilities:
Higher loads attributed to wake effect
Excessive “fibration” (vibration?) attributed to wind loads
Airflow load from blade swinging along tower
Production faults in steel
Extreme loads, from either of two possibilities:
Typhoon / Tornado
Earthquake
Blade hits tower, from any of three possibilities:
Loss of a blade
Partial blade break
Extra bending of the blade attributed to turbulent wind
Presumably, a more detailed fault tree might also include these other possibilities for a tower collapse:
Overspeed of blades, resulting in blade tip contacting tower arising from:
Brake failure following separation of turbine from electrical grid.
Gearbox failure, resulting in rotor speed increasing.
Control system failure allowing non-asynchronous turbines to accelerate.
Control system failure allowing an asynchronous turbine to overload, increasing blade bending until contact occurs.
Overload of turbine, increasing blade bending, resulting in contact from:
Cold weather operation, increasing air density.
High winds coupled with control system failure to shutdown turbine.
Because not all of the wind turbines in Ontario were placed in service at the same time, calculation of the failure rate needs to consider both the time in service at the time of each failure, plus the total time in service of Ontario wind turbines at the time of the failure, as shown in Table 2.
Table 2. Failure Rates at Times of Ontario Turbine Failures| Project Name, Failure #Failure # is “r” in rateformulas | In Service Time when Failure Occurred (years) | Total Ontario Turbine Years in Service (T) at Time of Failure | Arithmetical Failure Rate Number of Failures (r)T | 50% Chi-Squared Confidence LevelFailure Rate Χ2 α, 2r+2 / 2T | 90% Chi-Squared Confidence Level Failure Rate Χ2α, 2r+2 / 2T |
| Port BurwellFailure # 1 | 0.9 | 251.0 | 0.00398 | 0.00669 | 0.0155 |
| Prince FarmFailure # 2 | 2.1 | 460.5 | 0.00434 | 0.00239 | 0.0116 |
| Kingsbridge IFailure # 3 | 7.0 | 4461.2 | 0.00067 | 0.000823 | 0.00150 |
| GoshenFailure # 4 | 0.6 | 8126.8 | 0.00037 | 0.000574 | 0.000984 |
| BornishFailure # 5 | 2.7 | 12000.1 | 0.00042 | 0.000472 | 0.000773 |
| Raleigh (Dillon)Failure # 6 | 7.0 | 13863.0 | 0.00043 | 0.000481 | 0.000760 |
| Huron WindFailure # 7 | 15.4 | 14690.3 | 0.00048 | 0.000522 | 0.000801 |
In Table 2, not only is the arithmetic failure rate shown, but also the statistical Chi Squared Confidence Level value of the failure rate. Use of the Chi-squared value helps to give an indication of the confidence that the actual failure rate will be represented by the value shown. The 50% confidence level (α) means that we are confident that the failure rate shown will be smaller than the value shown 50% of the time, and will exceed the value shown 50% of the time. The 90% confidence value means that we are confident that 90% of the time the failure rate will not exceed the value given. The data in the table shows that when the number of failures is low, and the total years in service value is also low, the Chi-squared confidence level failure rate will be quite a bit higher than the pure arithmetical failure rate. However, as the number of failures grows, and the total years in service grow, then the Chi-squared confidence level failure rate becomes closer to the arithmetical failure rate.
The failure rate for the arithmetical value and the Chi-squared value against the years in service is shown in Figure 9.
Figure 9. Arithmetical and Chi-Squared value for Ontario Wind Turbine Failures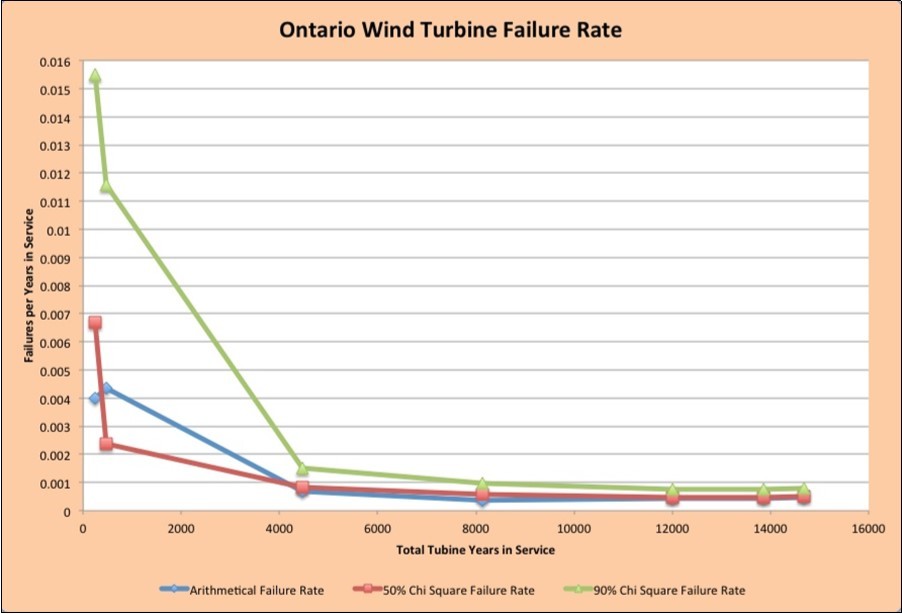
Download figure
Figure 9 shows that the failure rate is fairly constant for the Total Turbine Years in Service above about 4000 turbine years. This suggests that the amount of data is sufficient to predict the failure rate, and that the failure rate is in the random failure (or normal lifetime) period.
A simplified overview of the calculation of confidence levels is given in the somewhat dated book from 1974 titled, “Pocket Handbook on Reliability” 49 issued by the Chief of the Reliability and Maintainability Division of the US Army Aviation Systems Command, noting it is an education handbook for engineers and managers who do work directly in reliability and who must communicate with other individuals who do likewise.
Failure Rate = Χ2α, 2r+2 / 2T
Where Χ2is the Chi Squared Value (which may be determined from tables or computer calculation) for the confidence level α, for the case of 2r+2 “degrees of freedom”, and r is the total number of failures occurring in time T.
Finding 4 - What Does a Failure Rate Number Mean to us?
When we look at the 50% Chi Squared Value of the failure rate after 7 failures, we read it is 0.000522. Taken another way, the reciprocal suggests the mean time between (wind turbine) failures (MTBF) in Ontario is (1 / failure rate), or 1915.7 turbine years. The data is showing that we can predict that a turbine failure occurs in Ontario about every 1915.7 turbine years in a fleet of 2546 turbines (possibly somewhat sooner 50% of the time, or possibly somewhat later 50% of the time, although the level nature of the data, and the closeness of the 90% confidence curve suggests the prediction is reasonable). Alternately we see that on average, the expectation is one turbine failure every 9 months for the province of Ontario. Another way of looking at this is to say that in a moderate sized turbine array of 75 turbines, the expectation is for one turbine failure every 25 years. To understand how we perceive these sort of numbers, we have to turn to our human nature.
Statistics Canada tells us there are about 14 million people in Ontario. For a population of that size, a frequency of one wind turbine event in nine months appears negligible, and there is little probability for these failures to be discussed as a provincial priority. Provincially, we focus instead on more frequent occurrences that impact more of the population rather than on individual risk. For example, the statistics for 2016 50 show 483 persons killed that year in 35,972 fatal and personal injury motor vehicle collisions. The same data shows that 1 in 20,000 drivers can expect to be killed in a motor vehicle accident per year. That is the sort of figure that gets provincial attention. However, there are factors that influence the probability of being involved in a motor vehicle related death. Drinking and driving, inattentive driving, speed-related collisions, and not wearing a set belt are (in total) related to 67% of the road fatalities. Thus the choices a driver makes can impact the probability of an accident. (Even when sometimes it is the “other driver” in the collision who is the cause.) Even choosing when to drive, such as considering the weather conditions, can be an important factor. If the roads are icy, or fog shrouded, a cautious driver may delay a trip that is not an emergency. The same cannot be said for wind turbine accident probabilities that the potential victim has no control over, although the cautious neighbour may choose to not walk on their own property if the wind is high. That raises a different legal question about being deprived of the enjoyment of use of property for those living near wind turbines.
Another example shows that it is not only high frequency events like highway accidents that garner provincial attention. A paper 51 published in 2014 examines all deaths caused by anaphylaxis in Ontario for a 25-year period. In those 25 years, the authors found that of the 92 deaths related to anaphylaxis, 12 of those deaths related to youth less than or equal to 18 years of age, while the majority related to adults. Peanuts and tree nuts related to less than 25% cases, while insect venom, reactions to medication, foods other than nuts, and unclear causes represented the bulk of the cases. The website, Food Allergy Canada 52 estimates that almost 500,000 children in Canada have food allergies and that peanut allergy in Canada affects about 2 in 100 children. From this, we might expect about 200,000 children in Ontario to have food allergies. This is of a population up to age 19 in Ontario of 3,019,640. 53 The frequency of death of youth due to anaphylaxis is less than 1 in 2 years, or 1 in 400,000 exposure years of potentially impacted children, a frequency of 2.5 x 10⁻⁶. To protect vulnerable members of society subject to this accidental rate, every school, and many recreational facilities that one may enter in the province of Ontario has a sign on the door noting that the facility is “nut-free” or at the very least, “nut-aware”. Ontario passed “Sabrina’s Law” in 2005 “Bill 3: An Act to Protect Anaphylactic Pupils” which applies to all publicly funded schools in Ontario to protect children from food allergies requiring every school board in Ontario establish and maintain an anaphylaxis policy to help students with serious allergies. 51 Society does recognize the need to protect vulnerable members from some causes for an event with a frequency of 2.5 x 10⁻⁶ for impacted children.
Meanwhile the 2546 wind turbines currently in Ontario are permitted by regulations to be installed as near as blade length + 10 metres from roadways or the lot lines of neighbours when the failure rate experienced in Ontario is 5.2 x 10⁻⁴ that have put blade parts on the ground. Neighbours of those wind turbines are protected by standards that exhibit a different level of care. The neighbours are expected to voluntarily avoid the part of their property that is next to the wind turbine sites where those blade parts may fall. Similarly, the protection for the 6,550 daily drivers on provincial highway 21 that pass the location shown in Figure 1054 expects them to heed the blue sign that states in print too small to be read from a vehicle, “Caution – During potential icing conditions stay back 305 metres from wind turbine.” Yet, the highway edge is about 121 metres from the wind turbine, so compliance would mean the driver could not travel down the highway, yet the highway is not closed.
Figure 10. Turbine highway icing caution. Blue Sign Reads “CAUTION – DURING POTENTIAL ICING CONDITIONS STAY BACK 305 METRES FROM TURBINES”
Download figure
The literature review identified few references specific to the relationship between wind turbines and highway safety. A recommendation issued to the Dutch Society for Energy and the Environment (NOVEM) in 1992 55 related mostly to the installation of guardrails to prevent drivers hitting wind turbines very near to the highway. There were no considerations in the paper of objects or ice falling from the wind turbine other than for collision with ice or parts that had already fallen. The paper did identify potential concerns from noise impacting signals, air turbulence, flashes and glare, or distraction of the driver. A paper in 2012 56, considered risk assessment of wind turbines close to highways, concluding that the risk of being hit by wind turbine material or ice was very low compared to the statistical risk of losing one’s life in an accident along the highway. Finally a 2017 paper 57 studied driver behavior in an already industrialized location in Rotterdam after the installation of wind turbines. The authors found the mean speed of drivers was lowered, but the standard deviation of the vehicle speeds increased significantly. They also found that drivers shifted their travel position in the traffic lane to be further away from the wind turbines. While little immediate adverse effect was noted, the authors recommended continuing the study.
As final examples of the difference in protection afforded different hazards, a driver of a motor vehicle in Ontario is not allowed to smoke in the vehicle if there is a child on board. Similarly a smoker is not permitted to smoke in a public building, or within 9 metres of any entrance. Yet, a property owner can sign a lease to site a wind turbine on that property waiving any setback protection, even though there may be vulnerable age children living in the home on the property, there may be employees of the lease holder working on the property, or delivery couriers may have to deliver to the property. These vulnerable people will be put at risk without their permission by the lease signed by the property owner.
These differences demonstrate that the hazards posed by wind turbines do not generate the same level of concern as other issues. Unfortunately for those living near wind turbines, driving on the roadways beside them, or for the children living in homes where the owner has signed a lease permitting wind turbines on the property, their numbers are not a big part of the general population. The small minorities who are impacted without protection are expected to voluntarily tolerate the risk that is not faced by others as part of their daily life. It becomes a justice issue as to why a few are placed under increased risk due to inadequate protection policies.
Finding 5 - Contribution to Public Safety Risk due to Ice from Turbines
In addition to the 7 identified wind turbine failures in Ontario, each wind turbine array in cooler climates may be susceptible to icing a number of times during the winter or early spring. The subject of ice falling from stopped wind turbine blades, or being thrown from moving wind turbine blades has been extensively studied. Early work 58, 59 identified a model for calculation of ice travel distance, and used a Monte Carlo analysis to determine the risk of hitting a person standing in a particular location. Initially a “safe” distance of 230 metres was suggested, beyond which ice would not be thrown. The work developed into an IEA (International Energy Agency) Working Group, the “Wind Energy Production in Cold Climate” group that met periodically at BOREAS (the Greek God of the North Wind) Conferences. 60, 61 As the models became more developed, it was possible to identify a risk of 10-6 occurring at a distance of 350 metres from the turbine tower, and a risk of 10-4 at a distance of 225 metres. A simplified empirical model was developed which suggested an ice throw distance of d = 1.5 x (D+H) where d is the ice throw distance, D is the rotor diameter, and H is the turbine hub height when a turbine is operating, or d = v x (D/2 + H) / 15 where d is the ice throw distance, v is the wind speed (in metres / second), D is the rotor diameter and H is the hub height when a turbine is shutdown. These become known as the Seifert model, from the name of the originator. Further work suggested 62 that “according to a risk assessment the danger to get hit by a piece of ice from a wind turbine can be quantified as considerably low to individuals and objects beyond distances of 200-300m.” A turbine manufacturer issued an advisory notice 63 quoting the formula from the Wind Energy Production in Cold Climate for a safe distance of 1.5 x (hub height + rotor diameter), and noted this was recommended by Germanisher Lloyd as well as the Deutsches Windenergie Institut (DEWI), but added the actual distance was dependent on turbine dimensions, rotational speed, and other factors.
Early Ontario experience documented ice falling from a Tacke TW600 wind turbine in Bruce County. This turbine had a 50-metre hub height and a 42-metre rotor diameter. The experience was documented in a Garrad Hassan report 64 prepared for the Canadian Wind Energy Association (CanWEA) for 13 events from 1995 to 2001. From that report, we read:
10 Jan 1998 - “There was some ice build up on blades during a freezing rain event, all ice fell off and unit ran OK” “Many ice pieces, largest piece was 12x12x2 inches, pieces up to 100 m from tower”
23 Feb 1996 - “About 1 ton of ice on ground. During my weekly inspection, found many pieces of ice at base of windmill. Pieces of ice had same curve as blade therefore these pieces of ice came from the leading edge of the blade. Estimated about 1000 pieces on ground. The largest pieces were 5 inches long 2 inches thick and 2 inches wide. The pieces were scattered up to 100 meters from base of windmill in same direction as blade arms were pointing – this was in the north-south direction as the wind was coming from the east. Most pieces were found within 50 meters from tower base”
Research in Europe continued to refine the ice throw / ice drop models. 65, 66 The 2010 report from VTT Finland noted that during cold weather operation a notable occurrence was the over-rating of turbines. The example was given of a 600 kW Tacke turbine in Ontario that showed output of 950 kW during -20°C weather resulting in the generator overheating and tripping out. A thorough review in 2011 for Nordic Energy Research shows the diversity of opinions and evidence about ice throw / ice drop. The report identifies first (page 34) that “The majority of recorded fragments of ice shed from wind turbines shows they have landed less than 100 m from the turbine.” (Quoting from the Garrad Hassan report of 2007 for CanWEA for a 50-metre turbine hub height with a 42-metre rotor diameter.) The next paragraph states, “Ice throw (shedding) has in Canada been a question of public safety in the regulatory process of wind farms. Thus measures have been taken in order to enable wind power development. In 2007 CanWEA suggested a minimum distance of blade length plus 10 metres from public roads, non-participating property lines and other developments to ensure public safety in the event of ice shedding.” On the next page, the report states, “In Finland two risk analysis’ of ice throws has been carried out in the last years by Ramboll.” The report then presents it’s Figure 6, to show, “In Rauma the conclusion of the work was that 70% of the ice pieces will be thrown 270 metres from turbines at the most.” The figure shows that 70% of the ice pieces corresponds to 6640 pieces. However, although 70% of the ice throw events are within 270 metres, the remaining 30% of the pieces (2875 pieces) extended out to 770 metres, with 15% of the pieces landing from 410 metres away from the turbine tower out to 780 metres.
The series of photos in Figure 11 shows ice falling from a shutdown Vestas V82 turbine with an 80-metre hub height and an 82-metre rotor diameter in Bruce County on April 12, 2013. Ice was falling in contiguous pieces over 50 cm x 20 cm to the ground, landing at locations 50 to 55m from the tower. The nearest Environment Canada weather station at Wiarton, Ontario 67 shows the wind there was about 22 km/hr. (~ 6.1 m/s at the 10 metre level) during the time when video was recorded from which the time lapse photography was derived. The day was grey, and wind shear would likely have been low, suggesting a hub height wind speed of about 8.5 m/s. (6.1 m/s x (80m/10m)0.16 ) Measuring the time from videos for the ice falling time showed the time from ice coming off the blades to hitting the ground was about 6.5 to 7.5 seconds. This would be consistent with the displacement from the tower as an average wind speed of 7 m/s x 6.5 to 7.5 seconds would result in a displacement of about 45.5 to 52.5 metres. With only a moderate increase in wind speed, or wind shear, or in the presence of a stable atmosphere the ice pieces would be carried horizontally a greater distance, or if the turbine was operating as may have been experienced with a considerably smaller turbine in the example of the Tacke TW600 turbine previously discussed. Today’s taller turbines will permit a longer drop time, and thus further horizontal displacement, even if the wind turbine is initially shutdown. It is notable that many of the ice sheets coming off the blades that carried away from the stopped turbine were hitting the ground intact, in contiguous pieces, rather than being broken into smaller pieces as suggested in the 2011 review for Nordic Energy Research. 66. Pieces falling under the blades were often seen breaking into smaller pieces due to contact with the tower. This observation is consistent with that reported in the 2010 VTT “State of the Art Review” 65 of the IEA Task 19, “The experience and the results of many calculations show that during the operation small fragments are hitting the ground in a longer distance than large pieces whereas from stopped turbines the larger pieces can be transported wider than small ones.”
Figure 11. Time Lapse – Circled Ice Falling from Stopped Turbine in Bruce County
Download figure
Another sequence of photographs of ice on GE 1.5 MW sle turbines in Dufferin County, Ontario was taken on January 10, 2010 as shown in Figure 12. The photographs show locations on the turbine blades from which ice has fallen, and show a school bus passing down a roadway setback about 66 metres from turbines that were shedding ice. It is of concern to compare this setback distance with the data in the research at the Rauma site in Finland, 66 where 70% of the ice travelled 70 metres or more.
Figure 12. Icing of GE 1.5 sle turbine – Used with permission of Michael Pobjoy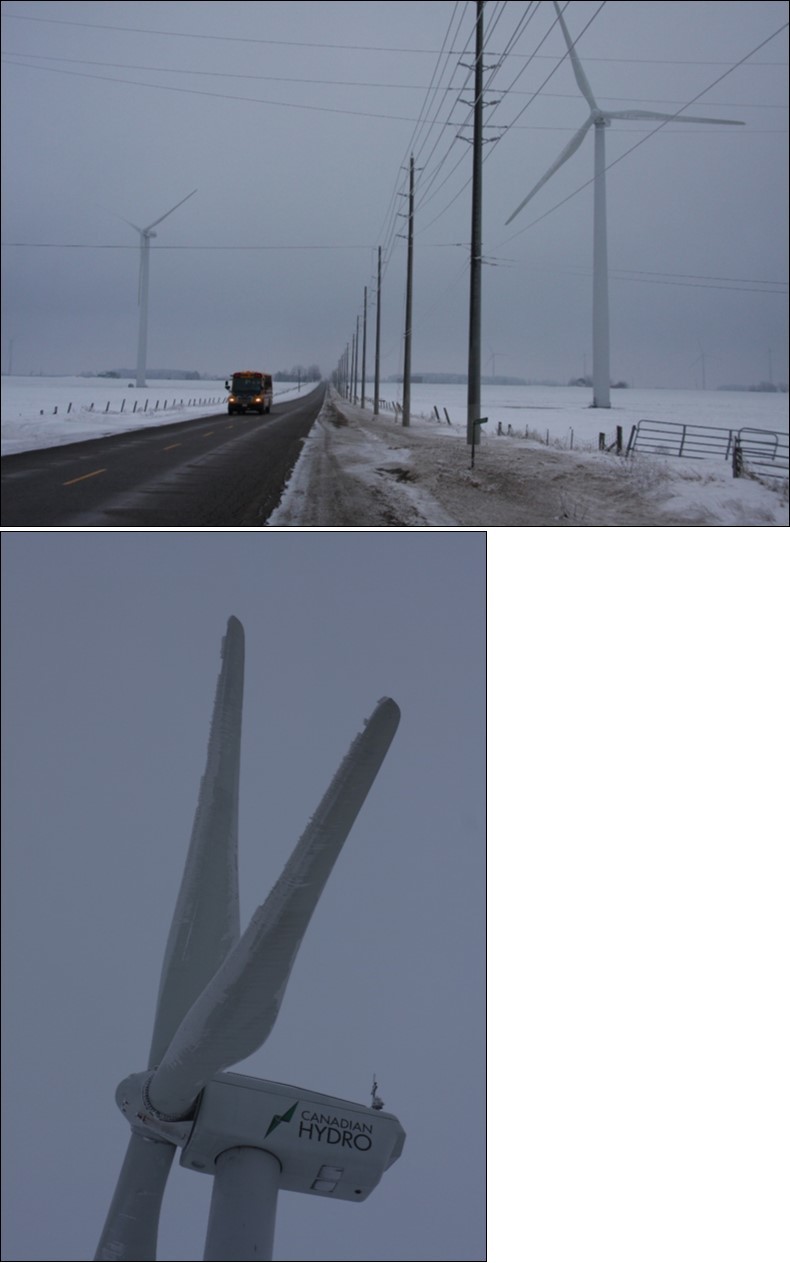
Download figure
A possible explanation for the small setback distances might be gained from the Master’s Thesis of Marmutova 68 in Finland, who notes that the primary goal in consideration of turbine icing is to estimate production losses, while considerations for ice to hit persons is a secondary concern. A Swedish “Elforsk” report on Icing of Wind Turbines 69 reinforces the different perceptions of loss of production, noting, “The overall goal is to increase the ability to estimate electricity production from the turbines in areas at risk of icing of blades...” The report goes on to identify “Future Research Needs” to include under the heading “Safety Issues” the statement, “There is a clear need to carry out more experimental studies in order to better understand the characteristics of ice throw.” Additionally, the report states,
“the major drawback of using the (Seifert) formulas (for ice shed) is the fact that the dependency of the ice throw risk on the wind statistics under typical icing conditions is neglected.”
“the effect of breaking ice while flying through the air has not yet been examined.”
“there is a clear lack of validation data for the simulation results.”
Periodic reports from the IEA Wind Task Force 19, State of the Art of Wind Energy in Cold Climates continue to be issued 70, That report noted for a Swiss Alpine site, “The ice detector inter-comparison has shown surprisingly poor results so far; no device has been able to measure icing correctly for a whole winter season. The monitoring of the wind turbine pointed out deficiencies in ice detection as well as blade heating performance. The paper notes on page 57, “Turbines with or without blade heating systems, pose a risk in the form of thrown ice. Irrespective of whether turbines are equipped with blade heating systems, warning signs should be used. Signs should be located at least with the distance of 1.5*(hub height + rotor diameter) from turbine in all directions.” The paper then follows on page 58 to note, “Canadian Wind Energy Association (CanWEA) ordered from Garrad Hassan Canada Inc. (GHC) a study including firstly recommendations for assessing the risk of ice fragments shed from wind turbines striking members of the public in the vicinity of wind farm projects in Ontario.” The report does not comment on the difference between the recommendation it makes on page 57 for signs posted at 1.5*(hub height + rotor diameter) and the report of Garrad Hassan that recommends a setback of (blade length+10m) that was accepted in Ontario regulations. For wind turbines currently approved in Ontario, this can mean a difference of recommendation in accordance with the IEW Task Force 19 of 300 metres for safety signage, versus an actual setback of 93.1 metres to a municipal roadway, and 82.1 metres (27% of the IEA recommendation) to the lot line of a neighbour.
The recommended work in references 69 and 70 for prevention of icing of wind turbine blades, and the de-icing of blades where icing has occurred has been discussed in a number of papers. A paper published in 2016 points out the work is still ongoing 71. That paper’s conclusion begins, “No proven reliable anti-icing and de-icing systems for wind energy industry are yet available on the market. Further testing is required to increase the reliability and safety design of these systems.”
An assessment of the impact energy required by ice or debris falling from wind turbines to injure an unprotected human, or passengers in a motor vehicle was summarized in a presentation at IWAIS 2015, the 16th International Workshop on Atmospheric Icing of Structures. 72. Somewhat more detail is given in the authors’ companion presentation titled, “Methods for evaluating risk caused by ice thrown from wind turbines,” presented at Winterwind 2015, Piteå, Sweden 73.
The IWAIS paper quotes from earlier work that an unprotected human is at risk of fatality if hit by a piece of ice with kinetic impact energy above 40 Joules, and weight above 100 g. They also show that a car window can be broken by impact energy above 140 Joules, so they estimate that a driver or passenger could suffer a fatality caused by the ice alone if it has an energy exceeding 180 joules. (This neglects a possibility of fatality caused if a car windshield breaks in front of the driver resulting in an accident, even if the ice does not itself have sufficient residual energy to injure the person.) The Winterwind presentation is somewhat less restrictive stating a “Falling ice fatality potential” of:
40-60 J: Serious injuries to forehead
>80 J: Serious injury to body.
The Winterwind presentation goes on to state; the impact energy depends on ice density, mass, and velocity. Impact of 40 J corresponds to:
200 g of ice falling from 30-50m
500 g of ice falling from 5-6m
To perform a quick verification calculation an ice piece 10 cm x 10 cm x 2 cm was assumed (mass about 0.18 kg) to fall from the hub height of an 80 m wind turbine. The calculation neglected wind speed, any contribution from moving blades, and air resistance to slow the acceleration. Anyone who has “skipped” a flat pebble across the surface of a pond can testify as to the effect of the impact of spin on the object, or the difference between throwing the pebble so the “thin side” of the object cuts through the air, as opposed to the “flat side.” As stated, this was only a quick verification calculation.
Simple acceleration due to gravity tells us that the distance travelled “s” is a function of the original velocity “V0”, the (constant) acceleration due to gravity “a” and the time the object falls “t”.
S = V0t + ½ at2
Substituting actual falling distance 80 m = 0 + ½ x [ 9.8 m/s2 ] x t2
Solving for t, t = 4.04 seconds
Thus, velocity at impact = V0 + [ 9.8 m/s2 ] x 4.04 s
= 39.6 m/s
Hence energy at impact = ½ x [ mass x velocity2 ]
= ½ x [ 0.1 m x 0.1 m x 0.02m x 917 kg/m3 ] x ( 39.6 m/s )2
= 143 Joules
Thus we confirm that a piece of ice smaller than observed falling from wind turbines can hit the ground with sufficient energy to kill an unprotected person, assuming the 40 to 60 joule impact fatality range, and potentially able to break a vehicle windshield.
As a check to verify the ability of 40 to 60 joule range to result in a fatality, a calculation was made to show the height that a concrete block (18 kg in mass) could be dropped from to hit the ground with energy of 40 to 60 joules.
Similar to the calculation shown above, for energy at impact of 40 joules, and a concrete block mass of 18 kg solving we find:
Energy at impact = ½ x [ mass x velocity2 ]
40 Joules = ½ x [ 18 kg x velocity2 ]
Since the units of Joules are [ kg x m2 ] / s2
Velocity = 2.1 m/s
Then, since velocity at impact = (2.1 m/s) = V0 + [ 9.8 m/s2 ] x t
Solving we find: t = 0.21 s
Thus, distance the concrete block must fall is found from:
S = V0t + ½ x [ 9.8 m/s2 ] x [ 0.21 s ]2
S = 0.22 m
The reality check is, if a concrete block is dropped 0.22 metres onto a person’s head, could it be fatal? Even with little knowledge of the anatomy of a skull, it seems to be a reasonable assumption, particularly if the falling object has any sharp edges, such as an ice fragment from a wind turbine blade. That means the ice drop of larger pieces than required to yield a 40-Joule limit which have been observed falling a distance from wind turbines are indeed a hazard to protect against, and cannot be ignored.
A poster presentation 74 at WindEurope Summit in 2016 discussing ice throw risk, begins stating, “Ice throw from wind turbines is a serious hazard.” While discussing personal injury from ice hitting a person, the presentation introduces the concept of “minimum endogenous mortality.” The presentation notes this concept then can provide a limit for mortality caused by a new technology that “should not exceed 1*10-5 death per person and year.” The presentation goes on to note, “Alternatively the accepted death risk is regarded to depend on the amount of voluntariness and the amount of possible personal influence associated with the activity. If the possibility to avoid a risk approaches zero or if the risk is not taken voluntarily, the acceptance decreases. Here the minimum accepted risk reaches 1*10-5 death per person and year, in the worst case, which is similar to the minimum endogenous mortality defined before.” We are reminded of the earlier reference to the writing of Starr in 1969 2 discussing the acceptance of involuntary risk.
The body of knowledge concerning ice throw hazard continues to grow. A paper presented at the WindEurope Conference & Exhibition in 2017 75 provides useful insight into understanding and acknowledging the ice throw hazard, as does the 2017 report of the IEA Expert Group Study on Wind Energy in Cold Climates 76. The first paper notes that “apart from the moral obligation, there is a judicial and economical responsibility, since criminal and compensatory liability depends on the commitment to perform effective risk mitigation efforts.” In discussion of the “Basis for liability” the paper writes, “the licensee may be held liable despite fulfilling all public law requirements.” (This is discussing a Norwegian example.) The distances for ice throw (140 metres) shown in the paper for a Vestas V90 turbine are considerably higher than the values of blade length + 10 metres (55 metres for this turbine) described earlier that were recommended by CanWEA in 2007 “in order to enable wind farm development” that were adopted by the Canadian province of Ontario.
Finding 6 - Flaws in calculation of Risk from falling Ice or Blades
Many papers perform a calculation to determine the risk of a wind turbine accident to harm a member of the population. The “Dutch Handbook” Handboek Risicozonering Windturbines 10, identifies in its Table 4 that “vulnerable objects” such as homes, hospitals, and schools are to be maintained outside a 10-6 risk contour, which they identify as the larger of (mast height + ½ rotor diameter) or the maximum casting distance at nominal speed. The latter value varies depending on the turbine specifics, but they define in Tables 2 and 3 of the Handbook the Local Risk (PR) for International Electrotechnical Commission (IEC) Category 1 (high wind speed turbines) and Category 2 (average wind speed turbines). They define PR as “risk of a place outside an establishment, expressed as a probability per year that a person who would stay uninterrupted and unprotected at that place, dies as a direct result of an unusual incident within that establishment.” In this case, for the PR = 10-6 contour a calculated value for the maximum casting distance at nominal speed for a 3 MW turbine with a 120 metre hub height as 193 m for an IEC Category 1 (high wind speed turbine) and as 216 m for an IEC Category 2 (average wind speed turbine.) One might argue those calculated values based on actual experience. The Ontario Failure # 7 described earlier of the Huron Wind turbine with an 80 metre hub height and 80 metre rotor diameter (for which the nominal mast height + ½ rotor diameter would be 120 m) or for which the value in the Handbook Tables 2 and 3 would be 175 metres for an IEC Category 2 turbine, a blade piece 1.2m x 3m travelled a distance of 280 metres from the tower, yet a piece 1 m x 0.15 m travelled a distance of 560 metres from the tower. The 10-6 risk contour for human fatality is a useful beginning point for risk comparisons. It is a value used in other industries as well.
However, many wind turbine risk assessments have a logical shortcoming that adversely impacts their calculation. A common manner of performing the calculation of individual risk used in many papers is to assume a standing person occupies only a small portion of the total exposure area, so the risk of striking the person is proportionally smaller than if the person was everywhere that a falling object might land. As an example the Garrad Hassan Recommendations for Risk Assessments of Ice Throw and Blade Failure in Ontario 64 calculates individual risk for ice throw by saying the individual can be in any of the risk areas between a radius of 50 metres (the nominal exclusion zone for the public they use) and a radius of 300 metres which they show as the limit for ice throw from a Monte Carlo calculation. It argues that if the ice can fall anywhere in that annular space with a total area of 275,000 m2 then the risk of ice fall is the same for all of those areas, but the individual could only be in 1 m2 so the risk of hitting the person is reduced by a factor of 1/275,000 times. The calculation in that report assumes a “moderate” value of ice strikes per square meter per year at 50 metres from the tower of 0.002 times and then multiplies that by the total risk area of 275,000 m2 to obtain a risk of being struck per year.
The calculations then determine an Individual Risk of IR as follows:
IR = 0.002 (strikes per year / m2) x (1 / 275,000) x 275,000 m2
= 0.002 strikes per year
(or 1 strike in 500 years).
Similar calculations in other papers use an individual forehead area of 0.1 m2 as the potential area of impact to be able to reduce the risk by a further factor of 10.
The logical flaw is the assumption that the ice falls equally distributed around the turbine in any ice fall incident. In reality, as was demonstrated by the photo time sequence in Figure 11 of this paper, the ice fall is not equally distributed over the entire area, but is concentrated in a downwind sector. This is also the concern noted previously in the Swedish “Elforsk” study 69. Similar to the blade debris field shown in Figure 7 of this paper, where the debris field was limited to about 16 degrees in width, or less than 5% of the total area of the annular ring, the ice does not fall equally everywhere but is distributed through the much smaller downwind sector, so that the “about 1 ton of ice on the ground” as reported in the same report for the single event all fall in that narrow band. We might consider the risk for any person unfortunate enough to be in that zone is increased by a factor of 20.
The second logical flaw performed in many individual risk assessments is the assumption that a person will choose to not be in the impact area, or, if they are passing through the exposure area in a motor vehicle, their exposure time will be a very small fraction of the time. As an example the assumption may be made that if a motor vehicle is travelling at 80 km/hr, and the roadway is 120 metres from a wind turbine, then the personal exposure time would be only 25 seconds or so as shown in Figure 13. A setback of 240 metres would produce a personal exposure time of about 18 seconds. Then a reduced daily risk is claimed on the basis of (18 to 25 seconds of exposure / 86,400 seconds per day).
Figure 13. Reduction of Risk by Assuming Residence only During Transit Time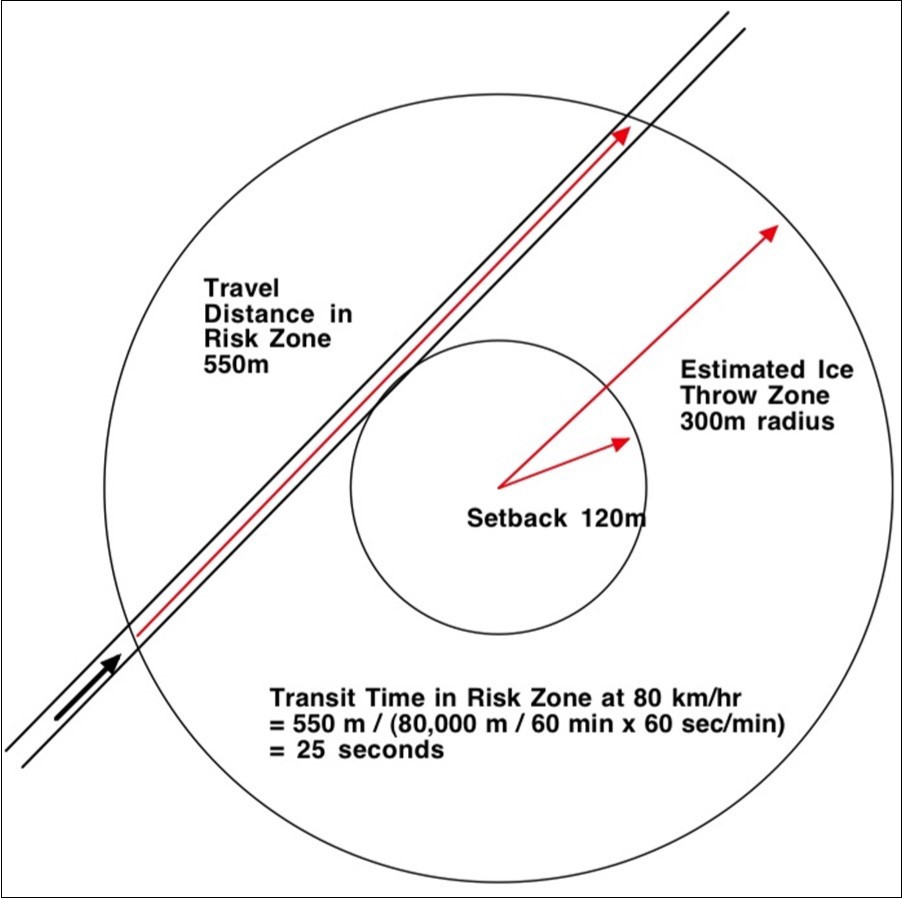
Download figure
Study of actual ice drop from a stopped wind turbine in Ontario shows that assumptions used in developing the Monte Carlo analysis for the debris field of ice from a wind turbine are not representative, as ice was seen to be falling well beyond the anticipated ice drop zone. Similarly, the research at the Rauma site in Finland reported earlier 66 showed that 70% of the ice fall occurred beyond 70 metres. Yet the assumptions used for the Monte Carlo analysis suggested that the majority of the ice would fall at the base of the turbine. The landing position was shown to be dependent on existing wind at the time the ice starts to fall. Again, the ice field distribution is dependent on the wind direction.
Calculating the reduction of assuming residence only during transit time is also not always appropriate as if it were for an individual it does not consider what the actual risk is during the time the individual is present in the risk zone. An individual walking a dog, or working on repairing a fence line might be in the risk zone for much longer. Even if it were calculating a population risk for an automobile passing the wind turbine the assumption is inappropriate, as it does not consider that the section of road may have more than one motor vehicle passing it in a day, does not consider that any motor vehicle may pass by multiple wind turbines, and that each motor vehicle may have more than one passenger. As an example, along Highway 402, a multi lane limited access highway in Ontario, an average of 18,100 vehicles a day 77 will pass 9 wind turbines in a 3.3 km section of the highway, all located within the possible ice throw zone at about 240 metres. Slightly further down the same highway, before any possible exit points are passed, the same 18,100 vehicles will pass a further 3 wind turbines also within the possible ice throw distance. The flaw in the calculation provided is that while it takes credit for a reduction factor of (18/86,400) based on the transit time for a single motor vehicle past a single wind turbine, or 2 x 10⁻⁴ it fails to take account for the multiplier of not one, but 18,100 motor vehicles with multiple passengers, and not one but 12 wind turbine risk zones. The population factor becomes: (18/86,400) x (16,100) x (12) yielding a multiplier of 45 (times the total number of passengers in all of the 16,100 motor vehicles) that yields a considerably different result than 2 x 10⁻⁴.
The intent of performing the previous calculation was not intended to provide a single value of a risk multiplier with a high degree of confidence, but to show that making flawed assumptions can present results with a large error. Other than for the case of multiple motor vehicles passing multiple wind turbines, it can generally be said that wind turbines are more of an individual risk than a population risk, as usually they are not near large areas of population density so large numbers of people are not involved.
In mature industries, such as the nuclear industry, regulations require the proponent to demonstrate acceptability for both individual and population risk. For the case of individual risk, even early papers written in the 1970’s calculation had to calculate the risk assuming the individual is present in the at risk environment, not to calculate the risk assuming the person is not present most of the time 78. It is rather like saying that the risk from skydiving is low, because the risk only exists for perhaps 15 or 20 occurrences a year x an exposure of 20 minutes for each exposure. As Starr pointed out 2, “the risk measure used here is the statistical probability of fatalities per hour of exposure of the individual to the activity considered.” We must calculate risk when the person is present in the risk zone, and not present an averaged value over a longer time when risk is less. The risk to a skydiver is during the jump, not the risk averaged over the year.
As an example in calculating the risk of radiation uptake by a member of the public living near a nuclear facility regulations require calculating the radiation dose assuming the person is continuously living at the boundary fence, drinks milk from cows that eat the grass growing alongside the fence, eats fish harvested from the discharge water outfall, and vegetables grown in gardens alongside the fence. While all of these assumptions may be considered to be very conservative, it is by making these conservative assumptions that the industry demonstrates its maximum impact, so it may confidently show that the risk is indeed low. By doing so, there is also a standard so that the results from one establishment can be compared with another. In a similar basis, if an individual who lives beside a wind turbine testifies that he or she does walk their dog along the fence line daily, or carries out routine farm activities there, then there is no basis for the wind turbine risk assessment to assume that the risk is low to that resident based on only occasional exposure to the risk. Individual risk is the condition that applies when the person is in the risk zone not a value averaged over a year.
A similar flaw exists in many of the calculations for blade throw incidents. As shown in Figure 7, actually none of the blade material was noted to have fallen in the first 150 metres from the tower, as the wind carried the debris away from the tower in this case. The debris field was narrow in width and was mostly concentrated between about 150 metres and 280 metres in that case. Again, it is a severe logical error to assume the debris is uniformly distributed when performing individual risk assessments, as in reality it was concentrated. Any person in that high-risk area indeed faces a considerable risk, well above the 10-6 allowed risk for vulnerable persons by the “Dutch Handbook”.
Discussion
The findings documented in this paper have shown that failure to have an effective safety culture can have adverse impacts. When the national body “Rijksdienst voor Ondernemend Nederland” (National Service for Entrepreneurship) was trying to determine wind turbine failures they were forced to use a citizen funded database maintained by the Caithness Windfarm Action Group, as there was no industry database of failures. Private researchers found and noted the same fact. About all they could determine in the Netherlands from manufacturers was that the data in the Caithness Windfarm Action Group included “most but not all” of the accidents and incidents that the manufacturers were aware of for their particular brand. Thus, the failure rate presented was low if anything. Similarly, when the industry comments on failures, without having a comprehensive data base, the example was given how they described as “extremely rare” an incident that had happened 3 times within 7 months in the province of the impacted wind farm and it’s adjacent neighbours. Other more mature industries with the benefit of a common database of failures may have described the same event as “uncommon” but certainly not “extremely rare.” Such an error can have impact on regulators considering event frequency and risk as lower than it actually is.
Examination of verified failure data for wind turbines in Ontario shows that seven failures including blade failures, fires, and tower collapse have all resulted in parts of wind turbine blades on the ground so that individuals may bave been injured if present. A detailed ground survey of the debris field of one of these failures confirmed that the debris was not randomly scattered over a wide area, but was confined to a fairly narrow 16 degree (~5% of whole) sector, meaning that the risk is not a uniform low value but can be much accentated in some areas. The debris field for this event also showed that all of the debris parts were outside the established safety boundary of blade length plus 10 metres (50 metres in this case). Instead, the major debris pieces were found from 150 metres to 280 metres, and smaller debris parts that could have injured an unprotected person due to the sharp edge of a knife like piece of debris 1 m long x 0.15 m wide were found as far as 560 metres from the turbine tower. The actual debris field for this case would suggest that debris can injure or cause a fatality of an unprotected individual out to 560 metres, and to individuals even if protected by an automobile shell at distances out to 280 metres.
Calculating the failure rate using both the arithmetical average and a 50% Chi squared confidence factor shows that the failure rate in Ontario is relatively constant for the last 5 failures, and shows that the data set is sufficiently large to provide statistically accurate results. A 50% confidence level on the failure rate shows a fairly uniform failure rate of about 0.0005 (5 x 10⁻⁴) , for the last 5 failures or 1 failure that puts blade parts on the ground in 2000 turbine years. The failure rate and the fact that the Ontario setback is blade length + 10 metres shows that the setback results in a failure rate that can impact affected individuals living on the boundary adjacent to wind turbines is well above the failure rate that was suggested in the Netherlands Handbook Handboek Risicozonering Windturbines 10 or the level of protection that is provided for school children that may have food allergies in Ontario.
The study of the impact of incorrect assumptions in making estimates of risk from wind turbine debris demonstrated that the results of the error might be significant. For example errors in calculating assumed protection by signs warning drivers to avoid highways that are not closed and then calculating the hazard by assuming only a single vehicle, with a single occupant, passing a single wind turbine. Instead, in reality actual monitoring of trafic patterns shows many vehicles (many with more than one passenger) may be passing many turbines along the same section of highway. The error in assumption can change risk factors by many orders of magnitude, as much as from 2 x 10⁻⁴ to perhaps 10+2. The intent is to show decision makers and regulators that incorrect assumptions can result in very inaccurate results.
The data examined shows the need to consider not only population risk from wind turbine acccidents, but also individual risk, to appropriately protect individuals living near wind turbines or passing them by on highways. In locations where individuals have free access, and perhaps with a need or habit for routine access, such as anywhere on their own property, the data suggests that a minimum setback of 560 metres is required to protect an individual from physical injury. This of course is considering only the public safety risk, and not the impact of noise, shadow flicker, and general obtrusiveness. This setback is required for public safety since if closer to the turbines, the frequency of accident that can put blade pieces on the ground that may injure or cause a fatality are shown to be 2 x 10⁻⁴, well above the level of risk accepted by society for other public safety risks.
In addition to the direct health effects of falling blade parts, indirect health effects may also occur from the irritation felt by those who want to use all of their property but feel they cannot because of the erection of a turbine next door at a setback that reduces their enjoyment of their property. Neighbours will not be protected against known blade fragment travel distances, or projected ice throw distances if setbacks are inadequate. The only mitigation possible by the residents is to restrict usage of their property, and that is effectively expropriation of their right of unrestricted use of their property without compensation. A discussion found on the website of the organization “Environment Probe” provides insight into the subject of expropriation, where it notes, “The guiding principle behind expropriation should be that those who benefit from a project should bear its costs. This principle can be traced back to the Magna Carta, the Great Charter of Liberties, signed in 1215, that forbade the king’s agents to take a man’s timber or horses without his agreement, and provided for compensation in the event of expropriation. If the king benefited from a taking, the king would have to pay.” 79
In addition to the concern for public safety and the restriction it may pose to use of property, other sources of irritation (otherwise known as annoyance) from wind turbines are discussed in other papers. A paper published in 2013 by staff from the Grey Bruce Health Unit 80 concludes, “We have demonstrated the presence of reasonable evidence (Level Four and Five) that an association exists between wind turbines and distress in humans. A paper published in 2017 81, discusses the subject of annoyance from wind turbine sound, including references to work by others. Then also, shadow flicker, flashing navigation beacons, and the general obtrusiveness of tall moving objects, all work together to contribute to the multi sensory impact of wind turbines. Without confirmation here, it is suspected that the multi sensory characteristics all contribute to making the resultant annoyance greater than the sum of the parts, effectively confirming the concept of synergy first expressed by the Greek philospoher Aristotle.
The world health organization listing of the International Statistical Classification of Diseases and Related Health Problems for Canada and the United States (ICD-10) - a medical classification list prepared by the World Health Organization, states in code ICD-10 Version:2016 XVIII 45.4 that “Irritability and Anger” is a medical condition. 82 This would suggest that irritation from loss of full use of property due to concerns about the physical risk from wind turbines erected nearby may be a cause of a medical condition. This link would require further research to identify the level of impact.
Conclusions
From Finding 1:
The wind turbine industry has not yet developed the maturity to recognize the importance of sharing experience. Repeatedly, investigators studying wind turbine accidents and incidents in order to analyse failures to develop Fault Tree Analysis or other reliability models have pointed out concern that the industry does not have a comprehensive listing of failure data. Repeatedly, papers have identified that the citizen group Caithness Windfarm Information Forum, which bases it’s listing of failures from those provided by auditable public press sources maintains the most comprehensive database of wind turbine accidents.
A result of not knowing of failures of a similar nature that have occurred at neighbouring facilities is that operators are not learning to be able to improve their operation or equipment.
The industry description of failure frequency is not consistent with that used by other mature industries and as a result the industry is not giving a clear indication that they know the severity of recurrence.
From Finding 2:
The critical initiating point for any safety assessment is to determine the possible initiating events. Seven events that have happened in the Canadian province of Ontario were studied since they document actual occurrences of blade failures, tower collapse, and turbine fire. Each resulted in blade parts on the ground large enough to harm an unprotected citizen in the area. The goal of the study was to gain an appreciation of actual blade part travel distances, as actual data can be used to verify models. The study showed blade parts as large as 1 metre x 3.6 metres at distance of 170 metres from the tower, 1.2 metres x 3.0 metres (large enough to park an automobile on) at a distance of 280 metres from the tower, and 0.15 metres x 1.0 metres at a distance of 560 metres from the tower (with a sharp serrated edge) that could have injured an unprotected individual.
From Finding 3:
The seven Ontario failures were examined to show the case of a relatively constant 50% Chi-Squared Confidence Level Failure Rate failure rate of about 0.0005 (5.0 x 10⁻⁴ failures per turbine year in operation), representative of the normal service period with a constant failure rate. This means this failure rate can be used to predict future failures in risk calculations.
From Finding 4:
The challenge was demonstrated of comparing the risk of death for an activity that the majority of Ontario residents take part in, of driving a motor vehicle, to the risk of death to an individual who may happen to be in the vicinity of a wind turbine when a failure occurs. For the first, the expectation is that 1 in 20,000 drivers are killed per year, a frequency of 5.0 x 10⁻⁵ deaths per year for an activity voluntarily selected by choice of the drivers. For the second, the expectation for the individual in the vicinity of the failure is 5.0 x 10⁻⁴ deaths per year, a factor 10 times higher, yet for an initiator that is an involuntary risk. Examples were given that we protect vulnerable children, at risk of an anaphylactic death from consuming peanut products where the risk is 2.5 x 10⁻⁶ deaths per year.
From Finding 5:
Ice shed was shown to present an additional risk even if the turbine does not itself fail. Significant discrepancy was identified between setbacks for ice safety that have been accepted since 2007 in the Canadian province of Ontario, of (blade length + 10 metres), identified “to enable wind power development” and studies from Finland to show that while 70% of ice pieces will be thrown by a distance of 270 metres from a turbine, but in fact only 30% of the ice pieces will have been thrown less than blade length plus 10 metres, while 15% of the ice will be thrown greater than 410 metres.
From Finding 6:
The impact of flaws in assumptions made when calculating risk from falling ice or blades was discussed contrasting a generalized assumption of random ice throw pattern or blade throw pattern, with the actual distribution which is confined to a much tighter sector downwind of a turbine (if shutdown), or if the turbine is operating (facing upwind), then the thrown sector is more likely crosswind. Errors in assumption of risk to ice thrown on highways were identified in that instead of assuming one vehicle passes one turbine; multiple vehicles, each with an average of more than one passenger, may pass multiple turbines resulting in a very different population risk factor.
Summary Conclusion
The establishment of a comprehensive, accessible database of failures would improve the wind turbine industry and protection of public safety. Such a database would permit the establishment of mitigating measures, such as setbacks from wind turbines to locations where members of the public may be, on their personal property, in public spaces such as roadways, or in accessible open spaces. Regulating agencies should use the information from the failure database to establish setbacks to protect the public from known initiating events, such as the setback of at least 560 metres from wind turbines as demonstrated by the abbreviated failure database provided in this paper. The full database of failures may identify greater required setbacks for public safety. Once setbacks from known initiating events are established, the database of failures will permit the creation of probabilistic assessments of the initiating frequency of these and other failures. A probabilistic assessment based on a comprehensive failure database will identify the primary root causes of events guiding industry improvements, providing economic benefits for the industry and assuring public safety from events that might not yet have happened, but are predicted by the probabilistic assessments. Setbacks identified by a comprehensive database of failures would address both direct and indirect public safety concerns, but are independent of setbacks required to prevent irritation from noise and other stressors, particularly when applied to areas of learning, rest, and recuperation.
References
- 1.Klaus G. (2017) Perceived Risk and Response to the Wind Turbine Ice Throw Hazard: Comparing Community Stakeholders and Operations and Maintenance Personnel in Two Regions of Texas. A dissertation submitted to the Graduate Council of Texas State University in partial fulfillment of the requirements for the degree of Doctor of Philosophy with a major in Environmental Geography.
- 4.Hofstra Law Review. (2011) The Solution to the United States Energy Troubles is Blowing in the Wind. , Vol 39, 201.
- 6.Richie H, Roser M. (2018) Energy Production & Changing Energy Sources, Online Resource, retrieved. fromhttps://ourworldindata.org/energy-production-and-changing-energy-sources.
- 7. (2016) World Association of Nuclear Operators WANO Principles PL-2013-1 Traits of a Healthy Nuclear Safety Culture. , May,2013
- 8.Rademakers L, Braam H, Brinkman H, Ham K, Verheij F. (2002) Handboek Riscozonering Windturbines. prepared for NOVEM , (in Dutch) – Version 1.
- 9.Braam H, Rademakers L W M M. (2002) Guidelines on the environmental risk of Wind Turbines in the Netherlands. ECN Wind Energy Report ECN-RX--04-013, Presented at the Global Wind Energy Conference , Paris .
- 10.C J Faasen, Franck P A L, Taris A M H W. (2014) Handboek Risicozonering Windturbines, Revised version 3,1, September,2014, prepared by DNV GL for Rijksdienst voor Ondernemend Nederland.
- 11.Ertek G, Chi X, A N Zhang, Asian S. (2017) Text mining analysis of wind turbine accidents: An ontology-based framework. In Big Data (Big Data), 2017 IEEE International Conference on 3233-3241.
- 12.Emeksiz C, Dogan Z, Akar M, Hekim M. (2017) Some Prognostic and Diagnostic Methods for Determining Wind Turbine Failures – A Review, Erzincan University. , Journal of Science and Technology 10(2), 168-183.
- 13.S R Brouwer, Al-Jibouri S H S, I C Cárdenas, Halman J I M. (2018) Towards analysing risks to public safety from wind turbines. , Reliability Engineering and System Safety 180(2018), 77-87.
- 14.http://www.radio-canada.ca/regions/estquebec/ 2013/11/14/004-gaspesiemurdochville- eolienne-feu.shtmlRadio Canada written report of a wind turbine fire at Murdochville. in November,2013 (Translated from French to English by Google Translate) , Quebec
- 18.D H Reilly. (1979) NASA-TM-79193,E-067,DOE/NASA/20305-79/3, Safety Considerations in the Design and Operation of Large Wind Turbines.
- 19.J N Sørensen. (1980) Calculation of Trajectories of Detached Wind Turbine Blades and Prediction of Site Risk Levels Associated with Failures of HAWT’s. , Munich, IEA Expert Meeting 25-26.
- 20.J F Macqueen, J F Ainslie, D J Milborrow, D M Turner, D T Swift-hook. (1983) Risks associated with wind-turbine blade failures. IEE Proceedings A (Physical Science, Measurements and Instrumentation, Management and Education, Reviews) 130(90), 574-586.
- 21.J N Sørensen.Calculation of trajectories of detached wind-turbine blades and prediction of site risk levels associated with failures of HAWT’s, Kernforschungsanlage Implementing Agreement for Cooperation in the Develop. of Large Scale Wind Energy Conversion Systems. 9-32.
- 22.J N Sørensen. (1984) On the Calculation of Trajectories for blades detached from Horizontal Axis Wind Turbines. , Wind Engineering 8(3), 160-175.
- 23.Turner D. (1987) A Monte Carlo Method for Determining the Risk Presented by Wind Turbine Blade Failures. , Wind Engineering 11(1), 1-20.
- 24.Rademakers L W M M, B M, Horn B M Van den, Jehee J N T, A J Seebregts. (1992) Reliability Analysis Methods for Wind Turbines, Netherlands Energy Research Foundation (ECN). Technical Report ECN-C-C92-018
- 25.Rademakers L W M M, A J Seebregts, Horn B M Van den, B A Jehee, B M. (1993) Methodology for probabilistic safety assessment of wind turbines, demonstrated by a case study of the Lagerway LW 15/75 design. Netherlands Energy Research Foundation (ECN). Technical Report ECN-C-C93-010
- 26.Rademakers L W M M, A J Seebregts, Horn B Van den. (1993) Reliability Analysis in Wind Engineering, Netherlands Energy Research Foundation (ECN). European Community Wind Energy Conference (ECWEC)’93, Travemŭnde Technical Report ECN-RX-93-032, Presented at 8-12.
- 27.Rademakers L W M M, A J Seebregts, Horn B A Van den. (1994) Risk and reliability analysis in the wind turbine industry, Netherlands Energy Research Foundation (ECN). Technical Report ECN-RX-94-017 Also published in 6(2), 18-24.
- 28.Rademakers L W M M, A J Seebregts, Verbruggen T. (1994) October Applications of reliability analysis methods for wind turbines,Netherlands Energy Research Foundation (ECN),Technical Report ECN-RX-94-087,This paper was also presented at the EWEC'94 (European Wind Energy Association Conference),Thessaloniki. , Greece 10-14.
- 29.A J Seebregts, Rademakers L W M M, Horn B A Van den. (1995) Reliability analysis in wind turbine engineering. , Microelectronics Reliability 35, 9-10.
- 30.C H Lange. Civil Engineering, Stanford University, USA (1996) Probabilistic Fatigue Methodology and Wind Turbine Methodology. PhD Thesis
- 31.H F Veldkamp. Mechanical Engineering, Delft University of Technology, the Netherlands (2006) A Probabilistic Approach to Wind Turbine Design. PhD Thesis
- 32.H F Veldkamp. (2008) May Probabilistic design with focus on blades, presented at Sandia Blades Workshop. 12-14.
- 33.Carbone G, Afferrante L. (2013) A novel probabilistic approach to assess the blade throw hazard of wind turbines. , Renewable Energy, Vol 55(2013), 474-481.
- 34.Kerres B, Fischer K, Madlener R. (2015) Economic evaluation of maintenance strategies for wind turbines: a stochastic approach. , IET Renewable Power Generation,http://dx.doi.org/10.1049/iet-rpg.2014.0260
- 35.Ashrafi M, Daviupour H, Khodakarami V. (2015) Risk assessment of wind turbines: Transition from pure mechanistic paradigm to modern complexity paradigm, Renewable and Sustainable Energy Reviews. 51, 347-355.
- 36.S R Brouwer, Al-Jibouri S H S, I C Cardeneas, Haman J I M. (2018) Towards analyzing risks to public safety from wind turbines. , Reliability Engineering & System Safety Vol 180, 77-87.
- 37.Ozyildiz M, Muyan C, Coker D. (2018) Strength analysis of a composite turbine blade using puck failure criteria. Journal of Physics: Conference Series, Volume 1037, Design, System Engineering and New Concepts .
- 38.Dimitrov N. (2018) Risk-based approach for rational categorization of damage observations from wind turbine blade inspections. Journal of Physics: Conference Series, Volume 1037, Design, System Engieneering and New Concepts .
- 39.Damiani R. (2018) Prepared under task No.WPEG.10346.23.01.04,NREL/TP-5000-67499, Uncertainty and risk assessment in the design process for wind,National Renewable Energy Laboratory.
- 41.REGDOC-2-4-2. (2013) Probabilistic Safety Assessment (PSA) for Nuclear Power plants. , Canadian Nuclear Safety Commissionhttp://www.nuclearsafety.gc.ca
- 43.Ontario IndependentElectrical System Operator (IESO) – Generator Output and Capability Reportshttp://www.ieso.ca/en/Power-Data/Data-Directory.
- 45.D J Wilkins. (2002) The Bathtub Curve and Product Failure Behavior Part One – The Bathtub Curve, Infant Mortality and Burn-.
- 46.D J Wilkins. (2002) The Bathtub Curve and Product Failure Behavior Part Two – Normal Life and Wear-.
- 47.. https://windsor.ctvnews.ca/chatham-kent-wind-power-facility-to-return-to-regular-operations- next-month-1.3782189
- 49.J K Byers, H A Weibe. (1974) . Pocket Handbook on Reliability, Defense Technical Information Centrewww.dtic.mil/docs/citations/ADA037409 .
- 51.Y S Xu, Kastner M, Xu A, Salter J, Waserman S. (2014) Anaphylaxis-related deaths in Ontario: a retrospective review of cases from. , Jul22 10(1), 38.
- 52.Food Allergy Canada Fast Facts: Food allergies in Canada, available fromhttps://foodallergycanada.ca(downloaded,Sept 20).
- 55.D A Schreuder. (1992) The influence of wind turbine parks on road safety, a recommendation issued to the Dutch Society for Energy and the Environment (NOVEM) by the Institute for Road Safety Research. (in Dutch)
- 56.J D Sørensen, J N Sørensen, Lemming J. (2012) Risk assessment of wind turbines close to highways. Proceedings of EWEA 2012 – European Wind Energy Conference & Exhibition .
- 57.T De Ceunynck, E De Pauw, Daniels S, Polders E, Brijs T. (2017) The effect of wind turbines alongside motorways on drivers’ behaviour. , European Journal of Transport and Infrastructure Research 17(3), 477-494.
- 58.Morgan C, Bossanyi E. (1996) Wind Turbine Icing and Public Safety – a Quantifiable Risk?, Garrad Hassan and Partners report.
- 59.Tammelin B, Cavaliere M, Holttinen H, Morgan C, Seifert H. (1997) Wind Energy Production in Cold Climate. In EWEC’97, Proceedings of the International Conference , Dublin Ireland 347-353.
- 60.Morgan C, Bossanyi E, Seifert H. (1998) Assessment of safety risks arising from wind turbine icing, presented at BOREAS 4. , Finland
- 61.Seifert H, Westerhellweg A, Kroning J. (2003) Risk Analysis of Ice Throw from Wind Turbines, presented at BOREAS 6. , Finland
- 63.Wahl D, Guiguere P. (2006) . Ice Shedding and Ice Throw – Risk and Mitigation, GE Energy Report GER-4262 .
- 64.M P LeBlanc, C A Morgan, E A Bossanyi, A D Garrad. (2007) Garrad Hassan, “Recommendations for Risk Assessments of Ice Throw and Blade Failure in Ontario,” 31 May,2007,prepared for Canadian Wind Energy Association.
- 65.Laakso T, Bering-Gould I, Durstewitz M, Hobarty R, Lacroix A. (2010) State of the art of wind energy in cold climates. , VTT Technical Research Centre of Finland, Working Paper 152.
- 66.Andersen E, Börjesson E, Vainionpää P, L S Undem. (2011) Report – Wind Power in cold climate, WSP Environmental for Nordic Energy Research. , Norway
- 68.Marmutova S. Lappeenranta University of Technology (2011) Master’s Thesis, Wind Turbine Operation in Cold Climate. , Finland
- 69.Cattin R. (2012) Icing of Wind Turbines, Vindforsk projects, a survey of the development and research needs. , Elforsk report 12, 13.
- 70.Ronsten G, Wallenius T, Hulkkonen M, Baring-Gold I, Cattin R. (2012) . State-of-the-art of wind energy in cold climate
- 71.Fakorede O, Feger Z, Ibrahim H, Ilinca A, Perron J. (2016) Ice protection systems for wind turbines in cold climate: characteristics, comparisons and analysis, Renewable and Sustainable Energy Reviews 65. 662-675.
- 72.R E Bredesen, H A Refsum. (2015) Methods for evaluating risk caused by ice throw and ice fall from wind turbines and other tall structures, presented at IWAIS 2015, 16thInternational Workshop on Atmospheric Icing of Structures. , Uppsala, Sweden,June,28,July3
- 73.R E Bredesen, H A Refsum. (2015) Methods for evaluating risk caused by ice thrown from wind turbines, presented at Winterwind. , Piteå, Sweden
- 74.Hahm T, Stoffels N. (2016) Ice Throw Hazard Experiences and Recent Developments in Germany, presented at WindEurope Summit.
- 75.R E Bredsen, Drapalik M, Butt B. (2017) Understanding and acknowledging the ice throw hazard – consequences for regulatory frameworks, risk perception and risk communication. , IOP Conf. Series: Journal of Physics: Conf
- 76.R E Bredsen, Cattin R, Clausen N, Davis N, P J Jordaens. (2017) . Expert Group Study on Recommended Practices, 13. Wind Energy Projects in Cold Climates, 2 ed. 2017, IEA Wind.Climates.2.Edition .
- 78.P J Barry. (1972) Some Aspects of the Releases of Radioactivity and Heat to the Environment from Nuclear Reactors in Canada, a compilation of 8 recent papers and talks on the subject by various authors, Atomic Energy of Canada Limited, Chalk River Nuclear Laboratories.
- 79.A discussion from Chapter 12 of the website of the Canadian organization, “Environment Probe” about expropriation.
- 80.Arra I, Lynn H, Barker K, Ogbuneke C, Regalado S. (2014) Systematic Review 2013: Association Between Wind Turbines and Human Distress. Cureus 6(5): e183.
Cited by (6)
This article has been cited by 6 scholarly works according to:
Citing Articles:
Jan Sikora, Kazimierz Zimniewicz - Economics and Environment (2023) Semantic Scholar Crossref OpenAlex
Qiying Deng, Z. S. Khodaei - ADVANCES IN FRACTURE AND DAMAGE MECHANICS XX (2023) Semantic Scholar OpenAlex
Renewable Energy (2022) OpenAlex
Waqar Hussain, Sadia Khan, Ather Hussain Mover - Renewable Energy (2022) Semantic Scholar Crossref
Yingkang Du, Shengxi Zhou, X. Jing, Yeping Peng, Hongkun Wu et al. - (2020) Semantic Scholar Crossref OpenAlex