
Characterization of the Consciousness Energy Healing Treated Cholecalciferol Using LC-MS and GC-MS Spectrometry
Abstract
Vitamin D3 (cholecalciferol) is a fat-soluble vitamin, which widely used for the prevention and treatment rickets, osteoporosis, arthritis, Parkinson’s and Alzheimer’s diseases, autoimmune disease, dementia, glucose intolerance, etc. The impact of the Trivedi Effect®-Consciousness Energy Healing Treatment on the structural properties and the isotopic abundance ratio of cholecalciferol were evaluated using LC-MS and GC-MS spectroscopy. The test sample cholecalciferol was divided into control and treated parts. Only, the treated cholecalciferol was received the Trivedi Effect®-Consciousness Energy Healing Treatment remotely by a renowned Biofield Energy Healer, Dahryn Trivedi. The LC-MS spectra of both the samples at retention time (Rt) ~22 minutes exhibited the mass of the molecular ion peak at m/z 385.25 (calcd for C27H45O+, 385.35). The LC-MS based isotopic abundance ratio of PM+1/PM in the treated cholecalciferol was increased by 0.74% compared with the control sample. But, the GC-MS based isotopic abundance ratio of PM+1/PM and PM+2/PM in the treated cholecalciferol was significantly increased by 66.39% and 62.69%, respectively compared with the control sample. Hence,13C, 2H, 17O, and 18O contributions from C27H44O+ to m/z 386 and 387 in the treated cholecalciferol were significantly increased compared with the control sample. The isotopic abundance ratios of PM+1/PM (2H/1H or 13C/12C or 17O/16O) and PM+2/PM (18O/16O) in the treated cholecalciferol were significantly increased as compared to the control sample. The increased isotopic composition of the Trivedi Effect®-Consciousness Energy Healing Treated cholecalciferol might have altered the neutron to proton ratio in the nucleus via the possible mediation of neutrino. The increased isotopic abundance ratio of the treated cholecalciferol may increase the intra-atomic bond strength, increase its stability. The new form of cholecalciferol would be better designing novel pharmaceutical formulations that might be more stable and more efficacious for the prevention and treatment of various diseases such as vitamin D deficiency, rickets, osteoporosis, arthritis, multiple sclerosis, cancer, diabetes mellitus, mental disorders, cardiovascular diseases, hypertension, infections, influenza, cognitive impairment in older adults, Parkinson’s and Alzheimer’s diseases, autoimmune disease, dementia, glucose intolerance, multiple sclerosis, etc.
Article Information
- Received
- Accepted
- Published
Academic Editor: Fatma Mohammed Mady, Department of Pharmaceutics, Minia University, Egypt.
Checked for plagiarism: Yes
Review by: Single-blind
Copyright © 2021 Dahryn Trivedi, et al.
 This is an open-access article distributed under the terms of the Creative Commons Attribution License, which permits unrestricted use, distribution, and reproduction in any medium, provided the original author and source are credited.
Corresponding author: Snehasis Jana, Trivedi Science Research Laboratory Pvt. Ltd., Thane (W), Maharashtra, India —
Competing Interests
The authors have declared that no competing interests exist.
Funding
No specific funding statement was provided by the authors.
Data Availability
No data-availability statement was provided by the authors.
Acknowledgements
The authors are grateful to Sophisticated Instrumentation Centre for Applied Research & Testing (SICART) India, Trivedi Science, Trivedi Global, Inc., and Trivedi Master Wellness for their assistance and support during this work.
Citation:
Introduction
Vitamin D3 (cholecalciferol) is a fat-soluble vitamin and a hormone precursor. Vitamin D2 is found naturally in the sun-exposed mushrooms and humans synthesize vitamin D3 in the skin on exposure to UV light from the sun 2. Vitamin D synthesized in skin and diet is biologically inert. It gets activated by hydroxylation in the liver and kidney to 1,25-dihydroxycholecalciferol (calcitriol). Vitamin D2 and D3 differ chemically in their side chains. These differences in the structure alter their binding to the vitamin D binding protein (DBP) and their metabolism. DBPs are found in most of the body parts, i.e., heart, lungs, kidney, brain, liver, pancreas, intestines, muscles, nervous system, gonads, etc. Vitamin D regulates the various functions of the brain, muscles, lungs, liver, kidneys, heart, pancreas, intestines, and immune system. Vitamin D receptor response elements with hundreds of genes directly or indirectly influence cell-to-cell communication, normal cell growth, cell cycling and proliferation, cell differentiation, neurotransmission, hormonal balance, increase calcium (30-40%) and phosphorus (80%) absorption, skin health, immune, and cardiovascular functions 3, 4, 5.
Children, young and middle-aged people are equally high risk for vitamin D deficiency worldwide. Inadequate exposure to sunlight, high body mass index (>30 kg/m2), fat malabsorption syndromes and bariatric patients, patient taking anticonvulsants and anti AIDS/HIV medications, chronic liver disease, familial hypophosphatemia, and hypocalcaemia is associated with hypoparathyroidism are the cause of the vitamin D deficiency 2, 4. Vitamin D deficiency may cause abnormalities in calcium, phosphorus, and bone metabolism, rickets, osteoporosis, arthritis, multiple sclerosis, cancer, diabetes mellitus, mental disorders, cardiovascular diseases, hypertension, infections, influenza, cognitive impairment in older adults, Parkinson’s and Alzheimer’s diseases, autoimmune disease, dementia, glucose intolerance, multiple sclerosis, etc. 1, 2, 5, 6, 7, 8. As per the literature, 15 µg/d (600 IU per day) is required for all individuals between the ages of 1 and 70 years old 1, 2, 3, 4. High dose of vitamin D supplementation may cause toxicity like hypercalcemia, polyuria, polydipsia, weakness, mental retardation, and insomnia 8. The stability of vitamin D is more concerned as it is more sensitive to heat and light 9, 10.
Vitamin D3 bioavailability directly affected by various factors such as dietary fiber, genetic factors, age, skin colour, and status of vitamin D311. The Trivedi Effect®-Consciousness Energy Healing Treatment is a form of Energy Therapy improved the bioavailability profile of several nutraceutical and pharmaceutical compounds, i.e., resveratrol, berberine, 25-hydroxyvitamin D3 [25(OH)D3], etc. 12, 13, 14. The Trivedi Effect® is a scientifically proven Energy Therapy in which a Biofield Energy Healer can harness this inherently intelligent energy from the Universe and transfer it anywhere on the planet through the possible mediation of neutrinos 15. The Biofield-based Energy Healing Therapies nowadays has been used against various disease conditions 17, 18. The Energy Therapy has been recognized worldwide as a Complementary and Alternative Medicine (CAM) health care approach by the National Center of Complementary and Integrative Health (NCCIH) with other therapies, medicines and practices such as aromatherapy, yoga, Qi Gong, Tai Chi, Ayurvedic medicine, traditional Chinese medicines, chiropractic/osteopathic manipulation, homeopathy, acupressure, acupuncture, hypnotherapy, movement therapy, naturopathy, Reiki, etc. 19. Such therapies have been well accepted by most of the U.S.A. people 20. Similarly, the Trivedi Effect®-Consciousness Energy Healing Treatment also potentially transform the characteristic properties of metals and ceramic 21, 22, 23, 24, organic compounds 25, 26, microbes 27, 28, and improve the yield of crops 29, 30, alteration of the isotopic abundance ratio 31, 32.
Study on the natural stable isotope ratio analysis has a range of applications in several fields of sciences to understand the isotope effects resulting from the alterations of the isotopic composition 33, 34, 35. Liquid chromatography-mass spectrometry (LC-MS) and Gas chromatography-mass spectrometry (GC-MS) is widely used for the analysis of isotope ratio with sufficient precision 34. In this experiment, the LC-MS and GC-MS were used to characterize the structural properties and to evaluate the isotopic abundance ratio of PM+1/PM (2H/1H or 13C/12C or 17O/16O) and PM+2/PM (18O/16O) in the Trivedi Effect®-Consciousness Energy Healing Treated cholecalciferol compared to the control sample.
Materials and Methods
Chemicals and Reagents
The test sample cholecalciferol (> 98%) was procured from Sigma-Aldrich, India. Similarly, the other chemicals used in the experiments were purchased in India.
Consciousness Energy Healing Treatment Strategies
The test sample cholecalciferol powder was divided into two parts, i.e., control and treated parts. The control cholecalciferol powder sample did not receive the Trivedi Effect®-Consciousness Energy Healing Treatment. But, the control cholecalciferol was treated with a “sham” healer who did not have any understanding of the Consciousness Energy Healing Treatment. However, the treated part of cholecalciferol was received the Trivedi Effect®-Consciousness Energy Healing Treatment remotely under standard laboratory conditions for 3 minutes by the renowned Biofield Energy Healer, Dahryn Trivedi, USA. Finally, both the samples were kept in sealed conditions and characterized using modern analytical techniques.
Characterization
Liquid Chromatography-Mass Spectrometry (LC-MS) Analysis and Calculation of
Isotopic Abundance Ratio
The LC-MS analysis of the cholecalciferol samples was carried out with the help of LC-MS ThermoFisher Scientific, the USA equipped with an ion trap detector connected with a triple-stage quadrupole MS. The column used here was a reversed phase Thermo Scientific Synchronis C18 (Length-250 mm X ID 4.6 mm X 5 micron), maintained at 25˚C. Methanol was used as a diluent for the sample preparation. 20 µL of cholecalciferol solution was injected, and the analyte was eluted using acetonitrile + methanol (80:20) pumped at a constant flow rate of 1.5 mL/min with the total run time of 30 min. Peaks were monitored at 300 nm using the PDA detector. The mass spectrometric analysis was performed under atmospheric pressure chemical ionization (APCI) +ve ion mode.
The values of the natural isotopic abundance (H, C, and O) of the common elements are obtained from the literature 35, 36, 37, 38. The LC-MS based isotopic abundance ratios (PM+1/PM) for the control and Biofield Energy Treated cholecalciferol was calculated using the equation (1).
% Change in isotopic abundance ratio = [(IARTreated – IARControl)/ IARControl) x 100](1)
Where IARTreated is the isotopic abundance ratio of the treated sample and IARControl is the isotopic abundance ratio of the control sample.
Gas Chromatography-Mass Spectrometry (GC-MS) Analysis
GC-MS of both the samples of cholecalciferol was analyzed with the help of Perkin Elmer Gas chromatograph equipped with a PE-5MS (30M x 250 micros x 0.250 microns) capillary column and coupled to a single quadrupole mass detector was operated with electron impact (EI) ionization in positive mode. The oven temperature was maintained from 150°C (5 min hold) to 280°C (17 min hold) @ 10°C /min with a total run time of 35 minutes. The sample was prepared taking 50 mg of the cholecalciferol in 2.5 ml methanol as a diluent. The GC-MS based isotopic abundance ratios (PM+1/PM and PM+2/PM) for the control and Biofield Energy Treated cholecalciferol was calculated using equation (1).
Results and Discussion
Liquid Chromatography-Mass Spectrometry (LC-MS)
The chromatograms of both the samples are shown in Figure 1. A single major chromatographic peak of the control and treated cholecalciferol was observed at retention time (Rt) of 21.5 and 21.8 minutes, respectively (Figure 1). This indicated that the polarity of both the samples was very close to each other.
Figure 1. Liquid chromatograms of the control and Biofield Energy Treated cholecalciferol.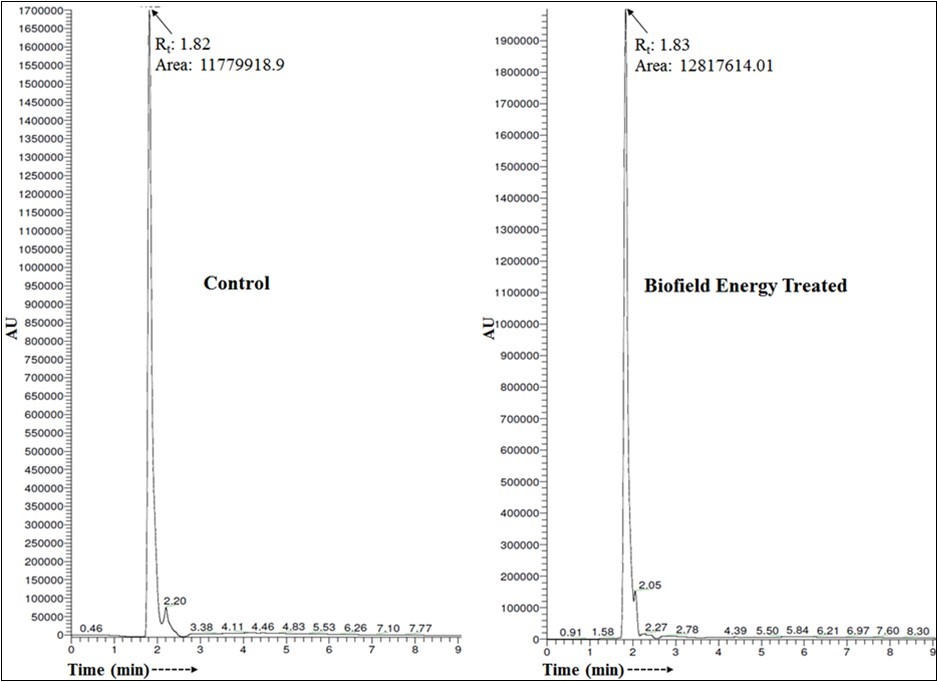
Download figure
The mass spectra of both the samples are shown in Figure 2. The mass spectra of both the samples corresponding to the Rt ~22 minutes exhibited the presence of the molecular ion of cholecalciferol (C27H45O+) adduct with hydrogen ion at m/z 385.25 (calcd for C27H45O+, 385.35) along with the lower mass peak M+at m/z 367.33 (calcd for C27H43+, 367.3) (Figure 2 and Figure 3). The experimental data were well matched with the literature data 39.
Figure 2. Mass spectra of the control and Biofield Energy Treated cholecalciferol.
Download figure
Figure 3. Proposed fragmentation pattern of cholecalciferol.
Download figure
The cholecalciferol samples showed the mass of a molecular ion at m/z 385.25 (calcd for C27H45O+, 385.35)with 100% relative abundance in the spectra. The theoretical calculation of isotopic peak PM+1 for the protonated cholecalciferol presented as below:
P(13C) = ((27 x 1.1%) x 100% (the actual size of the M+ peak)) / 100% = 29.7%
P(2H) = ((45 x 0.015%) x 100%) / 100%= 0.675%
P(17O) = ((1 x 0.04%) x 100%) / 100% = 0.04%
PM+1i. e.13C, 2H, and17O contributions from C27H45O+ to m/z 386.25 = 30.42%
The calculated isotopic abundance of PM+1 value 30.42% was higher to the experimental value (27.21%) (Table 1). From the above calculation, it has been found that 13C has the major contribution to m/z 386.25.
Table 1. LC-MS based isotopic abundance analysis results in Biofield Energy Treated cholecalciferol compared to the control sample.| Parameter | Control Sample | Biofield Energy Treated Sample |
| PM at m/z 385.25 (%) | 100 | 100 |
| PM+1 at m/z 386.25 (%) | 27.21 | 27.41 |
| PM+1/PM | 0.27 | 0.27 |
| % Change of isotopic abundance ratio (PM+1/PM) with respect to the control sample | 0.74 | |
The LC-MS based isotopic abundance ratio analysis PM and PM+1 for cholecalciferol near m/z 385.25 and 386.25, respectively, which were obtained from the observed relative peak intensities of [M+] and [(M+1)+] peaks, respectively in the ESI-MS spectra (Table 1). The isotopic abundance ratio of PM+1/PM (2H/1H or 13C/12C or 17O/16O) in treated cholecalciferol was increased by 0.74% compared to the control sample (Table 1). Thus, the 13C, 2H, and17O contributions from C27H45O+ to m/z 386.25 in the treated cholecalciferol was increased compared to the control sample.
Gas Chromatography-Mass Spectrometry (GC-MS) Analysis
The cholecalciferol samples showed two major independent peaks in the GC-MS chromatograms Figure 3. The Rt of the control cholecalciferol was at 22.06 and 22.74 minutes, whereas 21.95 and 22.62 minutes is for the treated cholecalciferol, which indicated that the polarity of both the sample was very close. The two peaks in the chromatograms of both the cholecalciferol samples might be due to the cis and trans isomers of cholecalciferol 40, 41.
The GC-MS spectra of the cholecalciferol samples at Rt of 22 minutes exhibited the presence of the molecular ion peak of cholecalciferol (C27H44O+) (Figure 4) at m/z 385 (calcd for C27H44O+, 384.34). The low molecular mass fragmentation peak at m/z 367, and 352 for C27H43+ and C26H40+, respectively were also observed in both the spectra (Figure 4). The mass peak intensities of the Biofield Energy Treated cholecalciferol were altered compared to the control sample.
Figure 4. The GC-MS chromatogram and mass spectra of the control cholecalciferol.
Download figure
The GC-MS spectra of both the cholecalciferol showed the mass of the molecular ion peak M+ at m/z 385 (calcd for C27H44O+, 384.34). The theoretical calculation of PM+1 and PM+2 for cholecalciferol was presented as below:
P(13C) = ((27 x 1.1%) x 10% (the actual size of the M+ peak)) / 100% = 2.97%
P(2H) = ((44 x 0.015%) x 10%) / 100%= 0.07%
P(17O) = ((1 x 0.04%) x 10%) / 100% = 0.004%
PM+1i. e.13C, 2H, and17O contributions from C27H45O+ to m/z 386 = 3.04%
Similarly, the theoretical calculation of isotopic peak PM+2 for the protonated cholecalciferol was presented below:
P(18O) = ((1 x 0.20%) x 10%) / 100% = 0.02%
PM+2 of 18O contribution from C27H45O+ to m/z 387 = 0.02%
The calculated isotopic abundance of PM+1 and PM+2 values were close to the calculated value (Table 2). From the above calculation, it has been found that 13C and 18O have major contribution to m/z 386 and 387 of cholecalciferol.
Table 2. GC-MS based isotopic abundance analysis results of Biofield Energy Treated cholecalciferol compared to the control samples.| Parameter | Control Sample | Biofield Energy Treated Sample |
| PM at m/z 385 (%) | 10.00 | 6.01 |
| PM+1 at m/z 386 (%) | 2.77 | 2.77 |
| PM+1/PM | 0.28 | 0.46 |
| % Change of isotopic abundance ratio (PM+1/PM) compared to the control sample | 66.39 | |
| PM+2 at m/z 387 (%) | 0.45 | 0.44 |
| PM+2/PM | 0.05 | 0.07 |
| % Change of isotopic abundance ratio (PM+2/PM) compared to the control sample | 62.69 | |
The GC-MS based isotopic abundance ratio analysis of the treated sample was calculated compared to the control sample. PM, PM+1, and PM+2 for cholecalciferol near m/z 385, 386, and 387, respectively of the control and treated samples, which were obtained from the observed relative peak intensities of [M+], [(M+1)+], and [(M+2)+] peaks, respectively in the mass spectra. The isotopic abundance ratio of PM+1/PM and PM+2/PM in the treated cholecalciferol was significantly increased by 66.39% and 62.69%, respectively compared to the control sample (Table 2). Therefore, the13C, 2H, 17O and 18O contributions from C27H44O+ to m/z 386 and 387 in the treated cholecalciferol were significantly increased compared with the control sample. Figure 5.
Figure 5. The GC-MS chromatogram and mass spectra of the Biofield Energy Treated cholecalciferol.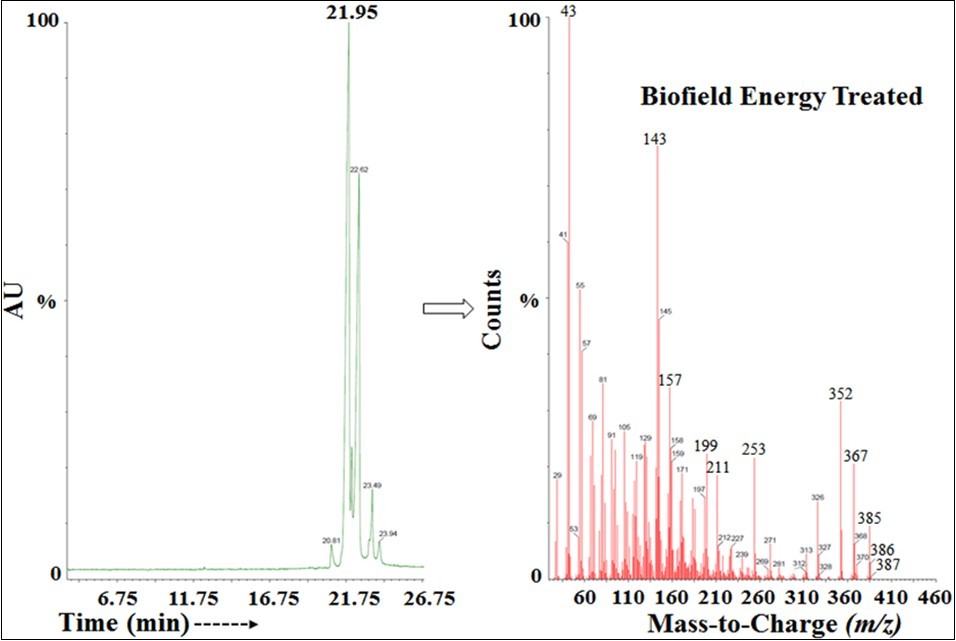
Download figure
LC-MS and GC-MS study confirmed the structure of cholecalciferol. The isotopic abundance ratios of PM+1/PM (2H/1H or 13C/12C or 17O/16O) and PM+2/PM (18O/16O) in the treated cholecalciferol were significantly increased compared to the control sample. The altered isotopic composition of the Trivedi Effect®-Consciousness Energy Healing Treated cholecalciferol might have altered the neutron to proton ratio in the nucleus via the possible mediation of neutrino 15. Neutrino is a subatomic particle but has no electrical charge and a very small mass. These are one of the most abundant particles in the universe. The neutrinos have the ability to interact with protons and neutrons in the nucleus, which might have a close relation between neutrino and the isotope formation 15, 34, 35. The isotopic abundance ratios 2H/1H or 13C/12C or 17O/16O or 18O/16O would influence the atomic bond vibration of treated cholecalciferol 42. The increased isotopic abundance ratio of the treated cholecalciferol may increase the intra-atomic bond strength, increase its stability. The Biofield EnergyTreated cholecalciferol would be more stable and suitable for the prevention and treatment of various diseases such as vitamin D deficiency, rickets, osteoporosis, arthritis, multiple sclerosis, cancer, diabetes mellitus, mental disorders, cardiovascular diseases, hypertension, infections, influenza, cognitive impairment in older adults, Parkinson’s and Alzheimer’s diseases, autoimmune disease, dementia, glucose intolerance, multiple sclerosis, etc.
Conclusions
The Trivedi Effect®-Consciousness Energy Healing Treatment has shown a significant impact on the isotopic abundance ratios of cholecalciferol. The LC-MS spectra of both the samples at retention time (Rt) ~22 minutes exhibited the mass of the molecular ion peak at m/z 385.25. The LC-MS based isotopic abundance ratio of PM+1/PM in the Biofield Energy Treated cholecalciferol was increased by 0.74% compared with the control sample. But, the GC-MS based isotopic abundance ratio of PM+1/PM and PM+2/PM in the Biofield Energy Treated cholecalciferol was significantly increased by 66.39% and 62.69%, respectively compared with the control sample. Hence,13C, 2H, 17O and 18O contributions from C27H44O+ to m/z 386 and 387 in the Biofield Energy Treated cholecalciferol were significantly increased compared with the control sample. The isotopic abundance ratios of PM+1/PM (2H/1H or 13C/12C or 17O/16O) and PM+2/PM (18O/16O) in the treated cholecalciferol were significantly increased compared to the control sample. The increased isotopic composition of the Trivedi Effect®-Consciousness Energy Healing Treated cholecalciferol might have altered the neutron to proton ratio in the nucleus via the possible mediation of neutrino. The increased isotopic abundance ratio of the Biofield Energy Treated cholecalciferol may increase the intra-atomic bond strength, increase its stability. The new form of cholecalciferol would be better designing novel pharmaceutical formulations that might be more stable and more efficacious for the prevention and treatment of various diseases viz. rickets, osteoporosis, arthritis, multiple sclerosis, cancer, diabetes mellitus, mental disorders, cardiovascular diseases, hypertension, infections, influenza, cognitive impairment in older adults, Parkinson’s and Alzheimer’s diseases, autoimmune disease, dementia, glucose intolerance, multiple sclerosis, etc.
References
- 1.Kulie T, Groff A, Redmer J, Hounshell J, Schrager S. (2009) Vitamin D: An evidence-based review. , J Am Board Fam Med 22, 698-706.
- 4.Samuel S, Sitrin M D. (2008) Vitamin D's role in cell proliferation and differentiation. , Nutr Rev 66, 116-124.
- 5.Simana E, Simian R, Portnoy S, Jaffe A, Dekel B Z. (2015) Feasibility Study -Vitamin D loading determination by FTIR-ATR. Information & Control Systems76: 107-111.
- 6.Ritu G, Gupta A. (2014) Vitamin D deficiency in India: Prevalence, causalities and interventions. , Nutrients 6, 729-775.
- 7.Lawson D E, Wilson P W, Kodicek E. (1969) Metabolism of vitamin D. A new cholecalciferol metabolite, involving loss of hydrogen at C-1, in chick intestinal nuclei. , Biochem J 115, 269-277.
- 8.Ross C A, Taylor C L, Yaktine A L, HBD Valle. (2010) Dietary reference intakes for calcium and Vitamin D. Washington (DC): National Academies Press (US);. (access on 02.05.2018)
- 9.Koshy K T, Beyer W F. (1984) Vitamin D3(Cholecalciferol) in analytical profiles of drug substances. , Orlando, USA, Florey K (Ed.), Vol 13, 656-707.
- 10.Collins E D, Norman A W. (2001) . Vitamin D in Handbook of Vitamins, 3rdEdn., Rucker RB, Suttie JW, McCormick DB, Machlin LJ , New York 51-114.
- 11.Lehmann U, Hirche F, Stangl G I, Hinz K, Westphal S et al. (2013) Bioavailability of vitamin D(2) and D(3) in healthy volunteers, a randomized placebo-controlled trial. , J Clin Endocrinol Metab98: 4339-4345.
- 12.Branton A, Jana S. (2017) The influence of energy of consciousness healing treatment on low bioavailable resveratrol in male Sprague Dawley rats. , International Journal of Clinical and Developmental Anatomy 3, 9-15.
- 13.Branton A, Jana S. (2017) The use of novel and unique biofield energy healing treatment for the improvement of poorly bioavailable compound, berberine in male Sprague Dawley rats. , American Journal of Clinical and Experimental Medicine 5, 138-144.
- 14.Branton A, Jana S. (2017) Effect of The biofield energy healing treatment on the pharmacokinetics of 25-hydroxyvitamin D3[25(OH)D3] in rats after a single oral dose of vitamin D3. , American Journal of Pharmacology and Phytotherapy 2, 11-18.
- 15.Trivedi M K, TRR Mohan. (2016) Biofield energy signals, energy transmission and neutrinos. , American Journal of Modern Physics 5, 172-176.
- 16.Rubik B, Muehsam D, Hammerschlag R, Jain S. (2015) Biofield science and healing: history, terminology, and concepts. Global Advances in Health and Medicine 4, 8-14.
- 17.Warber S L, Cornelio D, Straughn J, Kile G. (2004) Biofield energy healing from the inside. , J Altern Complement Med 10, 1107-1113.
- 18.Movaffaghi Z, Farsi M. (2009) Biofield therapies: Biophysical basis and biological regulations?. , Complement Ther Clin Pr 15, 35-37.
- 20.Barnes P M, Bloom B, Nahin R L. (2008) Complementary and alternative medicine use among adults and children: United States. , Natl Health Stat Report 12, 1-23.
- 21.Dabhade Tallapragada RMR, Trivedi M K. (2009) Effect of external energy on the atomic, crystalline, and powder characteristics of antimony and bismuth powders. , Bulletin of Materials Science 32, 471-479.
- 22.Trivedi M K, Patil S.Tallapragada RM Effect of biofield treatment on the physical and thermal characteristics of Silicon, Tin and Lead powders. , J Material Sci Eng 2, 125.
- 23.Nayak G, Trivedi M K, Branton A, Trivedi D, Jana S. (2018) The physicochemical and thermal properties of consciousness energy healing treated silver oxide. (Ag2O). Aspects in Mining & Mineral Science 2, 1-6.
- 24.Nayak G, Trivedi M K, Branton A, Trivedi D, Jana S. (2018) Evaluation of the physicochemical and thermal properties of chromium trioxide (CrO3): Impact of consciousness energy healing treatment. , Research & Development in Material Science 8, 1-6.
- 25.Trivedi M K, Branton A, Trivedi D, Nayak G, Sethi K K et al. (2016) Determination of isotopic abundance ratio of biofield energy treated 1,4-dichlorobenzene using gas chromatography-mass spectrometry (GC-MS). , Modern Chemistry 4, 30-37.
- 26.Trivedi M K, Branton A, Trivedi D, Nayak G, Panda P et al. (2016) Gas chromatography-mass spectrometric analysis of isotopic abundance of13C,2H, and18O in biofield energy treated p-tertiary butylphenol (PTBP). , American Journal of Chemical Engineering 4, 78-86.
- 27.Trivedi M K, Branton A, Trivedi D, Nayak G, Mondal S C et al. (2015) Antimicrobial sensitivity, biochemical characteristics and biotyping ofStaphylococcus saprophyticus: An impact of biofield energy treatment. , J Women’s Health Care 4, 271.
- 28.Trivedi M K, Branton A, Trivedi D, Nayak G, Shettigar H et al. (2015) Antibiogram of multidrug-resistant isolates ofPseudomonas aeruginosaafter biofield treatment. , J Infect Dis Ther 3, 244.
- 29.Trivedi M K, Branton A, Trivedi D, Nayak G, Gangwar M et al. (2015) Agronomic characteristics, growth analysis, and yield response of biofield treated mustard, cowpea, horse gram, and groundnuts. , International Journal of Genetics and Genomics 3, 74-80.
- 30.Sances F, Flora E, Patil S, Spence A, Shinde V. (2013) Impact of biofield treatment on ginseng and organic blueberry yield. , AGRIVITA, Journal of Agricultural Science 35, 1991-8178.
- 31.Trivedi M K, Branton A, Trivedi D, Nayak G, Sethi K K et al. (2016) Isotopic abundance ratio analysis of biofield energy treated indole using gas chromatography-mass spectrometry. , Science Journal of Chemistry 4, 41-48.
- 32.Trivedi M K, Branton A, Trivedi D, Nayak G, Panda P et al. (2016) Evaluation of the isotopic abundance ratio in biofield energy treated resorcinol using gas chromatography-mass spectrometry technique. , Pharm Anal Acta 7, 481.
- 33.Schellekens R C, Stellaard F, Woerdenbag H J, Frijlink H W, Kosterink J G. (2011) Applications of stable isotopes in clinical pharmacology. , Br J Clin Pharmacol 72, 879-897.
- 35.Weisel C P, Park S, Pyo H, Mohan K, Witz G. (2003) Use of stable isotopically labeled benzene to evaluate environmental exposures. , J Expo Anal Environ Epidemiol 13, 393-402.
- 36.KJR Rosman, PDP Taylor. (1998) Isotopic compositions of the elements. , (Technical Report). Pure Appl Chem 70, 217-235.
- 37.Smith R M. (2004) Understanding Mass Spectra: A Basic Approach, Second Edition,John Wiley &Sons,Inc.
- 40.Holick M F, Garabedian M, DeLuca H F. (1972) 5,6-Trans isomers of cholecalciferol and 25-hydroxycholecalciferol. Substitutes for 1, 25-dihydroxycholecalciferol in anephric animals. , Biochemistry 11, 2715-2719.