
Abstract
Background:
Patients with Thal (Thalassemia) are presumed to be inactive for many of the same reasons as healthy adults, though there are limited published data to support this claim. The primary aim of this study was to compare physical activity patterns in subjects with Thal to healthy controls as well as to explore the effects of transfusion therapy on physical activity in transfusion dependent patients with Thal.
Methods:
37 Thal (23 Thal major, 14 Thal intermedia, 21 Female, 27.3±10.1 years) and 30 healthy controls (17 Female, 28.0 ± 13.7 years) wore an ActiGraph accelerometer for one to two weeks.
Results:
Thal subjects recorded a significantly fewer total number of steps per day and lower total energy expenditure compared to healthy controls (p=0.001). None of the adult Thal subjects met the recommended 10,000 steps/day as opposed to 27% of healthy adult controls (p=0.004). Thal spent significantly less time in moderate (p=0.03) to vigorous (p=0.005) activities and more time in sedentary activity (p=0.006).
Conclusion:
It is now clear that Thal spend significantly less time in physically demanding activities than age-matched healthy controls, a result that has long been assumed though not previously documented. Further research is needed to define an appropriate physical activity regimen best suited for patients with Thal while examining its effect on mental and physical health.
Author Contributions
Academic Editor: Vijaya Bhatt, University of Nebraska Medical Center
Checked for plagiarism: Yes
Review by: Single-blind
Copyright © 2015 Ellen B. Fung, et al.
 This is an open-access article distributed under the terms of the Creative Commons Attribution License, which permits unrestricted use, distribution, and reproduction in any medium, provided the original author and source are credited.
Competing interests
The authors have declared that no competing interests exist.
Citation:
Introduction
The 2008 Physical Activity Guidelines for Americans state that adults should participate in a minimum of 30 minutes of moderate level of physical activity per day, children a minimum of 60 minutes. Less than half of US adults meet this recommendation and it is estimated that fewer than 30% of adolescents participate in an hour per day of physical activity1. Patients with Thal are presumed to be inactive for many of the same reasons as healthy adults, though there are limited published data to support these claims. Additionally, there are a number of other factors that may contribute to inactivity in Thal. Chronically low hemoglobin (Hb) levels, either in non-transfusion dependent patients or prior to-transfusion have been associated with reduced exercise performance2, 3. Along with reduced hemoglobin, pain4, depression5, 6, and particularly for children, overprotective parenting can result in reduced physical activity for many patients with Thal. Additionally, patients with Thal major have various complications, which may inhibit or otherwise hamper participation in moderate to vigorous physical activity including iron overload associated cardiomyopathy, hepatitis, diabetes, osteoporosis and hypothyroidism.
While a small number of patients suffer from these co-morbidities, a larger percentage of relatively healthy patients, maintained on optimal chronic transfusion and chelation regimens could benefit from a regular low-intensity physical-activity program. In non-Thal populations, regular physical activity has been shown to decrease depression and improve mood7, school performance8, 9, 10, glucose tolerance11, 12, 13, weight maintenance14, body composition15 and bone health16, 17, 18.
There is a paucity of published literature examining physical activity patterns in hemoglobinopathies. Poor exercise performance and overall less activity have been observed in both adults and adolescent patients with sickle-cell disease19, 20. Very few studies have examined physical activity in patients with Thal, and those that have focused primarily on the effect of iron overload on physical activity2. Thalassemic patients with heart failure and increased myocardial iron had reduced exercise tolerance compared to β-thalassemic patients without heart failure21. In general, those living with chronic illnesses that limit physical endurance have been shown to display lower levels of daily activity22. However, daily physical activity patterns amongst Thal patients, in particular, has yet to be explored. The primary aims of this study were to compare physical activity patterns in subjects with Thal to healthy controls, as well as to explore the effects of transfusion therapy on physical activity in transfusion dependent patients with Thal. Thal subjects were found to be significantly less active compared to age-matched healthy controls using a variety of measures, a result that has long been assumed though not previously documented.
Materials and Methods
A prospective case-control study design was used to evaluate physical activity among patients with Thal relative to healthy controls. Thal subjects and controls were asked to wear an ActiGraph (GT3X) accelerometer for week-long intervals, which measured their physical activity frequency and intensity. Twenty of the Thal patients included herein were also enrolled in a randomized trial testing the effect of vibration therapy on bone health23. The ActiGraph was worn only during non-vibrating periods of the protocol. Additional Thal case subjects were invited to participate from the Children’s Hospital Research Center, Oakland (CHRCO) Hematology outpatient clinic. All case subjects were required to have a Thalassemia diagnosis to participate. They were categorized either as transfusion dependent (TM) if they received red blood cell transfusion therapy on a routine basis, typically every three weeks or a minimum of eight times per year, or non-transfusion dependent (TI) if they were non or intermittently transfused. Healthy controls of Asian or Caucasian decent were recruited from staff, friends and families of staff, and the University of California, Berkeley student body. Exclusion criteria for all subjects consisted of age ≤9 years and pregnancy. The protocol was approved by the Institution Review Board of CHRCO. Participants received information about the nature and purpose of the study and signed informed written consent. Adolescents under the age of 18 signed assent.
The ActiGraph measures frequency and intensity of minute-by-minute body movements in three dimensions: anterior-posterior, medial-lateral, and vertical axis. For highest accuracy, patients wore the ActiGraph on their left hip, close to the body’s center of mass. TM patients wore the ActiGraph for one week prior to and post transfusion. Controls and TI patients were asked to wear the ActiGraph for a complete week, at a pre-scheduled time convenient for them. Valid ActiGraph data was considered to include at least three week days and one weekend day24. All subjects were provided a calendar and asked to record any unusual physical activity patterns (e.g. time on rollercoasters, time off to shower or swim), their bedtime and waking time. Subjects were instructed to wear the ActiGraph only during non-sleeping hours. Readings were recorded throughout waking hours, except when infeasible (e.g. during showering, swimming). After subjects completed their wear-time, ActiGraph data was downloaded and saved using ActiLife version 5.10.0 software (Pensacola,FL).
Accelerometer Data Acquisition
The ActiGraph converts the magnitude of acceleration into activity “counts” per specified time interval (epoch). A sixty-second epoch was used. Storing counts over short epochs is critical to accurately assess physical activity patterns, particularly for subjects with minimal time spent in vigorous bouts of activity. Selected physical activity intensity categories were defined as sedentary, light, moderate, vigorous, and very vigorous, as specified by Freedson (1997). Categories were established by measuring healthy adults wearing ActiGraphs while exercising on treadmills. Subject physical activity was then presented as a percentage time spent in each category (out of 100% weartime). Activity counts were calibrated at different levels of intensity to derive the cut points provided in Table 125. Cut points were similarly derived for pediatric populations26.
Table 1. “Cut Point” Categories as Counts per Physical Activity Intensity Category| Sedentary | Light | Moderate | Vigorous | Very Vigorous | |
| 9 Year Old | 0-149 | 150-499 | 500-1770 | 1771-4360 | 4361-∞ |
| 10 Year Old | 0-149 | 150-499 | 500-1910 | 1911-4588 | 4589-∞ |
| 11 Year Old | 0-149 | 150-499 | 500-2059 | 2060-4832 | 4833-∞ |
| 12 Year Old | 0-149 | 150-499 | 500-2220 | 2221-5094 | 5095-∞ |
| 13 Year Old | 0-149 | 150-499 | 500-2393 | 2394-5375 | 5376-∞ |
| 14 Year Old | 0-149 | 150-499 | 500-2580 | 2581-5679 | 5680-∞ |
| 15 Year Old | 0-149 | 150-499 | 500-2781 | 2782-6007 | 6008-∞ |
| 16 Year Old | 0-149 | 150-499 | 500-3000 | 3001-6363 | 6364-∞ |
| Adult | 0-99 | 100-759 | 760-5724 | 5725-9498 | 9499-∞ |
The ActiGraph’s multifunctional design captures both activity counts and simple step-count data provided by a pedometer. Validity of the step count function has been tested previously using the Actical accelerometer with similar 3-dimensional functionality and software design27.
All subjects completed a 12-15 minute, self-administered Block Work and Home Activities Survey28. For the TM subjects, the survey was conducted during the pre-transfusion visit. The questionnaire encompasses the entire spectrum of behaviors from sleeping and sedentary activities to vigorous and intensive activities. This includes occupational activities, home and typical activities such as childcare and gardening, and various leisure activities, which were found to be important contributors to energy expenditure in the validation of the questionnaire28. Activities were categorized in the survey based on their metabolic expenditure levels (METs; 1 MET = 1 kcal/kg body weight/hour) developed by Dong et al (1999)29. Information on each subject’s employment status and occupation were taken from the Block Work and Home Activities Survey. The subjects were placed into one of four categories based on their occupation type: ‘office-work’ (non-active, mainly sitting, desk work), ‘non-office work’ (more physically demanding work involving standing, heavy lifting, and long hours standing), ‘student’ and ‘unemployed.’
Weight and height were obtained and body mass index (BMI) was calculated for all subjects. Laboratory results, including liver iron concentration (LIC) assessed by Super conducting Quantum Interference Device (SQUID), pre-transfusion Hb, and serum ferritin were obtained from case subjects’ medical records. Dates of transfusion were abstracted from medical records in order to accurately document the time periods around ActiGraph recordings.
Data Analysis
Adults were defined as individuals ≥18 years of age similar to definitions in the activity studies by Freedson, 1997. Subject’s race was recorded and categorized based on the NIH Policy on Reporting Race and Ethnicity (2001)30. Specific calculations were made as follows: step-count data recorded by the ActiGraph were compared amongst groups (Thal vs. controls, Pre/Post Tx) and to current recommendations. Adults meeting the recommendations were defined as those with steps ≥10,000 steps/day or subjects <18 years steps ≥ 12,00031, 32, 33.
Data were first plotted and normality tests run to check for outliers, ranges and distribution assumptions. Summary statistics were then computed including means, standard deviations (SD) or standard error of the mean (SEM) and 95% confidence intervals (CI) for variables at each time point within each group. Categorical variables were analyzed by chi-square test, and continuous variables by Student’s t-test, with pooled (for equal variances) or Satterwaite (for unequal variances) p-value. Analysis of variance models with repeated measures over time (ANOVA) were run for pre-post transfusion data, controlling for baseline as necessary. Statistical analyses were conducted using Stata 9.2 (Stata, Inc., College Station, TX). A significance level of p<0.05 was used for all statistical tests, with a p value of <0.1 considered a trend.
Sample Size Determination
Prior to this study, there were no objective studies of physical activity patterns in patients with Thal. To judge the adequacy of the proposed sample size for testing the level of physical activity in comparison with healthy subjects without Thal, we considered pilot data gathered from our center (unpublished) along with published NHANES data from healthy individuals in the US26. For time spent in sedentary activity, we observed an average of 11.6±2.1 hours for those with Thal compared to 7.5±0.5 hours for healthy individuals. Using these data, assuming a 5% Type 1 error rate, with 5 patients per group, we estimated a 95% power to detect a difference between the Thal and Controls. For the average number of counts per minute, we observed Thal patients averaged 238±67 counts/min compared to published controls: 390±50. Using these data, assuming a 5% Type 1 error rate, with 6 patients per group we would have 95% power to detect a difference between the Thal and controls. Given the protocol was designed to include older and younger subjects, pre/post transfusion, we estimated we would need at least 27 subjects (6 * 4 groups plus 10% overage) in order to detect statistical differences in most of the physical activity variables observed. Our plan was to recruit 30 healthy controls and up to 40 Thal subjects to meet our aims.
Results
Forty-three subjects with Thal and 31 healthy controls were initially invited to participate in the study. Three adult Thal subjects (2 Male, 1 Female) either moved or expired prior to consenting to the study. Additionally, three adult male Thal subjects dropped after consenting due to scheduling difficulties. One healthy control was excluded after consenting when it was discovered he had a diagnosis of Thal trait. Therefore, a total of 37 Thal (23 transfusion dependent, 14 non-transfusion dependent or intermittently transfused) and 30 healthy controls were included in the analysis. Data was summarized from the ActiGraph for an average of 7.0 ± 1.6 days for Thal and for 7.9 ± 1.7 days for the healthy control groups. The genotypes of the transfused and non-transfused subgroups are provided in Table 2. There were no significant differences observed between the Thal and healthy control groups in terms of age, gender, height, weight, BMI or race.
Table 2. Basic demographics, anthropometry, socioeconomic and clinical characteristics of subjects with Thal (TM and TI) and healthy controls| Thalassemia(Tx)(n=23) | Thalassemia(Non-Tx)(n=14) | Control(n=30) | p-value | |
| Age, years | 29.8 ± 10.5(25.3, 34.3) | 22.9 ± 8.0(18.2, 27.5) | 28.0 ± 13.7(22.8, 33.1) | NS |
| % <18 years | 17.4 | 42.9 | 26.7 | NS |
| % >18 years | 82.6 | 57.1 | 73.3 | NS |
| Race (n, %) | White (6, 26.1)Asian (16, 69.6)Pacific Islander (0)Other (1, 4.4) | White (3, 21.43)Asian (11, 78.6)Pacific Islander (0)Other (0) | White (2, 6.7)Asian (20, 66.7)Pacific Islander (5, 16.7)Other (3, 10.0) | 0.09 |
| Gender | ||||
| Male (n, %) | 8 (34.8) | 8 (57.1) | 13 (43.3) | NS |
| Female (n, %) | 15 (65.2) | 6 (42.9) | 17 (56.7) | NS |
| Employment | ||||
| Employed (n, %) | Employed (14,60.9)Unemployed (3, 13.0)Student (6 26.1) | Employed (5, 35.7)Unemployed (3 ,21.4)Student (6 ,42.9) | Employed (12, 40)Unemployed (0)Student (18, 60) | 0.019 |
| Occupation (n, %) | Office Work (9,39.1)Non-Office Work (7, 30.4)Student (6, 26.1)Unemployed (1, 4.4) | Office Work (2,14.3)Non-Office Work (4, 28.6)Student (6, 42.9)Unemployed (2,14.3) | Office Work (12, 40)Non-Office Work (0)Student (18, 60)Unemployed (0) | 0.001 |
| Thalassemia Genotype, (n) | B-thalassemia (16)E-B-thalassemia (6)HbH (0)HbHCS (1) | B-thalassemia (4)E-B-thalassemia (1)HbH (1)HbHCS (8) | 0.001 | |
| Liver Iron Concentration, ug /g wet weight ^ | 1480 ± 1161(965, 1995) | 1753 ± 1282(977, 2528) | NS | |
| Ferritin, ng/mL * | 1871 ± 1288(1314, 2428) | 570 ± 588(214, 925) | n/a | 0.002 |
| Hemoglobin, g/ dL * | 10.1 ± 1.2(9.6, 10.6) | 8.8 ± 1.5(7.9, 9.7) | n/a | 0.006 |
| Height, cm | 156.0 ± 8.1(152, 159) | 155.0 ± 11.9(148, 161) | 161.0 ± 13.1(156, 166) | NS |
| Weight, kg | 50.5 ± 8.7(46.7, 54.2) | 53.5 ± 15.4(44.6, 62.3) | 58.1 ± 16.5(52.0, 64.3) | NS |
| Body mass index, kg/m 2 | 20.8 ± 3.2(19.4, 22.2) | 22.1 ± 5.0(19.2, 25.0) | 21.9 ± 3.9(20.4, 23.4) | NS |
Employed Thal subjects, both TM and TI, were more likely to have ‘non-office work’ jobs, which included factory work, traveling sales, retail clerks and other physically demanding jobs. All employed controls were involved in ‘office-work’ type jobs, which primarily consisted of sitting at a desk for most of the workday. Employment status and occupation by group are provided in Table 2.
As expected, TM subjects presented greater pre-transfusion hemoglobin and serum ferritin levels compared to TI subjects (Table 2). However, LIC, reflecting total body iron stores, were similar between TM and TI subjects.
Overall, Thal subjects recorded a significantly fewer total number of steps per day compared to healthy controls (Table 3, p=0.001). This observation was significant for both Thal age groups, adults and adolescents (Figure 1). Further analysis revealed that none of the adult Thal subjects met the recommended number of steps/day (10,000) as opposed to a little over one quarter of the healthy adult control group. Similar trends were observed for the sub-group of Thal adolescents (Table 3).
Table 3. Physical activity patterns and energy expenditure assessed by ActiGraph compared with self-assessment in subjects with Thal and healthy controls| Thalassemia n=37 | Control n=30 | p-value | |
| Total steps/day | |||
| All Subjects | 5321 ± 1972 | 8323 ± 3377 | 0.001 |
| Kids (<18 years) | 4766 ± 1507 | 9220 ± 2944 | 0.001 |
| % met recommendations* | 0% | 25% | 0.09 |
| Adults (>18 years) | 5526 ± 2107 | 7997 ± 3527 | 0.004 |
| % met recommendations* | 0% | 27% | 0.004 |
| Energy Expenditure (Kcal/day) measured from Actigraph | |||
| All subjects | 1227 ± 765 | 2450 ± 1798 | 0.001 |
| Kids (<18 years) | 844 ± 341 | 1288 ± 838 | 0.14 |
| Adults (≥18 years) | 1369 ± 832 | 2872 ± 1878 | 0.001 |
| Energy Expenditure (Kcal/day) estmated from Block PA Survey Questionnaire** | |||
| All subjects | 1914 ± 791 | 1940 ± 694 | NS |
| Kids (<18 yrs) | 1328 ± 388 | 1333 ± 693 | NS |
| Adults (>18 yrs) | 2117 ± 798 | 2160 ± 560 | NS |
| % Time Spent in Different Activities | |||
| % time in sedentary activity | |||
| All subjects | 72.1 ± 9.2 | 65.6 ± 9.3 | 0.006 |
| Kids (<18 yrs) | 72.0 ± 6.5 | 56.6 ± 9.5 | 0.001 |
| Adults (>18 yrs) | 72.1 ± 10.1 | 68.8 ± 6.9 | NS |
| % time in light activity | |||
| All subjects | 17.3 ± 8.0 | 19.1 ± 5.4 | NS |
| Kids (<18 yrs) | 13.1 ± 2.5 | 16.3 ± 3.3 | 0.036 |
| Adults (>18 yrs) | 18.9 ± 8.8 | 20.1 ± 5.8 | NS |
| % time in moderate activity | |||
| All subjects | 10.2 ± 4.5 | 12.8 ± 5.0 | 0.03 |
| Kids (<18 yrs) | 13.4 ± 4.3 | 18.9 ± 4.3 | 0.015 |
| Adults (>18 yrs) | 9.1 ± 4.0 | 10.6 ± 3.1 | NS |
| % time in vigorous activity | |||
| All subjects | 0.5 ± 0.7 | 2.3 ± 3.8 | 0.005 |
| Kids (<18 yrs) | 1.4 ± 0.7 | 7.5 ± 4.0 | <0.001 |
| Adults (>18 yrs) | 0.1 ± 0.2 | 0.4 ± 0.5 | 0.007 |
| % time in very vigorous activity | |||
| All Subjects | 0.1 ± 0.1 | 0.3 ± 0.5 | 0.02 |
| Kids (<18 yrs) | 0.1 ± 0.2 | 0.8 ± 0.8 | 0.016 |
| Adults (>18 yrs) | 0.0 ± 0.0 | 0.1 ± 0.2 | NS |
| Hours of Sleep, Subject Estimated from Survey Questionnaire^ | |||
| Adults (>18 yrs) | 7.0 ± 1.4 | 6.8 ± 0.9 | NS |
| Reported time watching television, hours | 4.4 ± 1.5 | 3.7 ± 1.9 | 0.075 |
| Reported time in all sedentary activities, hours | 6.1 ± 3.3 | 4.3 ± 2.6 | 0.015 |
| METminutes, including all activities by self-assessment questionnaire | |||
| Total Sample | 2308 ± 844 | 1973 ± 564 | 0.068 |
| Kids (<18 yrs) | 1975 ± 945 | 2319 ± 620 | NS |
| Adults (>18 yrs) | 2437 ± 784 | 1848 ± 499 | 0.004 |
| METminutes, including all non-job activities by self-assessment questionnaire | |||
| Total Sample | 1472 ± 876 | 1209 ± 553 | NS |
| Kids (<18 yrs) | 1448 ± 912 | 1482 ± 545 | NS |
| Adults (>18 yrs) | 1482 ± 880 | 1110 ± 534 | 0.09 |
| Subjects Met Physical Activity Guidelines_ Healthy People 2010 (%) ^^ | 58.3% | 70.0% | NS |
Figure 1.Total Number of Steps Per Day Assessed by ActiGraph in Patients with Thal (n=37) Compared to Healthy Controls (n=30) divided by Age Group. *Step recommendations for adolescents (12,000 steps/day33) and for adults (10,000 steps/day32)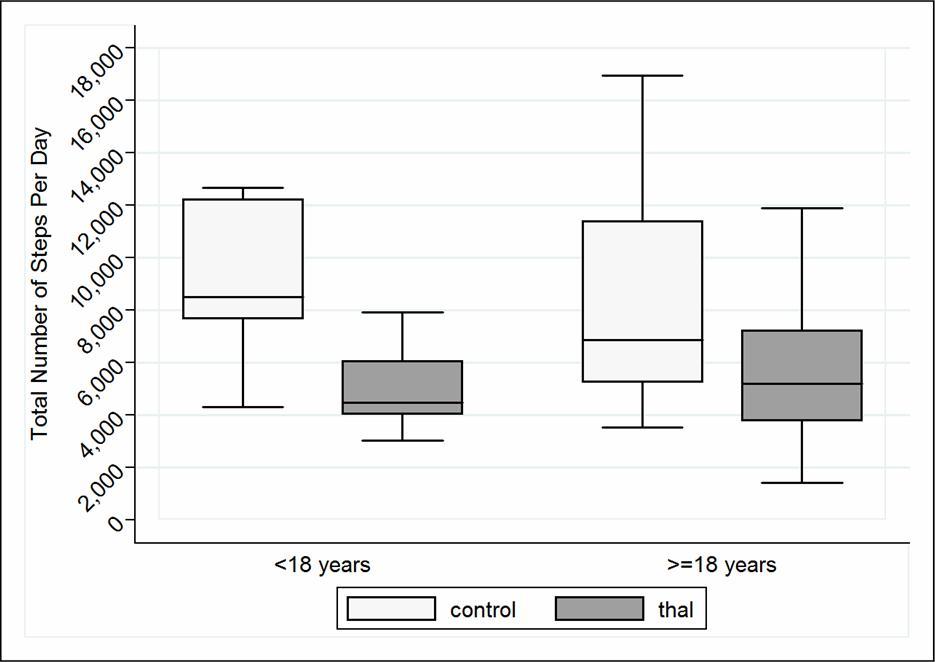
Thal subjects had a significantly lower total energy expenditure (Kcal/day) measured by ActiGraph (p=0.001), a result which appeared to be driven primarily by the adult sub-group. Though when energy expenditure was calculated from the self-reported Physical Activity Survey Questionnaire, there were no significant differences between groups.
Compared with controls, overall subjects with Thal spent significantly less time in moderate (p=0.03), vigorous (p=0.005) and very vigorous (p=0.02) activity and more time in sedentary activity (p=0.006). However, in sub-group analysis it became clear that there were no significant differences observed between adult controls and adult Thal subjects in most activity intensities, other than the small amount of time spent per day in vigorous activities (p=0.007). The distinctive activity patterns for the adolescent Thal compared to healthy controls are illustrated in Figure 2.
Figure 2.Activity Patterns of Daily Living in Young Subjects with Thal Compared to Young Healthy Controls. Thal youth (<18 years) spent significantly less time in light, moderate, vigorous and very vigorous activity and more time in sedentary activity compared to healthy controls (<18).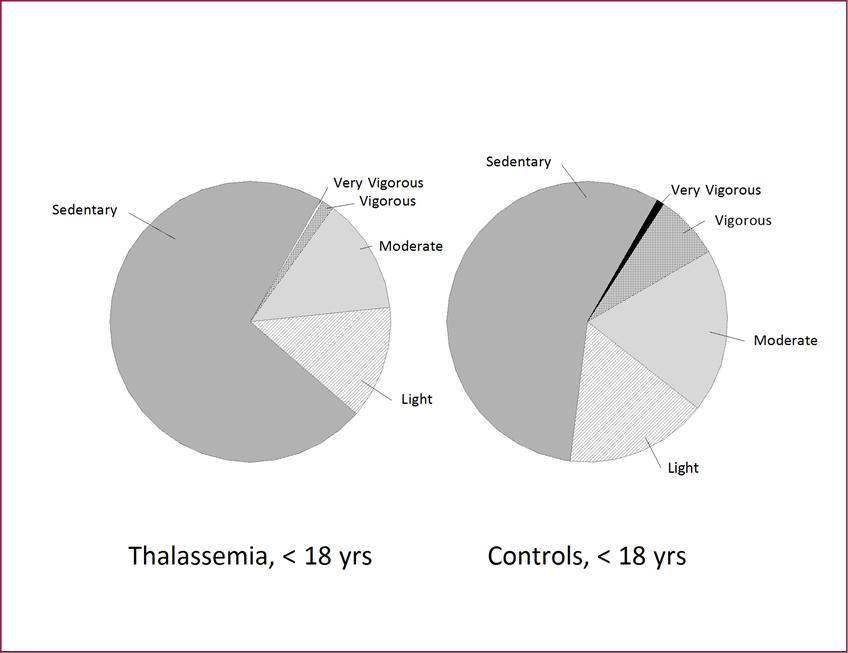
Confirming their increased time spent in sedentary activities, Thal subjects reported engaging in their combined time spent watching TV, surfing the internet, driving and other sitting-type-activities in the Self-Assessment Survey Questionnaire.
There were no differences in total hours of sleep per night for adult Thal subjects compared to healthy controls when subjects estimated their usual sleeping habits in the Survey Questionnaire (Table 3). However, when asked to record actual sleeping and waking time on a calendar, Thal adults spent significantly more total hours sleeping, on average spending 1 more hour asleep each night compared to healthy adult controls (p=0.046).
Transfused subjects began recording data from their ActiGraph on average 6.0 ± 2.9 days prior to transfusion, and again following, starting to record on average 2.3 ± 2.9 days after their transfusion day (Table 4). There was no significant difference in steps per day when comparing TM subject’s physical activity patterns pre versus post transfusion. Of interest, none of these subjects met the U.S. recommendations for steps per day (10,000 steps/day for adults and 12,000 steps/day for adolescents) prior to their transfusion date, while three subjects met the recommendations post transfusion. Gender, BMI, Hb and serum ferritin were not significant modifiers to step count during the transfusion cycle for these subjects.
Despite the noteworthy trend in overall number of steps taken following a transfusion, results indicated that TM subjects had no significant difference in energy expenditure and time spent in various activity intensities prior to and following their transfusion (Table 4).
Table 4. Physical activity patterns and energy expenditure assessed by ActiGraph in subjects with Thal prior to and following red blood cell transfusion.*| Pre-Transfusion n=20 | Post-Transfusion n=20 | p-value | |
| Total Steps/day | 4715 ± 1714 | 5550 ± 2616 | NS |
| % Recommendations met | 0% | 15% | 0.08 |
| Total Steps/day Active Subjects Only^ | 4399 ± 1943 | 6108 ± 3027 | 0.11 |
| % Time spent in different intensity exercises | |||
| % Sedentary | 72.3 ± 8.5 | 70.1 ± 11.3 | NS |
| % Light | 18.5 ± 7.4 | 18.3 ± 9.4 | NS |
| % Moderate | 8.9 ± 3.9 | 11.1 ± 7.3 | NS |
| % Vigorous | 0.4 ± 0.6 | 0.5 ± 0.1 | NS |
| % Very Vigorous | 0.0 ± 0.1 | 0.0 ± 0.1 | NS |
| Total Energy Expenditure (Kcal/day) | 1045 ± 531 | 1015 ± 487 | NS |
| Total Energy Expenditure Active Subjects Only^ | 995 ± 592 | 1090 ± 527 | NS |
Discussion
This is the first study to have measured the activities of daily living in Thal subjects using ActiGraph technology. The results indicated that when compared to age-matched controls, Thal subjects took significantly fewer total number of steps per day. This result was corroborated with the total energy expenditure, as Thal subjects also had significantly lower total kilocalories expended per day, measured by the ActiGraph, compared to controls.Major differences were recorded in the patterns of the activities in Thal subjects versus controls. Of these, amount of time spent in sedentary and vigorous activities stood out as the most prominent. Unexpectedly, these differences were most notable in Thal youth. Thal youth spent 72% of time in sedentary activity, compared to age-matched control youth (only 56%, Figure 2). It is now clear that physical activity is reduced during activities of daily living in patients with Thal, a result that has long been assumed though not yet documented.
Though no other studies have examined general physical activity patterns among Thal patients, others have explored exercise capacity and performance, focusing on the effects of iron overload and its’ subsequent comorbidities. Mavrogeni et al34 assessed exercise in patients with B-Thal and heart failure using a treadmill protocol. They observed reduced values of exercise indexes associated with myocardial T2*, a magnetic resonance parameter indicating elevated iron concentration in the heart. Sohn and colleagues2 also studied the influence of somatic and cardiac iron overload on exercise performance in a large (n=71) TM patient cohort. They found decreased aerobic capacity in Thal patients and concluded that the observed exercise limitation is related to systemic inflammation, degree of anemia and cardiac iron burden. Geordie and colleagues35 examined cardiorespiratory response to exercise on a cycle ergometer in Thal and found a significantly lower peak oxygen consumption during incremental exercise compared to control subjects. Abnormally high heart rate and cardiac output (associated with hypoventilation) were also recorded in Thal subjects during exercise. This study re-tested Thal patients 3 to 8 days after transfusion and found no significant improvement in ventilation or circulation, a result that is consistent with our findings.
The reason for the inactivity observed in patients with Thal in this study may be similar to healthy adults without Thal, though there are limited published data to support these claims. These restrictions may include limited time, lack of motivation, fatigue or lethargy and competing interests. Additionally, they have a myriad of other factors, which may deter from an active lifestyle. One of the most evident reasons is chronic pain, which is increasingly common among Thal patients36. Pain can restrict daily physical activity and dissuade incentives to exercise. Chronic pain can lead to fear of injury: another important reason Thal subjects can be more inactive than their healthy counterparts. Incessant fear of exacerbating their symptoms can lead to a more sedentary lifestyle. Many patients are fearful of cardiomyopathy. Having witnessed fellow patients suffer and on occasion die of heart failure, they find themselves reluctant to stress their hearts with rigorous exercise, whether or not the fear is unfounded. These types of fears may not only come from the patient; parents of Thal children are commonly found to constrain their child’s physical activity.
High rates of depression37 and fatigue found in Thal subjects can also limit a patient’s incentives to stay active. An orthogonal factor to these disincentives to exercise are the set of physical limitations that present with Thalassemia. In particular, Thal subjects have reportedly higher percentage body fat per body weight (that is, they are less lean for body weight)38. Less lean cell mass results in less overall muscle mass to propel and/or sustain an individual during exercise. Lower lean cell mass could equate to fatigue combined with anemia and lead to limited exercise capacity.
Our findings have important implications: they point to potential health benefits for Thal subjects if physical activity levels are increased. A physical activity regimen would be most effective if implemented early on, and in small steps. As with most exercise intervention programs, they are most effective if incorporated when an individual is young, when they can integrate the routine as part of daily schedule. Further, Thal adults more commonly have exercise limiting co-morbidities. For example, a promising potential outcome is increased bone density/strength with a concomitant decreased risk of osteoporosis, a co-morbidity observed in up to 70% of adults with Thal39. A systematic review of the literature on physical activity and bone strength supports the positive association between weight-bearing exercise and the buildup of bone mass in the growing years40.
A negative association between Thal and physical activity can carry implications beyond patients’ physical health. Regular physical exercise has been associated with positive mental health benefits41, and better sleep. Etiology of this includes endorphin release, increase in cortical blood flow, reduced emotional strain, buffer against stress, distraction from negative preoccupations, and increase self-esteem41. Subjects with Thal slept one hour more per night compared to the controls, though we did not assess the quality of sleep. Recent research suggests that both too much and too little sleep are associated with adverse health outcomes42. The optimal amount of sleep appears to be between 6 to 8 hours per night. In this study, a number of patients with Thal slept more than 9 hours per night, which Cappucio and colleagues suggest is can be used as a diagnostic tool related to long-term health consequences. Further research is needed to assess the importance of these mechanisms to improve overall quality of life among those suffering from Thal.
This study was limited in its sample size, particularly for the cohort of transfused subjects. Consequently, our assessment of the effect of transfusion therapy on physical activity patterns may be imprecise. We were also limited by the inability to match occupational status in the case and control subjects. However, if anything, this worked to our disadvantage in that the Thal group participated in more physically demanding jobs, where one might expect overall energy expenditure to be higher. Moreover, given we did not assess pain or mood in this study, we were limited by the inferences we could draw linking physical activity to overall quality of life.
Additionally, we found it interesting that measured activity (by ActiGraph) and those by self-report did not corroborate, particularly for the Thal subjects. Perhaps subjects with Thal perceive themselves to be more active, or desire to be more active than they currently are. Whatever the etiology, this topic requires further exploration in future research.
Conclusion
In conclusion, Thal subjects recorded significantly less total number of steps per day compared to healthy controls. Additionally, substantial differences in daily activity patterns were observed, with Thal subjects taking part in less vigorous activities and more sedentary activities. These findings suggest a substantial degradation in overall physical activity as a result of the various ailments associated with Thal. This provides needed grounding to the common perception that Thal patients exhibit significantly less exercise than their healthy counterparts. Further research is needed following Thal patients in a physical activity regimen best suited to their needs while examining any changes in mental and physical health.
Financial Support
This publication was supported in part by the Cooley’s Anemia Foundation and by the National Center for Advancing Translational Sciences, National Institutes of Health, through the UCSF-CTSI Grant Number UL1 TR000004. Its contents are solely the responsibility of the authors and do not necessarily represent the official views of the NIH.
Acknowledgements
The authors would like to thank the patients and their families for their time in volunteering for the study, as well as Catherine Gariepy for her initial assistance and enthusiasm for the project, Elizabeth Scott, who assisted with data management and quality control of the ActiGraph data and Ginny Gildengorin, PhD who provided statistical support and expertise during the data analysis phase.
References
- 1. (2008) Physical activity guidelines for Americans. In: Physical activity Guidelines advisory committee: physical activity guidelines advisory committee. report,2008,Washington,D.D. U.S. Department of Health and Human Services;2008. http://health.gov/paguidelines/pdf/paguide.pdf. Accessed 15May2015 .
- 2.Sohn E Y, Kato R, Noetzli L J. (2013) Exercise performance in thalassemia major: correlation with cardiac iron burden. , Am J Hematol 88, 193-197.
- 3.Marinov B I, Terziyski K V, Sapunarova K G, Kostianev S S. (2008) Exercise performance in children with severe beta-thalassemia before and after transfusion. Folia Med (Plovdiv). 50(4), 48-54.
- 4.Oliveros O, Tracthenberg F, Haines D. (2013) Pain over time and its effects on life in thalassemia. , Am J Hematol 11, 939-43.
- 5.Yengil E, Acipayam C, Kokacya M H. (2014) Anxiety, depression and quality of life in patients with beta thalassemia major and their caregivers. , Int J Clin Exp Med 7(8), 2165-72.
- 6.Yahia S, El-Hadidy M A, El-Gilany A H. (2013) Predictors of anxiety and depression in Egyptian thalassemic patients: a single center study. , Int J Hematol 97(5), 604-9.
- 7.Chu A H, Koh D, Moy F M. (2014) Muller-Riemenschneider F. Do Workplace physical activity interventions improve mental health outcomes?. , Occup Med 64(4), 235-245.
- 8.Fox C K, Barr-Anderson D, Neumark-Sztainer D, Wall M. (2010) Physical activity and sports team participation: associations with academic outcomes in middle school and high school students. , J Sch Health 80(1), 31-37.
- 9.So W Y. (2012) Association between physical activity and academic performance in Korean adolescent students. , BMC Public Health 12, 258.
- 10.Wang P S, Huang Y C, Wu S F. (2014) Effects of daily energy expenditure on academic performance of elementary students in Taiwan. , Japan Journal of Nursing Science 11, 1-9.
- 11.Yates T, Davies M, Gorely T. (2009) Effectiveness of a pragmatic education program designed to promote walking activity in individuals with impaired glucose tolerance: a randomized controlled trial. , Diabetes Care 32(8), 1404-10.
- 12.Ross R, Hudson R, Stotz P J, Lam M. (2015) Effects of exercise amount and intensity on abdominal obesity and glucose tolerance in obese adults: a randomized trial. , Ann Intern 162(5), 325-334.
- 13.Popp Switzer M, Elhanafi S, San Juan ZT. (2015) Change in daily ambulatory activity and cardiovascular events in people with impaired glucose tolerance. Curr Cardiol Rep.;17(3):. 562.
- 14.Drenowatz C, Jakicic J M, Blair S N, Hand G A. (2015) Differences in correlates of energy balance in normal weight, overweight and obese adults. Obes Res Clin Pract 8:S1871-403X.
- 15.Guo W, Bradbury K E, Reeves G K, Key T J. (2015) Physical activity in relation to body size and composition in women in. , UK Biobank. Ann Epidemiol 25(6), 406-413.
- 16.MacKelvie K J, McKay H A, Petit M A, Moran O, Khan K M. (2002) Bone mineral response to a 7-month randomized controlled, school-based jumping intervention in 121 prepubertal boys: associations with ethnicity and body mass index. , J Bone Miner Res 17, 834-844.
- 17.Mackelvie K J, McKay H A, Khan K M, Crocker P R. (2001) A school-based exercise intervention augments bone mineral accrual in early pubertal girls. , J. Pediatr 139, 501-508.
- 18.Hind K, Burrows M. (2007) Weight-bearing exercise and bone mineral accrual in children and adolescents: a review of controlled trials. , Bone 40, 14-27.
- 19.Vincent L, Feasson L, Oyono-Enguelle S. (2010) Skeletal muscle structural and energetic characteristics in subjects with sickle cell trait, a-thalassemia, or dual hemoglobinopathy. , J Appl Physiol 109, 728-734.
- 20.Buchowski M S, Chen K Y, Byrne D, Wang W C. (2002) Equation to estimate resting energy expenditure in adolescents with sickle cell anemia. , Am J Clin Nutr 76, 1335-44.
- 21.Mavrogeni S, Gotsis E, Verganelakis D. (2009) Effect of iron overload on exercise capacity in thalassemic patients with heart failure. , Int J Cardiovasc Imaging 25, 777-783.
- 22.Tudor-Locke C, Craig C L, Aoyagi Y. (2011) How many steps/day are enough for older adults and special populations. , J Behavioral Nutr Physical Activity 8(80), 1-19.
- 23.Fung E B, Gariepy C A, Sawyer A J. (2012) The effect of whole body vibration therapy on bone density in patients with thalassemia: a pilot study. , Am J Hematol 87(10), 76-9.
- 24.Trost S G, Pate R R, Freedson P S. (2000) Using objective activity measures with youth: how many days of monitoring are needed? Med Science Sports Exercise.32:. 2, 426-31.
- 25.Freedson P S, Melanson E, Sirard J. (1997) . , Calibration of the Computer Science and Applications, Inc. Accelerometer. Med Sci Sports Exerc 30(5), 777-781.
- 26.Troiano R P, Berrigan D, Dodd K W, Masse L C, Tilert T et al. (2008) Physical activity in the United States measured by accelerometer. , Med Sci Sports Exerc 40, 181-188.
- 27.Eslinger D W, Probert A, Conner Gorber S. (2007) Validity of the Actical Accelerometer Step-Count Function. Med Sci Sports Exerc. 39(7), 1200-4.
- 28.Block G, Jensen C D, Block T J. (2009) The work and home activities questionnaire: energy expenditure estimates and association with percent body fat. , Journal of Physical Activity and Health 6, 61-69.
- 29.Dong L, Block G, Mandel S. (2004) Activities contributing to total energy expenditure in the United States: Results from the NHAPS survey. , IJBNPA 1(4), 1-11.
- 30. (2001) NIH policy on reporting race and ethnicity data:subjects in clinical research.In:National institutes. in health. http://grants.nih.gov/grants/guide/notice-files/NOT-OD-01-053.html. Accessed 12April2015
- 31.Tudor-Locke C, Craig C L, Aoyagi Y. (2011) How many steps/day are enough for older adults and special populations. , IJBNPA 8(80), 1-19.
- 32.Tudor-Locke C, Craig C L, Brown W J. (2011) How many steps/day are enough: for Adults. , IJBNPA 8(79), 1-17.
- 33.Tudor-Locke C, Craig C L, Brown W J. (2011) How many steps/day are enough: for Children and Adolescents. , IJBNPA 8(78), 1-14.
- 34.Mavrogeni S, Gotsis E, Verganelakis D. (2009) Effect of iron overload on exercise capacity in thalassemic patients with heart failure. , Int J Cardiovasc Imaging 25, 777-783.
- 35.Grant G P, Graziano J H, Seaman C, Mansell A. (1987) Cardiorespiratory Response to Exercise in Patients with Thalassemia Major. Am Rev Respir Dis. 136, 92-97.
- 36.Oliveros O, Tracthenberg F, Haines D. (2013) Pain over time and its effects on life in thalassemia. , Am J Hematol 11, 939-43.
- 37.Shafiee A, Nazari S, Jorjani S. (2014) Prevalence of depression in patients with B-thalassemia as assessed by the Beck’s Depression Inventory. , Hemoglobin 38(4), 289-91.
- 38.Fung E B, Xu Y, Kwiatkowski J. (2010) Relationship between Chronic Transfusion Therapy and Body Composition in Subjects with Thalassemia. , Journal of Pediatrics 157(4), 641-7.
- 39.Vogiatzi M G, Macklin E A, Fung E B. (2009) Bone disease in Thalassemia: a frequent and still unresolved problem. , J Bone Miner Res 24(3), 543-557.
- 40.Tan V P, Macdonald H M, Kim S. (2014) Influence of physical activity on bone strength in children and adolexcents: a systematic review and narrative synthesis. , J Bone Miner Res 29(10), 2161-81.
Cited by (3)
- 1.Sayani Farzana A., Lal Ashutosh, Tasian Gregory E., Mukaddam Mona Al, Killilea David W., et al, 2022, Kidney Stones in Transfusion-Dependent Thalassemia: Prevalence and Risk Factors, Open Journal of Urology, 12(04), 209, 10.4236/oju.2022.124021
- 2.Fung Ellen B., Goldberg Elijah K., Bambot Sakina, Manzo Raquel, Lal Ashutosh, 2022, Relationships among Physical Activity, Pain, and Bone Health in Youth and Adults with Thalassemia: An Observational Study, Thalassemia Reports, 12(3), 90, 10.3390/thalassrep12030014
- 3.Fung Ellen B., 2016, The importance of nutrition for health in patients with transfusion‐dependent thalassemia, Annals of the New York Academy of Sciences, 1368(1), 40, 10.1111/nyas.13003