
Abstract
Falls continue to be a health concern for older adults. Gender and age are key predictors of falls, particularly for those with low health literacy. Data were collected by a State Health Department using the state-led supplemental question option for the Centers for Disease Control and Prevention (CDC) Behavior Risk Factor Surveillance System (BRFSS) survey. Specifically, trend data for respondents were examined by gender, geographic location and health literacy rate. Results indicated the highest mean number falls occurred with men for those within the metropolitan statistical area (MSA) city code, lowest in suburban areas. Females reported to have a higher estimated mean number of falls and injuries than males. For males, the number of falls and injuries tended to decrease with higher health literacy. The findings support the importance of addressing fall prevention for older adults. Long term implications for improving fall prevention and health literacy for older adults include impact on individual outcomes.
Author Contributions
Academic Editor: Ian James Martins, Edith Cowan University, Australia, Email: [email protected]
Checked for plagiarism: Yes
Review by: Single-blind
Copyright © 2018 Amy K. Chesser, et al.
 This is an open-access article distributed under the terms of the Creative Commons Attribution License, which permits unrestricted use, distribution, and reproduction in any medium, provided the original author and source are credited.
Competing interests
The authors have declared that no competing interests exist.
Citation:
Introduction
Among older adults, falls are the number one cause of fatal and non-fatal injuries {Centers for Disease, 2006 #67}. In 2014, the number of falls experienced by older adults was 29 million. That number is estimated to increase and the need for fall prevention continues to be supported by the evidence {Larson, 2017 #68}. Gender and age are key predictors of falls 1, 2, 3, 4. For adults ≥65 years of age, the risk for falls can increase due to a number of concomitant factors related to ageing. Cognitive decline, changes in visual acuity, decreases in muscle strength, polypharmacy, and changes in balance and gait are commonplace sequelae of the ageing process; each of which is associated with an additional risk for accidental falls. Most of the identified risk factors for falls are modifiable, and a number of falls prevention programs and interventions exist 5. However, the effectiveness of such programs can be attenuated or negated in populations with low health literacy 6, 7.
Understanding how health literacy and demographic factors contribute to the incidence of falls, particularly falls that result in injury, is key to modifying existing fall prevention interventions to be more efficacious with older adults with low health literacy. A few studies have examined health literacy and falls in an older adult population. For example, Jaffee et al. (2016) examined hospital readmission rates and falls after hospital discharge. Poor vision was found to be an independent predictor of a post-discharge fall. While low health literacy was associated with greater readmissions, low health literacy was determined to be a non-significant factor in fall risk. However, Jaffee et al. only investigated 30-post discharge follow-up using inpatients from one hospital. The CDC reports less than half of fall victims go to the doctor to seek help following a fall, meaning there is very little information regarding the association between falls and health literacy in the larger population. In addition, health literacy levels are not frequently measured by health providers. This gap in the literature is more important when the disparities in health care access in rural populations is considered.
The objective of this study was to examine health literacy rates and falls for adults age 65 and older using data from the Kansas Behavioral Risk Factor Surveillance System (BRFSS).
Methods
This study was a retrospective analysis of state-wide data. Data were collected as part of a state wide Behavioral Risk Factor Surveillance System (BRFSS) survey. The BRFSS is a randomly sampled national telephone survey conducted by the Centers for Disease Control and Prevention (CDC) which collects self-reported information about health-related risk behaviors, preventive service use, and chronic health conditions for adults aged 18 years and older. Detailed survey methodology has described by the Chesser, et al. 8. Health literacy data were collected through the supplemental, state-specific module of the BRFSS telephone survey. Data were analyzed using SPSS release 24.0 (IBM Corp., Armonk, New York) for complex samples. The data were split into demographic profiles so trends could be visualized. Specifically, we looked at the interaction between rural or urban residency, gender, and health literacy levels on the number of falls experienced in the past 30 days and the number of injuries that resulted from falls.
The health literacy assessment consisted of the following three questions and responses on a 5 point Likert scale:
1) How confident are you in filling out medical forms by yourself? For example, insurance forms, questionnaires, and doctor’s office forms. Would you say Possible responses were: 1) Not at all, 2) A little, 3) Somewhat, 4) Quite a bit, 5) Extremely, 7) Don’t know/not sure, 9) Refused.
2) How often do you have problems learning about your health condition because of difficulty in understanding written information? Would you say… Interviewer Probe: If respondent states they do not have a health condition, say: “This would include any routine visit to a doctor’s office for a physical exam, women’s health exam or men’s health exam.” Possible responses were: 1) Always, 2) Often, 3) Sometimes, 4) Rarely, 5) Never, 6) Never visited doctor’s office, 7) Don’t know/not sure, 9) Refused.
3) How often do you have someone help you read medical materials? For example: family member, friend, caregiver, doctor, nurse or other health professional. Would you say Possible responses were: 1) Always, 2) Often, 3) Sometimes, 4) Rarely, 5) Never, 7) Don’t know/not sure, 9) Refused.
Falls were defined as “when a person unintentionally comes to rest on the ground or another lower level.” Fall rates were assessed using a single question:
In the past 12 months, how many times have you fallen? Possible responses were: 1) number of times, 2) None, 3) Don’t know/Not sure and 4) Refused.
A follow up question was asked “Did this fall cause an injury?” only if the respondent indicated yes on the previous question. If more than one fall was reported, the prompt include How many of these falls caused an injury? By an injury, we mean the fall caused you to limit your regular activities for at least a day or to go see a doctor. Possible responses included: 1) number of falls, 2) none, 3) Don’t know/Not sure, 4) Refused.
Cumulative scores were calculated for responders who answered all three health literacy questions. We categorized respondents in the following manner: low health literacy (scores 3-8), moderate health literacy (scores 9-14) and high health literacy (score = 15). Therefore, all analyses utilized this trichotomized health literacy variable as the outcome rather than a scaled score. This study was approved by the Kansas Department of Health and Environment (KDHE) Institutional Review Board (IRB) and the Wichita State University IRB (HSC#3473).
Results
Among the 11,801 responders of the BRFSS survey, 5,638 participants were asked the specific supplemental questions including the health literacy questions and 5,494 responders answered all three health literacy questions (response rate = 97.5%). Most respondents reported moderate health literacy (61.1%), followed by high health literacy (31.4%), and low health literacy (7.5%). Respondents ≥ 65 years of age represented the second largest proportion of the low health literacy group (7.9%), following 45-54 year olds. young adults and the middle-aged were equally represented in the high health literacy group (Table 1).
Table 1. Weighted demographic and health status characteristics of Kansas BRFSS sample in relation to their health literacy (HL) (N=1,944,274)| Variable | Low HL | Moderate HL | High HL | ||||
| N | % | N | % | N | % | p-value | |
| Overall | 146,666 | 7.5 | 1,187,318 | 61.1 | 610,291 | 31.4 | |
| Sex | <.001 | ||||||
| Male | 88,129 | 9.2 | 606,077 | 63.5 | 260,127 | 27.3 | |
| Female | 58,537 | 5.9 | 581,352 | 58.7 | 350,164 | 35.4 | |
| Age | <.001 | ||||||
| 18 to24 years | 18,874 | 6.9 | 207,028 | 75.2 | 49,510 | 18.0 | |
| 25 to 34 years | 19,705 | 6.1 | 199,498 | 61.8 | 103,578 | 32.1 | |
| 35 to 44 years | 22,100 | 7.1 | 171,242 | 55.3 | 116,210 | 37.5 | |
| 45 to 54 years | 32,074 | 9.6 | 179,886 | 54.0 | 120,992 | 36.3 | |
| 55 to 64 years | 24,362 | 7.4 | 193,971 | 59.0 | 110,505 | 33.6 | |
| 65 and older | 29,552 | 7.9 | 235,803 | 62.9 | 109,496 | 29.2 | |
| Race | <.001 | ||||||
| N-H white | 89,571 | 5.7 | 967,363 | 61.9 | 505,892 | 32.4 | |
| N-H black | 5,559 | 5.5 | 59,418 | 59.1 | 35,597 | 35.4 | |
| N-H other | 4,613 | 8.2 | 36,892 | 65.3 | 15,008 | 26.6 | |
| N-H multi race | 3,449 | 8.8 | 20,994 | 53.6 | 14,722 | 37.6 | |
| Hispanic | 42,249 | 24.9 | 93,771 | 55.3 | 33,700 | 19.9 | |
| Marital status | <.001 | ||||||
| Partnered | 76,568 | 6.6 | 677,014 | 58.2 | 410,452 | 35.3 | |
| Not partnered | 69,990 | 9.0 | 505,506 | 65.3 | 198,372 | 25.6 | |
| Education | <.001 | ||||||
| Did not graduate high school | 51,752 | 27.8 | 114,420 | 61.4 | 20,223 | 10.8 | |
| High school graduate | 54,405 | 10.3 | 346,500 | 65.9 | 124,793 | 23.7 | |
| Some college or technical school | 32,839 | 4.8 | 439,990 | 64.0 | 214,241 | 31.2 | |
| Graduated college or technical school | 6,899 | 1.3 | 285,171 | 52.5 | 250,658 | 46.2 | |
| Employment | <.001 | ||||||
| Employed full time | 66,372 | 5.7 | 692,566 | 59.5 | 404,590 | 34.8 | |
| Not employed | 13,822 | 15.1 | 56,991 | 62.3 | 20,723 | 22.6 | |
| Homemaker | 10,973 | 9.1 | 70,848 | 58.6 | 39,167 | 32.4 | |
| Student | 2,770 | 2.4 | 90,065 | 79.3 | 20,792 | 18.3 | |
| Retired | 23,821 | 7.1 | 206,243 | 61.8 | 103,490 | 31.0 | |
| Unable to work | 24,729 | 22.6 | 64,498 | 58.9 | 20,315 | 18.5 | |
| Income | <.001 | ||||||
| <$15,000 | 23,491 | 17.2 | 87,995 | 64.3 | 25,327 | 18.5 | |
| $15,000 to <$25,000 | 32,548 | 12.9 | 168,057 | 66.9 | 50,787 | 20.2 | |
| $25,000 to <$35,000 | 15,976 | 7.9 | 124,615 | 61.4 | 62,343 | 30.7 | |
| $35,000 to <$50,000 | 13,269 | 4.7 | 188,846 | 66.9 | 80,366 | 28.5 | |
| $50,000+ | 22,680 | 2.9 | 430,286 | 55.5 | 322,531 | 41.6 | |
| Home ownership | <.001 | ||||||
| Own | 81,400 | 5.9 | 833,414 | 60.3 | 467,880 | 33.8 | |
| Rent | 52,838 | 12.0 | 279,378 | 63.3 | 108,850 | 24.7 | |
| Other arrangement | 12,428 | 11.2 | 67,786 | 61.2 | 30,501 | 27.5 | |
| Insurance status | <.001 | ||||||
| Has health care coverage | 103,414 | 6.1 | 1,023,766 | 60.8 | 556,816 | 33.1 | |
| Does not have health care coverage | 40,778 | 16.4 | 156,073 | 62.6 | 52,354 | 21.0 | |
| Metropolitan status code | <.001 | ||||||
| In MSA city code | 26,873 | 8.0 | 195,205 | 58.4 | 112,096 | 33.5 | |
| Within MSA city suburb but not city center | 16,330 | 4.0 | 239,317 | 58.7 | 151,852 | 37.3 | |
| Outside MSA | 37,728 | 9.5 | 249,618 | 62.9 | 109,638 | 27.6 | |
| Veteran status | 0.476 | ||||||
| Yes | 19,081 | 8.3 | 134,338 | 58.6 | 75,993 | 33.1 | |
| No | 127,585 | 7.4 | 1,051,431 | 61.4 | 533,686 | 31.2 | |
| General health rating | <.001 | ||||||
| Good or better health | 81,689 | 5.0 | 1,003,022 | 61.1 | 556,244 | 33.9 | |
| Poor or fair health | 63,774 | 21.3 | 181,287 | 60.6 | 54,047 | 18.1 | |
With respect to falls self-reported in the prior month, females appear to have a higher estimated mean number of falls than males, although there is a great deal of interaction between location of residence and health literacy levels (Table 2; Figure 1, Figure 2, Figure 3 & Figure 4). For males, the number of falls and injuries decreased with higher health literacy; metropolitan statistical area (MSA) city 1.4 to 0.2, MSA city suburb 1.0 – 0.3, Outside MSA city 1.0-0.5) (Table 2). The place of residence does not appear to significantly affect the number of falls experienced once the standard errors of measurement are taken into account, however, it may be likely that individuals with low health literacy experience more falls, particularly in urban environments. For females, these trends are more difficult to ascertain as many of the estimated profile means have larger standard errors. However, the trends do appear to be consistent with the male findings (Table 2).
Table 2. Weighted estimates of number of falls and fall related injuries within the past 12 months for individuals ≥ 65 years of age| Estimated population size | Falls in last 12 months | Estimated population size | Falls that resulted in injury | |
| (n) | (n) | |||
| Profile | Mean (95% CI) | Mean (95% CI) | ||
| Overall | 3,26,559 | 0.7 (0.55-0.77) | 1,01,790 | 0.5 (0.41-0.57) |
| Males | ||||
|---|---|---|---|---|
| Male x In MSA City x Low HL | 3718 | 1.4 (0.28-2.46) | 1971 | 0.8 (0.15-1.40) |
| Male x In MSA City x Moderate HL | 23,628 | 0.6 (0.28-0.88) | 7,153 | 0.2 (0.07-0.39) |
| Male x In MSA City x High HL | 13025 | 0.2 (0.10-0.39) | 2390 | 0.5 (0.19-0.79) |
| Male x MSA City Suburb x Low HL | 3719 | 1.0 (-0.05-2.09) | 1397 | 1.0 (0.28-1.70) |
| Male x MSA City Suburb x Moderate HL | 31325 | 0.6 (0.38-0.85) | 10988 | 0.5 (0.19-0.77) |
| Male x MSA City Suburb x High HL | 15225 | 0.3 (0.12-0.39) | 3508 | 0.2 (-0.01-0.40) |
| Male x Outside MSA City x Low HL | 6415 | 1.0 (0.32-1.64) | 2544 | 0.1 (-0.09-0.30) |
| Male x Outside MSA City x Moderate HL | 34531 | 0.7 (0.38-0.96) | 9434 | 0.3 (0.11-0.53) |
| Male x Outside MSA City x High HL | 9354 | 0.5 (0.19-0.83) | 2524 | 0.3 (-0.00-0.55) |
| Females | ||||
| Female x In MSA City x Low HL | 3540 | 2.9 (-0.89-6.70) | 1826 | 0.6 (0.17-1.13) |
| Female x In MSA City x Moderate HL | 32899 | 0.7 (0.46-0.93) | 11498 | 0.5 (0.25-0.84) |
| Female x In MSA City x High HL | 16784 | 0.3 (0.16-0.50) | 3553 | 0.1 (0.01-0.28) |
| Female x MSA City Suburb x Low HL | 1701 | 0.3 (-0.05-2.09) | 488 | 0.4 (-0.27-1.05) |
| Female x MSA City Suburb x Moderate HL | 41730 | 0.6 (0.38-0.89) | 13099 | 0.6 (0.37-0.76) |
| Female x MSA City Suburb x High HL | 21980 | 1.0 (0.04-2.04) | 7867 | 0.6 (0.34-0.83) |
| Female x Outside MSA City x Low HL | 5746 | 1.1 (0.32-1.97) | 2452 | 0.5 (0.10-0.89) |
| Female x Outside MSA City x Moderate HL | 44353 | 0.7 (0.49-0.86) | 15111 | 0.7 (0.39-0.99) |
| Female x Outside MSA City x High HL | 16888 | 0.4 (0.23-0.61) | 3986 | 0.5 (0.24-0.76) |
Figure 1.The average number of falls, with 95% confidence intervals, experienced by males in the past 12 months by residency and health literacy level.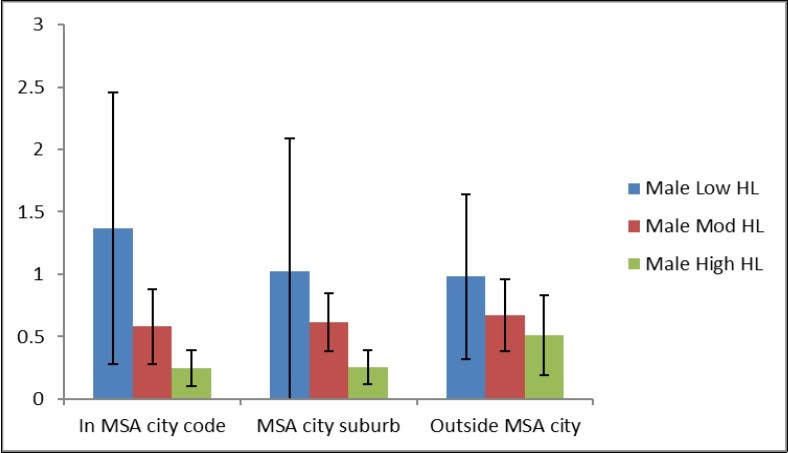
Figure 2.The average number of falls, with 95% confidence intervals, experienced by females in the past 12 months by residency and health literacy level.
With respect to falls that resulted in injury in the prior month, females appear to have a higher estimated mean number of falls than males, although there is a great deal of interaction between location of residence and health literacy levels (Table 2; Figure 1 and Figure 2). For males, the number of falls and injuries decreased with higher health literacy (Table 2). For females, these trends are more difficult to ascertain as many of the estimated profile means have larger standard errors. However, the trends do appear to be consistent with the male findings (Table 2).
Figure 3.The average number of injurious falls, with 95% confidence intervals, experienced by males in the past 12 months by residency and health literacy level.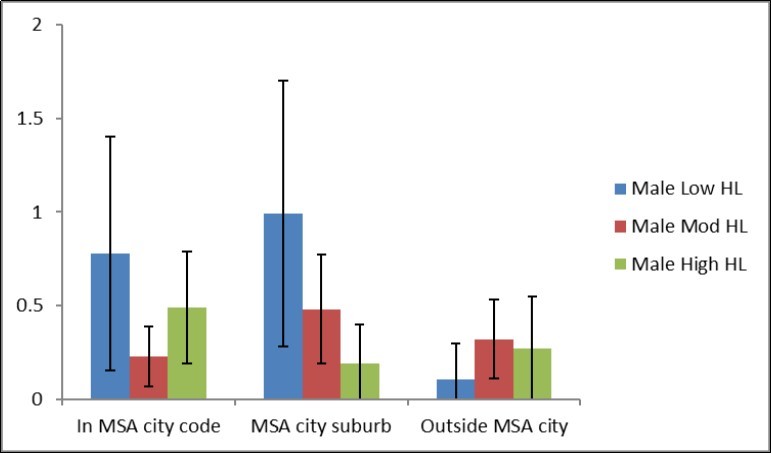
Figure 4.The average number of injurious falls, with 95% confidence intervals, experienced by females in the past 12 months by residency and health literacy level.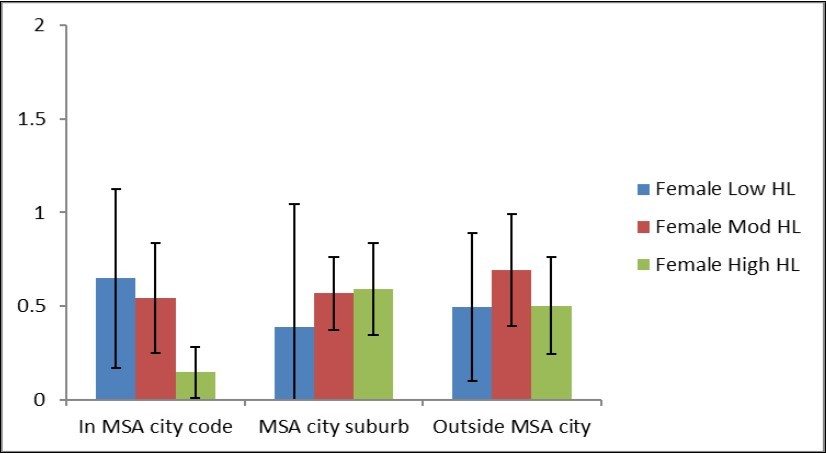
Discussion
This study utilized a three question screening tool as part of the statewide BRFSS survey 9. Study findings reinforces the literature that health status is related to health literacy particularly for older adults 10, 11. However, limited evidence investigating health literacy and older adults exists. The findings support the importance of addressing fall prevention for older adults. Although a number of viable fall prevention programs have shown promise 12, 13, 14, 15, 16, 17, none of these interventions applied plain language methodology specifically addressing low health literacy. Education about falls, specifically fall prevention, should include materials developed with low health literacy in mind 5. As identified in our study results, fall prevention programs that target the recruitment and education of women and caretakers of female older adults are needed 4. It also appears that interventions in metropolitan areas of Kansas are warranted. Implications for the dual approach of addressing fall prevention and health literacy for the older adult include quality of life, clinician patient communication and treatment compliance. Physician prescribed physical activity is one method that has shown success and may be a viable option for fall prevention interventions for this population 18. Demographic differences in fall rates continue for older adults. Health literacy rates appear to be impacting these demographic characteristics.
Limitations
This study utilized cross-sectional data from one Midwestern state with validated methodology 9, 19, 20. Several limitations should be considered. This is a brief report of a sub-set of data including self-reported health literacy rates, falls, related injuries. Self-reported survey data and are subject to possible response bias, although self-reported health literacy rates have been demonstrated as reliable for a variety of skills 21. Due to the length, survey fatigue may have affected responses. Additionally, as part of the study design, data were limited to questions included for the supplemental (optional) arm for the BRFSS module. The cross-sectional nature of the data study results may not be generalizable to other states with different population characteristics.
Conclusions
Implications for population level issues include cost savings for the health care system and evidence for building public health interventions for the increasing older adult population.
The implications of this study’s findings are relevant to both health practitioners and researchers. Interventions and programs directed at multiple levels are necessary to improve health literacy and the poorer outcomes associated with health literacy rates for the older adults population. Targeted educational interventions for the female population of older adults living in both urban and rural settings for fall prevention are needed. Future research is needed to assess the validity of these results using a multi-state approach.
References
- 1.E M Abdel-Rahman. (2011) Long-term morbidity and mortality related to falls in hemodialysis patients: role of age and gender - a pilot study. Nephron Clin Pract. 118(3), 278-84.
- 2.Formiga F. (2006) [Characteristics of falls producing hip fracture in an elderly population. Differences according to age and gender]. Rev Clin Esp. 206(7), 314-8.
- 3.Lim Y. (2016) Gender- and age-group-specific associations between physical performance and bone mineral density, falls, and osteoporotic fractures in Koreans: the Chungju Metabolic Disease Cohort study. J Bone Miner Metab. 34(3), 336-46.
- 4.Zhang Y. (2017) Age- and gender-specific associations between insomnia and falls in Boston Puerto Rican adults. Qual Life Res. 26(1), 25-34.
- 5.Andrade I, Silva C, A C Martins. (2017) Application of the Health Literacy INDEX on the development of a manual for prevention of falls for older adults. Patient Educ Couns. 100(1), 154-159.
- 6.Otal D. (2012) Parent health literacy and satisfaction with plain language education materials in a pediatric surgery outpatient clinic: a pilot study. J Pediatr Surg. 47(5), 964-9.
- 7.Stableford S, Mettger W. (2007) Plain language: a strategic response to the health literacy challenge. J Public Health Policy. 28(1), 71-93.
- 8.Chesser A. (2014) Integrating Health Literacy Questions into a Statewide Behavioral Risk Factor Surveillance System (BRFSS) Questionnaire. 7(2), 96-103.
- 9.Woods Keene, N, A K Chesser. (2017) Validation of a Single Question Health Literacy Screening Tool for Older Adults. Gerontol Geriatr Med. 3, 2333721417713095.
- 10.A D Federman. (2014) Asthma outcomes are poor among older adults with low health literacy. , J Asthma 51(2), 162-7.
- 11.Yamashita T, C S Kart. (2011) Is diabetes-specific health literacy associated with diabetes-related outcomes in older adults? J Diabetes. 3(2), 138-46.
- 12.Bamgbade S, Dearmon V. (2016) Fall Prevention for Older Adults Receiving Home Healthcare. Home Healthc Now. 34(2), 68-75.
- 13.Boongird C. (2017) Effects of a simple home-based exercise program on fall prevention in older adults: A 12-month primary care setting, randomized controlled trial. Geriatr Gerontol Int.
- 14.El-Khoury F. (2015) The effect of fall prevention exercise programmes on fall induced injuries in community dwelling older adults. , Br J Sports Med 49(20), 1348.
- 15.Osho O, Owoeye O, Armijo-Olivo S. (2017) Adherence and Attrition in Fall Prevention Exercise Programs for Community-Dwelling Older Adults: A Systematic Review and Meta-Analysis. J Aging Phys Act. 1-34.
- 16.E A Phelan. (2016) Adoption of Evidence-Based Fall Prevention Practices in Primary Care for Older Adults with a History of Falls. Front Public Health. 4, 190.
- 18.A L Zaleski. (2016) Coming of Age: Considerations in the Prescription of Exercise for Older Adults. Methodist Debakey Cardiovasc J. 12(2), 98-104.
- 19.D E Nelson. (2001) Reliability and validity of measures from the Behavioral Risk Factor Surveillance System. (BRFSS).Sozial-und Praventivmedizin,46Suppl1:p.S3-42
Cited by (5)
- 1.Mgbeojedo Ukamaka Gloria, Akosile Christopher Olusanjo, Okoye Emmanuel Chiebuka, Ani Kenneth Umezulike, Ekechukwu Echezona Nelson, et al, 2023, Effects of Otago Exercise Program on Physical and Psychosocial Functions Among Community-Dwelling and Institutionalized Older Adults: A Scoping Review, INQUIRY: The Journal of Health Care Organization, Provision, and Financing, 60(), 004695802311658, 10.1177/00469580231165858
- 2.Lim Mei Ling, van Schooten Kimberley S., Radford Kylie A, Delbaere Kim, 2022, Development and initial validation of the falls health literacy scale, Maturitas, 159(), 40, 10.1016/j.maturitas.2021.12.002
- 3.TURHAN DAMAR Hale, CİRİTOĞLU Burcu, ASLAN Gül, ÖZTÜRK Merdiye, 2023, Investigating the Relationship between Fall Prevention Behaviors and Health Literacy in Hospitalized Older Patients, Geriatrik Bilimler Dergisi, 6(1), 1, 10.47141/geriatrik.1218729
- 4.Deshpande Ojas A, Tawfik John A, Namavar Aram A, Nguyen KimNgan P, Vangala Sitaram S, et al, 2022, A Prospective Observational Study Assessing the Impacts of Health Literacy and Psychosocial Determinants of Health on 30-day Readmission Risk, Journal of Patient Experience, 9(), 237437352210791, 10.1177/23743735221079140
- 5.Lim Mei Ling, van Schooten Kimberley S, Radford Kylie A, Hadjistavropoulos Thomas, Everett Bronwyn, et al, 2023, Theoretical framework of concerns about falling in older people: the role of health literacy, Health Promotion International, 38(5), 10.1093/heapro/daad122